

The role of pyroptosis-related lncRNA risk signature in ovarian cancer prognosis and immune system
- PMID: 37597098
- PMCID: PMC10439870
- DOI: 10.1007/s12672-023-00767-3
The role of pyroptosis-related lncRNA risk signature in ovarian cancer prognosis and immune system
Abstract
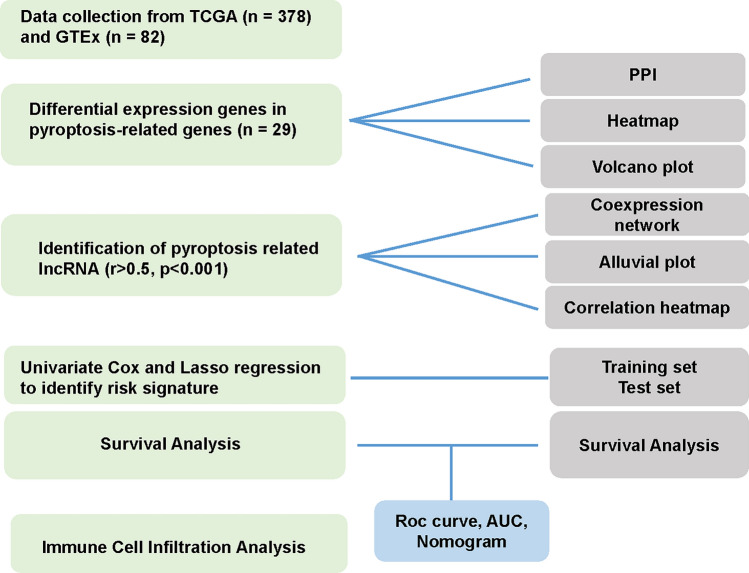
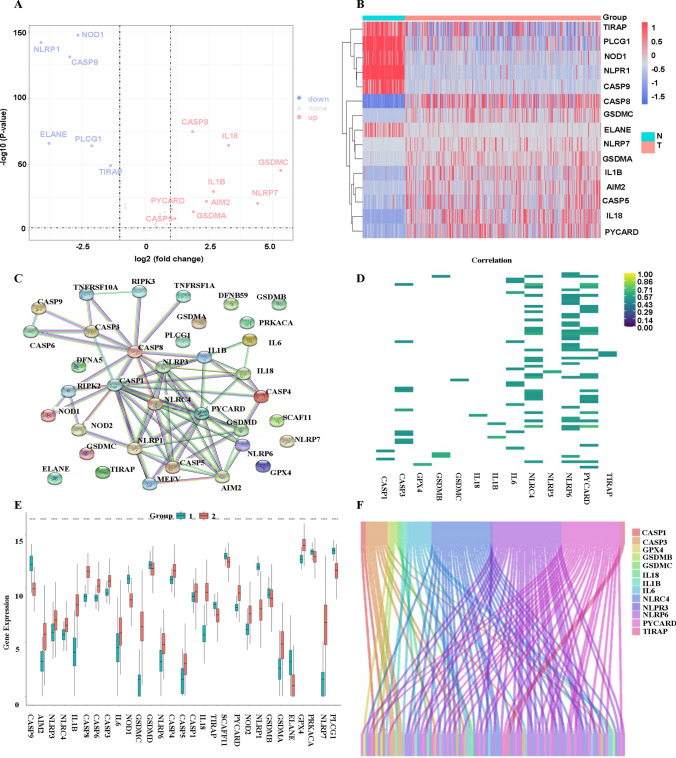
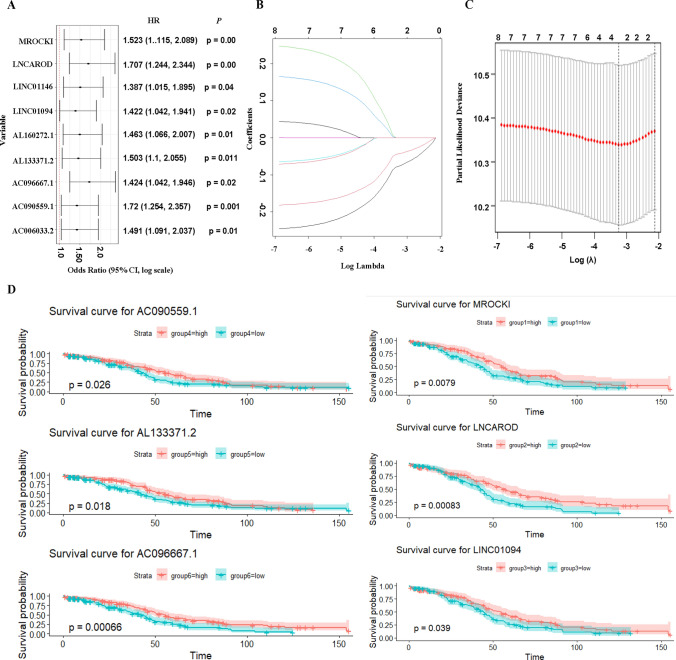
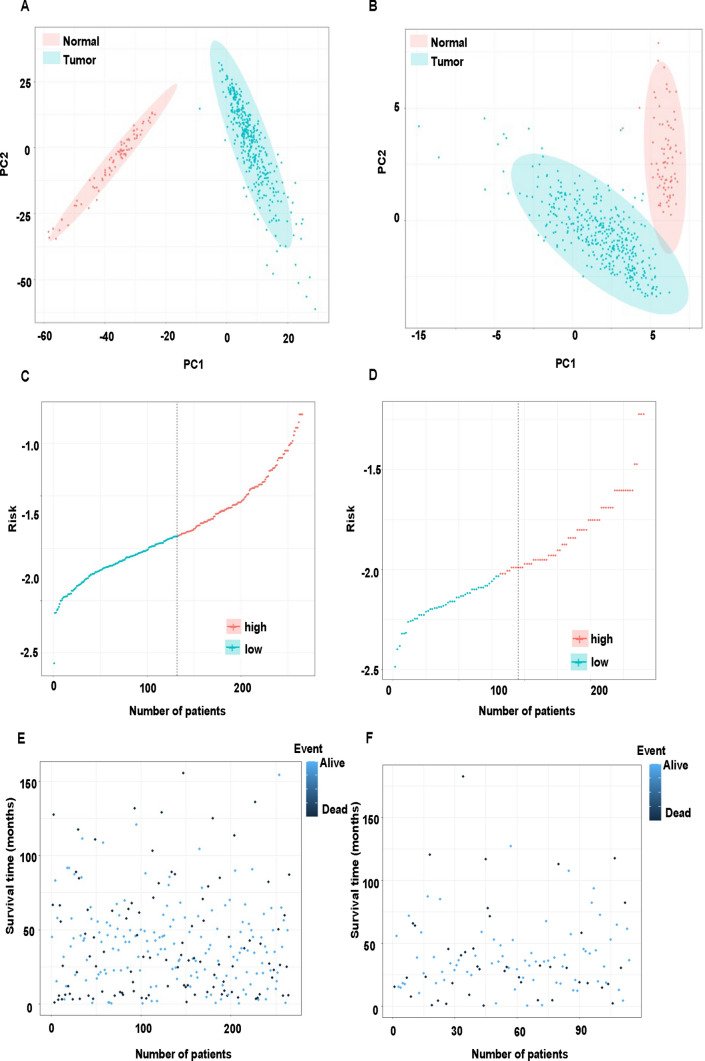
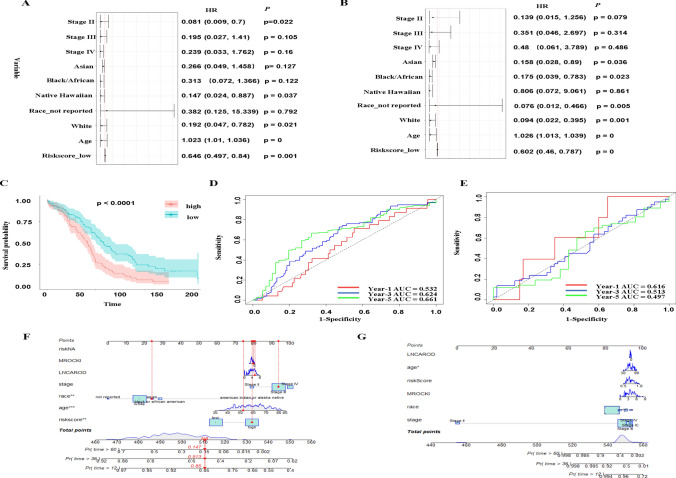
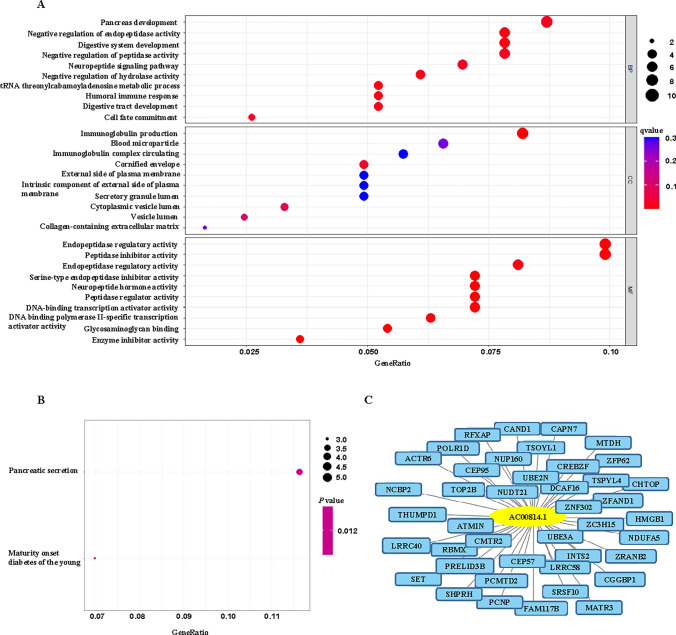
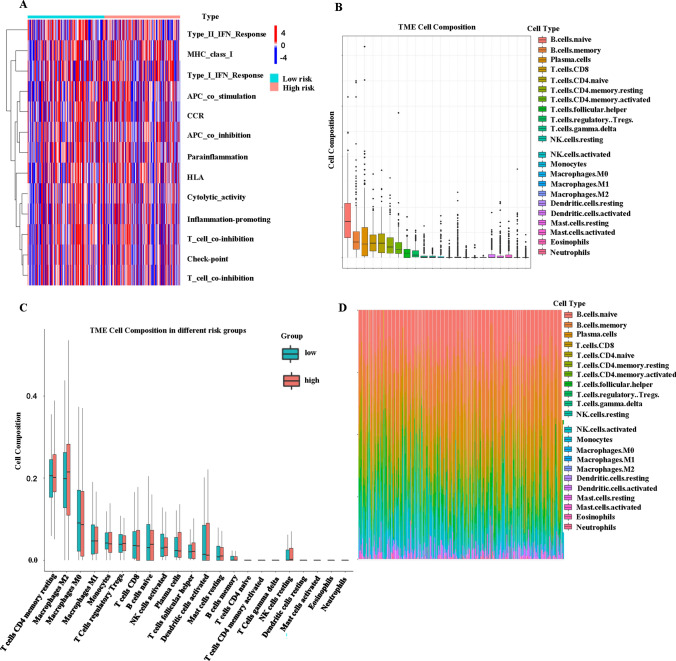
Ovarian cancer is a leading cause of death in females with gynecologic cancers. Pyroptosis is a relatively new discovered programmed cell death that is believed to be associated with inflammation. However, studies on pyroptosis-related lncRNAs in ovarian cancer are limited. In this study, we identified 29 pyroptosis-related genes and screened out 72 pyroptosis-related lncRNAs. Furthermore, the 72 lncRNAs were eliminated to 2 survival-related lncRNAs using Cox regression and Lasso regression to build an ovarian cancer prognostic prediction signature and were further validated on the test set. We adopted a riskscore from the two-gene signature, and the survival in low-risk group was higher than the high-risk group. Functional enrichment analysis indicated that the differentially expressed genes (DEGs) between two risk groups were associated with tumor immunity. This study implies that pyroptosis-related genes are closely related to tumor immunity and could be potential therapeutic factors for ovarian cancer treatment.
Keywords: Immune system; LncRNA; Ovarian cancer; Pyroptosis; Target.
© 2023. Springer Science+Business Media, LLC.
Conflict of interest statement
The authors declare that the research was conducted in the absence of any commercial or financial relationships that could be construed as a potential competing interests.
Figures
Similar articles
-
Identification of a pyroptosis-related long non-coding RNA Signature for prognosis and its related ceRNA regulatory network of ovarian cancer.J Cancer. 2023 Sep 25;14(16):3151-3168. doi: 10.7150/jca.88485. eCollection 2023. J Cancer. 2023. PMID: 37859811 Free PMC article.
-
Construction and Validation of a Novel Pyroptosis-Related Four-lncRNA Prognostic Signature Related to Gastric Cancer and Immune Infiltration.Front Immunol. 2022 Mar 22;13:854785. doi: 10.3389/fimmu.2022.854785. eCollection 2022. Front Immunol. 2022. PMID: 35392086 Free PMC article.
-
Identification and Validation of a Three Pyroptosis-Related lncRNA Signature for Prognosis Prediction in Lung Adenocarcinoma.Front Genet. 2022 Jul 19;13:838624. doi: 10.3389/fgene.2022.838624. eCollection 2022. Front Genet. 2022. PMID: 35928454 Free PMC article.
-
A pyroptosis-related lncRNA signature predicts prognosis and immune microenvironment in head and neck squamous cell carcinoma.Int Immunopharmacol. 2021 Dec;101(Pt B):108268. doi: 10.1016/j.intimp.2021.108268. Epub 2021 Oct 20. Int Immunopharmacol. 2021. PMID: 34688154
-
Identification of a pyroptosis-associated long non-coding RNA signature for predicting the immune status and prognosis in skin cutaneous melanoma.Eur Rev Med Pharmacol Sci. 2021 Sep;25(18):5597-5609. doi: 10.26355/eurrev_202109_26779. Eur Rev Med Pharmacol Sci. 2021. PMID: 34604952
Cited by
-
A Pyroptosis-Related LncRNA Signature for Predicting Prognosis, Immune Features and Drug Sensitivity in Ovarian Cancer.Onco Targets Ther. 2025 Apr 23;18:585-601. doi: 10.2147/OTT.S491130. eCollection 2025. Onco Targets Ther. 2025. PMID: 40291608 Free PMC article.
-
Bioinformatic and experimental data pertaining to the role of the NLRP3 inflammasome in ovarian cancer.J Cancer Res Clin Oncol. 2024 Nov 8;150(11):488. doi: 10.1007/s00432-024-05988-9. J Cancer Res Clin Oncol. 2024. PMID: 39516433 Free PMC article. Review.
-
Ferroptosis-related LncRNAs in diseases.BMC Biol. 2025 Jun 6;23(1):158. doi: 10.1186/s12915-025-02268-x. BMC Biol. 2025. PMID: 40481573 Free PMC article. Review.
References
LinkOut - more resources
Full Text Sources