. 2023 Oct 30;35(11):4111-4132.
doi: 10.1093/plcell/koad216.

Biosynthesis of gibberellin-related compounds modulates far-red light responses in the liverwort Marchantia polymorpha

Affiliations

Biosynthesis of gibberellin-related compounds modulates far-red light responses in the liverwort Marchantia polymorpha

Rui Sun et al. Plant Cell. .

Abstract

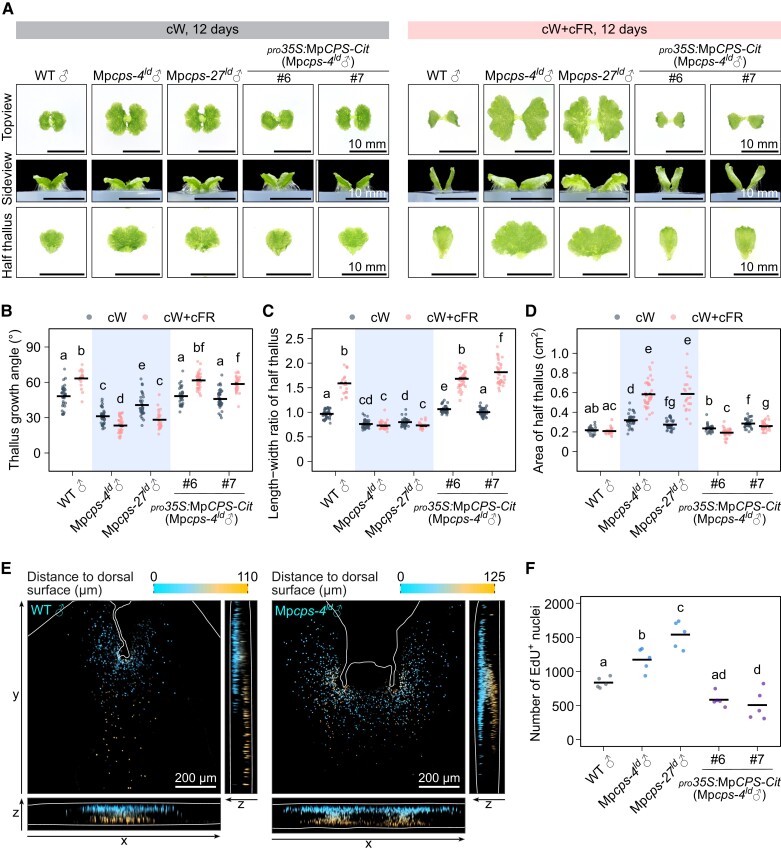
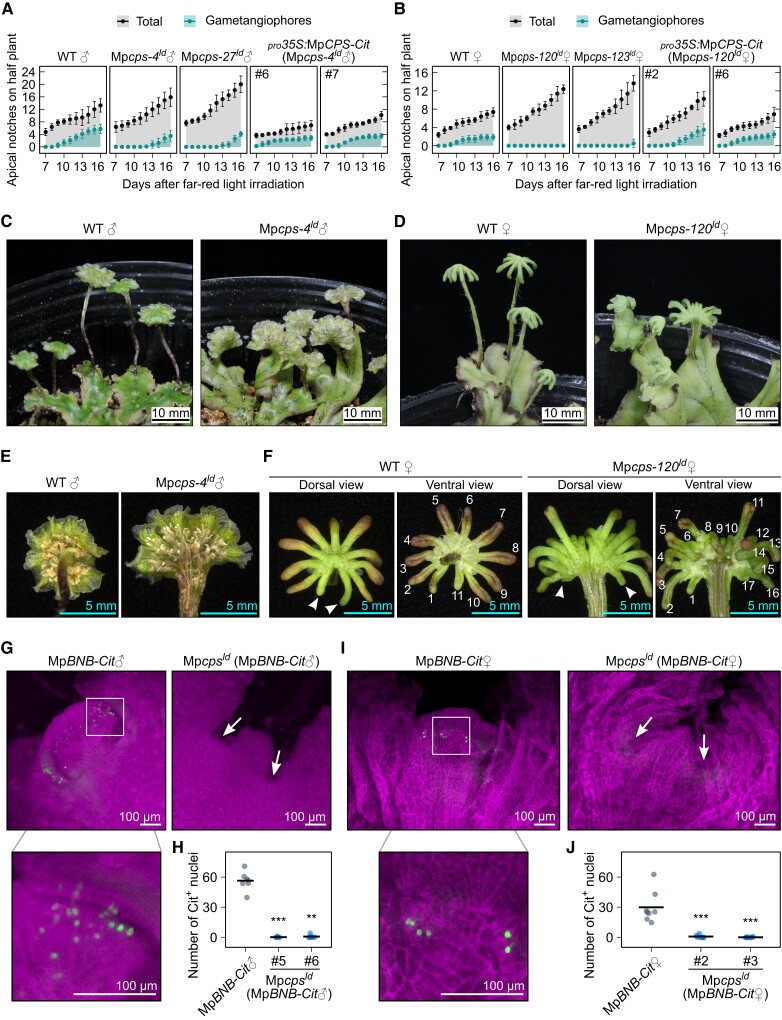
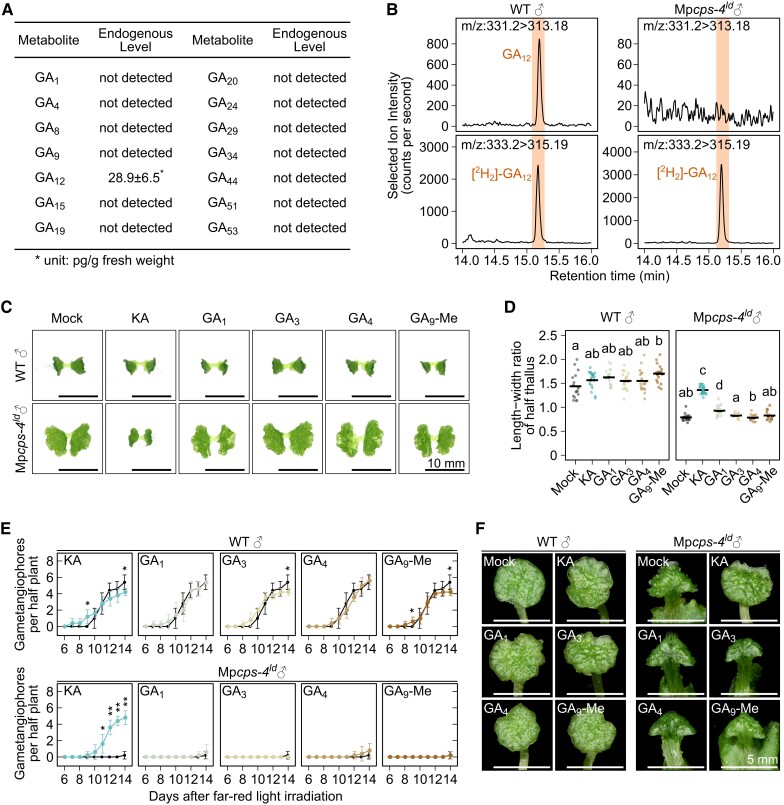
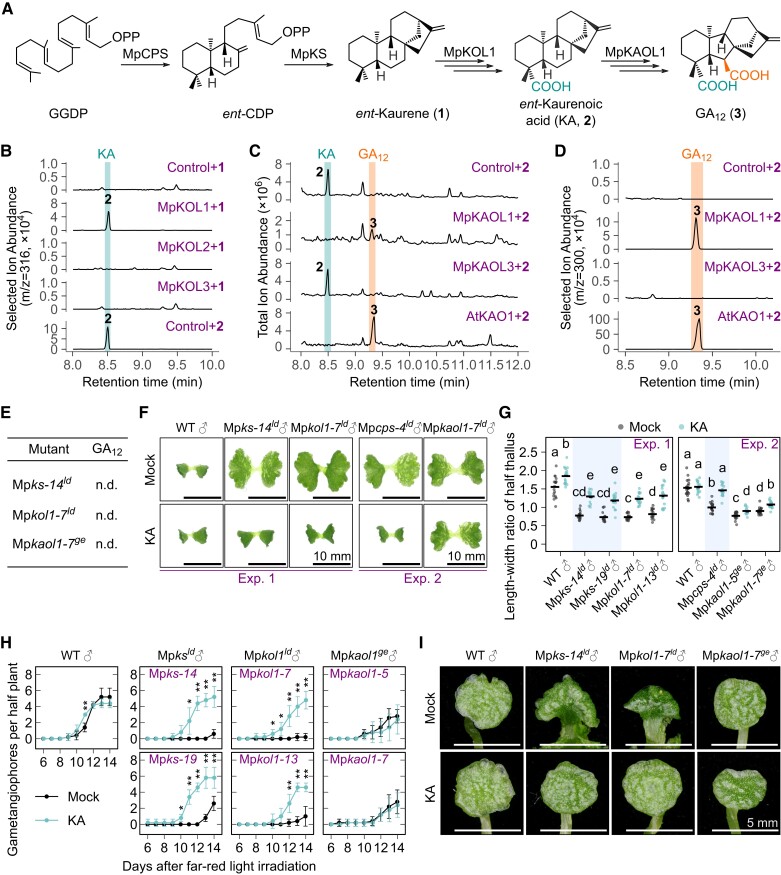
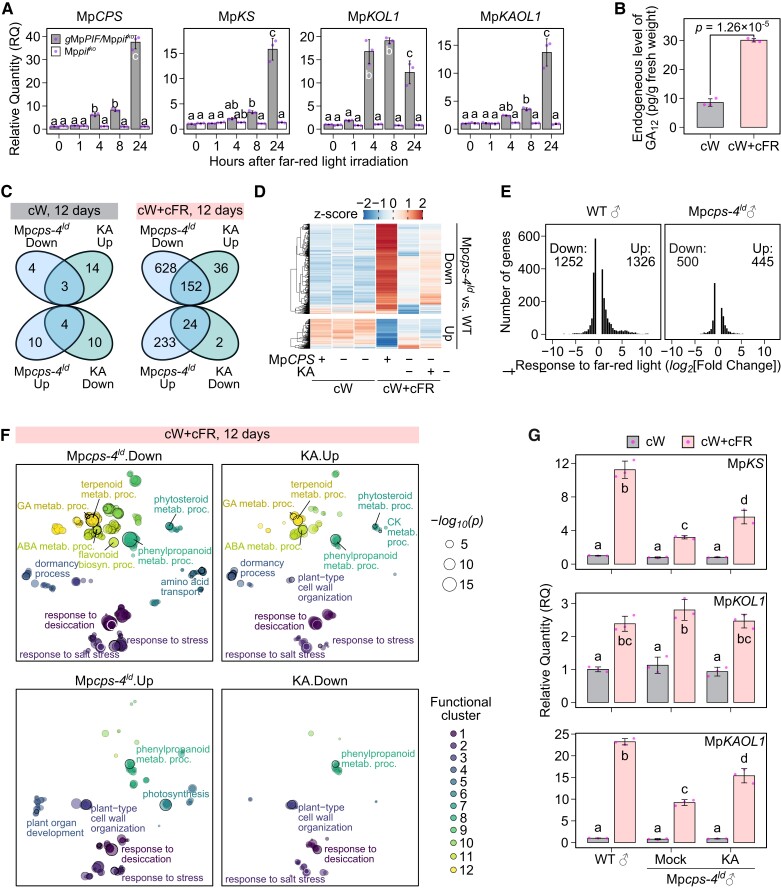
Gibberellins (GAs) are key phytohormones that regulate growth, development, and environmental responses in angiosperms. From an evolutionary perspective, all major steps of GA biosynthesis are conserved among vascular plants, while GA biosynthesis intermediates such as ent-kaurenoic acid (KA) are also produced by bryophytes. Here, we show that in the liverwort Marchantia polymorpha, KA and GA12 are synthesized by evolutionarily conserved enzymes, which are required for developmental responses to far-red light (FR). Under FR-enriched conditions, mutants of various biosynthesis enzymes consistently exhibited altered thallus growth allometry, delayed initiation of gametogenesis, and abnormal morphology of gamete-bearing structures (gametangiophores). By chemical treatments and liquid chromatography-tandem mass spectrometry (LC-MS/MS) analyses, we confirmed that these phenotypes were caused by the deficiency of some GA-related compounds derived from KA, but not bioactive GAs from vascular plants. Transcriptome analysis showed that FR enrichment induced the up-regulation of genes related to stress responses and secondary metabolism in M. polymorpha, which was largely dependent on the biosynthesis of GA-related compounds. Due to the lack of canonical GA receptors in bryophytes, we hypothesize that GA-related compounds are commonly synthesized in land plants but were co-opted independently to regulate responses to light quality change in different plant lineages during the past 450 million years of evolution.


Conflict of interest statement

Conflict of interest statement. None declared.

Figures

Figure 1.
Figure 1.
Loss of MpCPS function alters thallus morphology under far-red light (FR) enriched conditions. A) Morphology of 12-day-old plants grown from gemmae under continuous white light (cW) or continuous white light with far-red light (cW + cFR) conditions. Images were selected randomly from different plants. WT♂ refers to Tak-1 wild-type plants, and “ld” refers to large-deletion mutant generated by the CRISPR/Cas9D10A nickase system. Bars = 10 mm. B to D) Measurements of the thallus growth angle (B), length-width ratio (C), and thallus area (D) from half plants shown in (A). Each dot represents data from “half thalli” (n = 21–36), which was developed from a single meristem of the gemma. Horizontal lines represent mean values. Letters represent statistical differences, and groups with no common letters were significantly different (adjusted P < 0.05, nonpooled Welch's t-test with Benjamini–Hochberg adjustment). E) Apical regions of plants labeled with 5-ethynyl-2′-deoxyuridine (EdU) after 7-day growth in cW + cFR, showing 2D projections of color-coded z-stacks. White lines mark the boundary of plants or imaging area. F) Number of nuclei with positive EdU signals in the apical regions of 7-day-old plants grown in cW + cFR. Dots represent data from apical regions of different plants (n = 5), and horizontal lines represent mean values. Letters represent statistical differences calculated by Tukey's HSD test (adjusted P < 0.05).
Figure 2.
Figure 2.
MpCPS is required for delayed sexual reproduction and affected gametangiophore morphology. A, B) Progress of apical bifurcation and gametangiophore formation in male (A) and female (B) plants, which were cultured aseptically under continuous white light (cW) for 7 days before transferred to continuous white light with far-red light (cW + cFR) as half thalli (thallus fragments developed from a single meristem of the gemma). WT♂ and WT♀ refer to Tak-1 and Tak-2 wild-type plants, respectively. In the mutant alleles, “ld” refers to large-deletion mutant generated by the CRISPR/Cas9D10A nickase system. Dots and error bars represent means and standard deviations (mean ± SD). For each subplot, data were counted from 8 half-thalli. C, D) Photos of male (C) and female (D) plants bearing gametangiophores, cultured on vermiculite under cW + cFR from thallus fragments for 81 and 63 days, respectively. E) Ventral view of antheridiophores. F) Dorsal and ventral view of archegoniophores. Arrowheads indicate marginal digitate rays, and the number of digitate rays was labeled in the ventral view. G to J) Fluorescence microscopic images and quantification of MpBNB-Citrine (MpBNB-Cit) accumulation in the apical regions of 11-day-old male (G, H, dorsal view), or 14-day-old female (I, J, ventral view) plants cultured under cW + cFR from gemmae. G, I) Z-projections of image stacks, with cell walls stained with calcofluor white (purple) and Citrine signals shown in green. Arrows indicate apical meristems. The regions outlined with boxes are shown as enlarged images below. H, J) Number of Citrine-positive (Cit+) nuclei counted from projection of image stacks. Each dot represents data from 1/2 (H) or 1/4 (J) of the thallus, and horizontal lines represent mean values. Asterisks show statistical difference compared to the control group (Mann–Whitney U test; **, P < 0.01; ***, P < 0.001). n = 7 for (H), n = 8 for (J).
Figure 3.
Figure 3.
Endogenous levels of and responsiveness to ent-kaurenoic acid (KA) or GAs in wild-type and Mpcps-4ld plants. In Mpcps-4ld, “ld” refers to large-deletion mutant generated by the CRISPR/Cas9D10A nickase system. A) Endogenous levels of GAs measured in wild-type plants (Tak-1) by liquid chromatography–tandem mass spectrometry (LC-MS/MS). B) Selected ion chromatography showing peak of endogenous GA12 in comparison with the 2H2-labeled internal standard. For (A, B), plants were cultured under continuous white light (cW) for 10 days, then induced under continuous white light with far-red light (cW + cFR) for 4 days. C, D) Effect of 2-μM KA or GAs on the morphology of 12-day-old thalli cultured under cW + cFR from gemmae. Bars = 10 mm in (C). For (D), dots represent data from half thalli (n = 16–18), horizontal bars in represent mean values, and letters represent multiple comparisons with nonpooled Welch's t-test and Benjamini–Hochberg adjustment (adjusted P < 0.05 for nonoverlapping letters). E, F) Effect of 2-μM KA or GAs on gametangiophore formation (E) and morphology (F). Plants were cultured aseptically under cW for 7 days before transferred to cW + cFR. For (E), dots and error bars represent means and standard deviations (mean ± SD) (n = 5, half thalli), and asterisks show statistical difference compared to the mock group by Kruskal–Wallis test (*, P < 0.05; **, P < 0.01; ***, P < 0.001). Data from the mock group are presented repeatedly in each subplot for comparison. Bars = 5 mm in (F).
Figure 4.
Figure 4.
Biosynthetic route for GA12 production in M. polymorpha. A) Proposed enzymatic steps for GA12 biosynthesis in M. polymorpha. Multiple arrows indicate ellipsis of intermediate steps. B to D) Gas chromatography–mass spectrometry (GC-MS) analysis showing conversion of ent-kaurene to ent-kaurenoic acid (KA) (B), and KA to GA12(C, D) by yeast cultures expressing KO and KAO homologs. E) Biosynthesis mutants with GA12 below the detection limit. n.d., not detected. In the mutant alleles, “ld” refers to large-deletion mutant generated by the CRISPR/Cas9D10A nickase system, while “ge” refers to genome editing by CRISPR/Cas9. F to G) Morphology of 12-day-old mutants grown under continuous white light with far-red light (cW + cFR) with or without 2 μM KA. Data shown here were collected from two different experiments, as indicated by “Exp. 1” and “Exp. 2”. Bars = 10 mm in (F). For (G), each dot represents data from a “half thallus” (n = 14–18), horizontal bars represent mean values, and letters represent multiple comparisons with nonpooled Welch's t-test and Benjamini–Hochberg adjustment (adjusted P < 0.05 for nonoverlapping letters). H to I) Gametangiophore formation progress (H) and morphology (I) of mutants, cultured aseptically under continuous white light (cW) for 7 days before transferred to cW + cFR and treated with 2 μM KA. For (H), dots and error bars represent means and standard deviations (mean ± SD) (n = 5, half-thalli), and asterisks show statistical difference by Kruskal–Wallis test (*, P < 0.05; **, P < 0.01; ***, P < 0.001). Bars = 5 mm in (I).
Figure 5.
Figure 5.
Transcriptional regulation related to GAMp biosynthesis in M. polymorpha. A) Relative expression level of GA biosynthesis genes by RT-qPCR in Mppifko and its complementation line. In Mppifko, “ko” refers to homologous recombination-mediated knockout. Plants were cultured under continuous white light (cW) for 7 days before treated with supplemental far-red light (cW + cFR). Each dot represents data from a sample of pooled whole thallus tissue (n = 3), and error bars represent mean ± SD. Letters represent multiple comparisons with Tukey's HSD test (adjusted P < 0.05 for nonoverlapping letters). B) Endogenous level of GA12 in wild-type (Tak-1) plants cultured under cW for 10 days, then under cW or cW + cFR for 4 days. The data for cW + cFR group are the same as in Fig. 3A. The P-value was calculated by Student's t-test from different samples of whole thallus tissue (n = 3). C) Number of differentially expressed genes (DEGs) between 12-day-old Mpcps-4ld and Tak-1 plants, or Mpcps-4ld plants grown with or without 2 μM ent-kaurenoic acid (KA) under indicated light conditions (Wald test with Benjamini–Hochberg adjustment by DESeq2, DEG defined as adjusted P < 0.01 and |log2(Fold Change)|>0.585). D) Expression patterns of up- and down-regulated genes in Mpcps-4ld under cW + cFR. In each group, genes were clustered by z-scores, which represent the normalized relative expression levels across samples. E) Distribution of DEGs induced by FR enrichment in Tak-1 and Mpcps-4ld plants, comparing transcriptomes of cW + cFR to cW conditions. F) GO term enrichment analysis of DEG sets shown in (C). Each dot shows a significant enriched biological process term (P < 0.01 by Fisher's exact test), and semantically similar terms were plotted in color-coded clusters. Selected terms were highlighted with annotations. ABA, abscisic acid; CK, cytokinin; metab. proc., metabolic process. See Supplemental Data Set 2 for full lists. G) Relative expression level of GA biosynthesis genes by RT-qPCR in plants cultured under cW for 11 days, then transferred to cW + cFR with or without 2-μM KA treatment. Each dot represents data from a sample of pooled whole thallus tissue (n = 3), and error bars represent mean ± SD. Letters represent multiple comparisons with Tukey's HSD test (adjusted P < 0.05 for nonoverlapping letters).

References

    1. Achard P, Gusti A, Cheminant S, Alioua M, Dhondt S, Coppens F, Beemster GTS, Genschik P. Gibberellin signaling controls cell proliferation rate in Arabidopsis. Curr Biol. 2009:19(14):1188–1193. 10.1016/j.cub.2009.05.059 - DOI - PubMed
    1. Aki SS, Mikami T, Naramoto S, Nishihama R, Ishizaki K, Kojima M, Takebayashi Y, Sakakibara H, Kyozuka J, Kohchi T, et al. . Cytokinin signaling is essential for organ formation in Marchantia polymorpha. Plant Cell Physiol. 2019:60(8):1842–1854. 10.1093/pcp/pcz100 - DOI - PubMed
    1. Alexa A, Rahnenfuhrer J. topGO: enrichment analysis for gene ontology. R package version 2.50.02022.
    1. Althoff F, Kopischke S, Zobell O, Ide K, Ishizaki K, Kohchi T, Zachgo S. Comparison of the MpEF1α and CaMV35 promoters for application in Marchantia polymorpha overexpression studies. Transgenic Res. 2014:23(2):235–244. 10.1007/s11248-013-9746-z - DOI - PubMed
    1. Altschul SF, Gish W, Miller W, Myers EW, Lipman DJ. Basic local alignment search tool. J Mol Biol. 1990:215(3):403–410. 10.1016/S0022-2836(05)80360-2 - DOI - PubMed