. 2023 Sep 15;4(3):102522.
doi: 10.1016/j.xpro.2023.102522. Epub 2023 Aug 18.

Using Taxol-sensitized budding yeast to investigate the effect of microtubule stabilization on anaphase onset

Affiliations

Using Taxol-sensitized budding yeast to investigate the effect of microtubule stabilization on anaphase onset

Angela R Bunning et al. STAR Protoc. .

Abstract

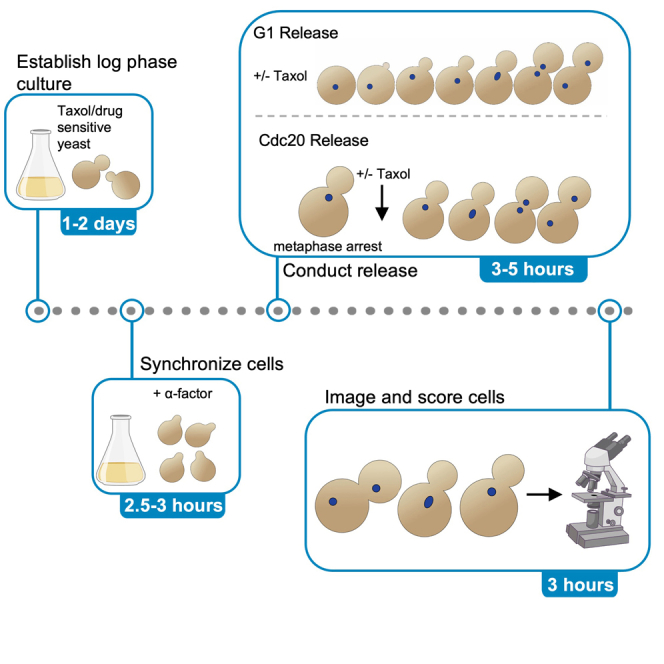
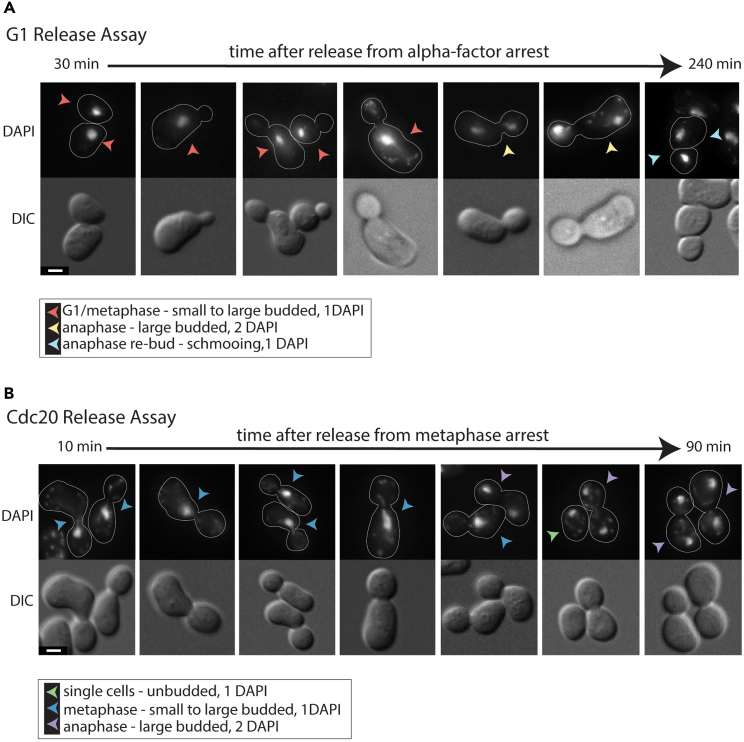
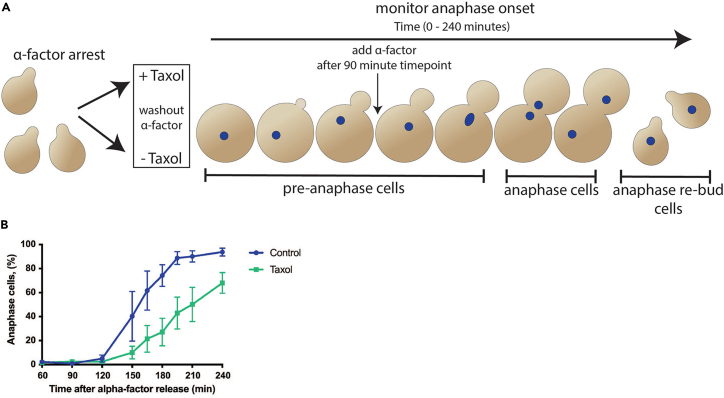
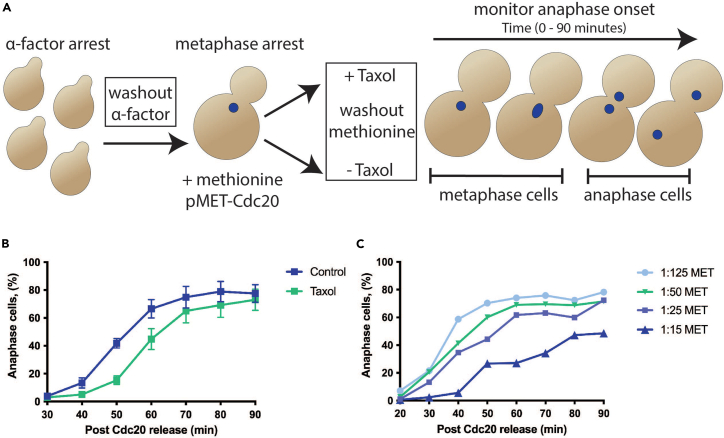
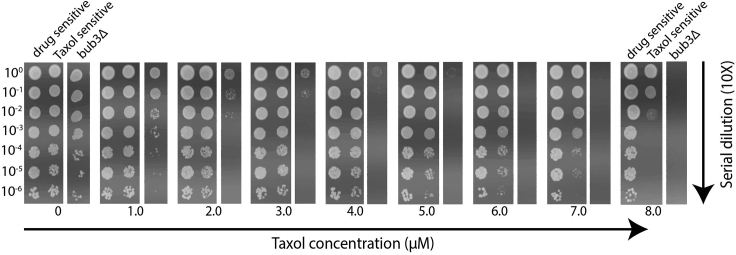
The microtubule (MT)-stabilizing drug Taxol (paclitaxel) is a commonly used tool to investigate MT dynamics and MT-dependent processes. Here, we present a protocol for using Taxol-sensitized budding yeast to investigate the effect of microtubule stabilization on anaphase onset. We describe steps for establishing a log phase culture, synchronizing cells in G1, arresting in metaphase, and releasing cells into Taxol. We then detail procedures for imaging and scoring anaphase onset. This protocol facilitates maintenance and reproducibility in testing drug-sensitized and Taxol-sensitized yeast strains. For complete details on the use and execution of this protocol, please refer to Proudfoot et al.1.

Keywords: Cell Biology; Cell-based Assays; Genetics; Model Organisms.


Conflict of interest statement

Declaration of interests The authors declare no competing interests.

Figures

None
Graphical abstract
Figure 3
Figure 3
Examples of DAPI-stained cells from both release assays (A and B) Representative images of DAPI-stained cells from (A) G1 (MGY2150) and (B) Cdc20 (MGY1293) release assays. Cells were imaged with 12 z-planes at 0.5 μm intervals using DIC and DAPI settings, and maximum z-projection images are shown for DAPI, and a single focal plane for DIC. Cells scored in the G1 release assay (A) are grouped into three categories based on cell and DNA morphology: G1/metaphase - small to large budded with 1 DAPI focus, anaphase - large budded with 2 DAPI foci, and anaphase re-bud / schmooing cells with 1 DAPI focus (seen in later time points). In the Cdc20 release assay (B), cells are grouped into three similar categories: single cells - unbudded with 1 DAPI focus, metaphase - small to large budded with 1 DAPI focus, and anaphase - large budded with 2 DAPI foci. If a large budded cell has a DAPI signal that is dumbbell shaped but still connected, it is counted as a metaphase cell in both the G1 and Cdc20 release assays. Scale bars = 2 μm.
Figure 1
Figure 1
G1 release assay (A) Schematic of G1 release assay (MGY2150). The G1 release assay monitors the timing of anaphase onset when tensionless and unattached kinetochores are induced by Taxol treatment during spindle assembly. Cells are first synchronized in G1 using alpha-factor before being split into two cultures. Upon release from alpha-factor arrest one is treated with Taxol in DMSO and the other with only DMSO as a control. Samples are withdrawn and fixed over the subsequent 240 min (0, 60, 90, 120, 150, 165, 180, 195, 210, 240 min) and used to monitor anaphase onset via DAPI staining of DNA (blue spots). Note that if alpha-factor is included at 90 min post release from G1 the anaphase re-bud cells will be schmooing. If alpha-factor is omitted they will be small-budded. (B) Results from the G1 release assay where symbols represent the mean ± SEM from 3 different experiments. Percent anaphase cells at each time point is calculated by (number of anaphase large budded cells + anaphase re-bud cells) / the total number of cells scored in the time point ∗ 100. For each timepoint 100–200 cells were scored per experiment.
Figure 2
Figure 2
Cdc20 release assay (A) Schematic of Cdc20 release assay (MGY1293). The Cdc20 release assay monitors the effect of attached kinetochores with reduced tension on the timing of anaphase onset by treating cells with Taxol only after spindle assembly is complete. This isolates the effect of low tension on attached kinetochores. Cells are first synchronized in G1 using alpha-factor, and then released and subsequently arrested in metaphase by Cdc20 depletion. This metaphase arrest allows for complete spindle formation and establishment of bipolar attachments with unperturbed microtubule dynamics before Taxol treatment. Cells are then released into media containing Taxol in DMSO, or only DMSO as a control, and samples are withdrawn and fixed over the next 90 min to monitor anaphase onset via DAPI staining of DNA (blue spots). (B) Results from the Cdc20 release assay where symbols represent the mean ± SEM from 3 different experiments. Percent anaphase cells at each time point is calculated by the total number of anaphase large budded cells / (anaphase large budded cells + metaphase cells) ∗ 100. For each timepoint 100–200 cells were scored per experiment. (C) If scaling up the volumes in this assay, the amount of methionine used in the metaphase arrest can affect the speed and synchronicity of metaphase release into anaphase. Keep the ratio of total methionine (i.e., concentration ∗ volume) to cell number similar to the original Cdc20 release volumes and adjust accordingly if needed.
Figure 4
Figure 4
Taxol sensitivity spotting assay Example of a Taxol sensitivity spotting assay with Taxol concentration increasing from left to right and culture density decreasing 10-fold with each descending spot. Plates were made fresh as described and allowed to dry under a hood before being spotted with 2.2 μL of each dilution from 2-day saturated cultures. These plates were spotted with drug sensitive cells (MGY1872, pdr1Δ pdr3Δ erg6Δ) containing wildtype tubulin, Taxol sensitive cells (MGY1874, tub2-A19K-T23V-G26D-Y270F pdr1Δ pdr3Δ erg6Δ) containing Taxol-sensitized tubulin, and Taxol sensitive cells lacking the spindle checkpoint protein, Bub3 (MGY2104, tub2-A19K-T23V-G26D-Y270F, pdr1Δ pdr3Δ erg6Δ bub3Δ).

References

    1. Proudfoot K.G., Anderson S.J., Dave S., Bunning A.R., Sinha Roy P., Bera A., Gupta M.L., Jr. Checkpoint proteins Bub1 and Bub3 delay anaphase onset in response to low tension independent of microtubule-kinetochore detachment. Cell Rep. 2019;27:416–428.e4. doi: 10.1016/j.celrep.2019.03.027. - DOI - PMC - PubMed
    1. Barnes G., Louie K.A., Botstein D. Yeast proteins associated with microtubules in vitro and in vivo. Mol. Biol. Cell. 1992;3:29–47. doi: 10.1091/mbc.3.1.29. - DOI - PMC - PubMed
    1. Bode C.J., Gupta M.L., Reiff E.A., Suprenant K.A., Georg G.I., Himes R.H. Epothilone and paclitaxel: unexpected differences in promoting the assembly and stabilization of yeast microtubules. Biochemistry. 2002;41:3870–3874. doi: 10.1021/bi0121611. - DOI - PubMed
    1. Winefield R.D., Entwistle R.A., Foland T.B., Lushington G.H., Himes R.H. Differences in paclitaxel and docetaxel interactions with tubulin detected by mutagenesis of yeast tubulin. ChemMedChem. 2008;3:1844–1847. doi: 10.1002/cmdc.200800288. - DOI - PMC - PubMed
    1. Foland T.B., Dentler W.L., Suprenant K.A., Gupta M.L., Jr., Himes R.H. Paclitaxel-induced microtubule stabilization causes mitotic block and apoptotic-like cell death in a paclitaxel-sensitive strain of Saccharomyces cerevisiae. Yeast. 2005;22:971–978. doi: 10.1002/yea.1284. - DOI - PMC - PubMed

Publication types

LinkOut - more resources