. 2023 Nov;13(9):563-573.
doi: 10.1089/brain.2023.0001. Epub 2023 Sep 29.

Characterization of Resting-State Functional Connectivity Changes in Hypertension by a Modified Difference Degree Test

Affiliations

Characterization of Resting-State Functional Connectivity Changes in Hypertension by a Modified Difference Degree Test

William D Reeves et al. Brain Connect. 2023 Nov.

Abstract

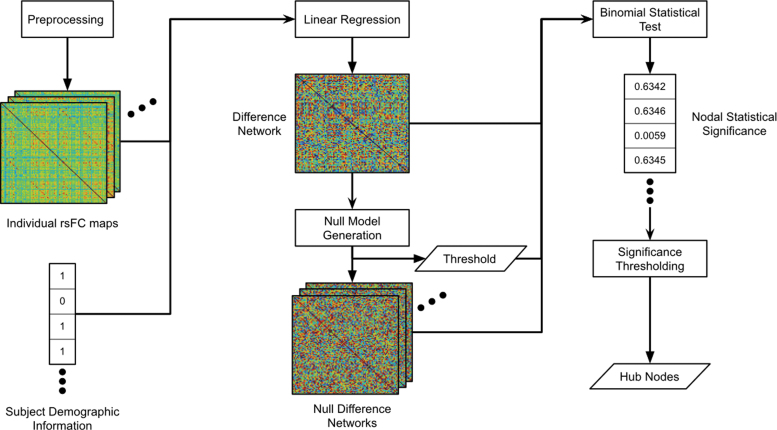
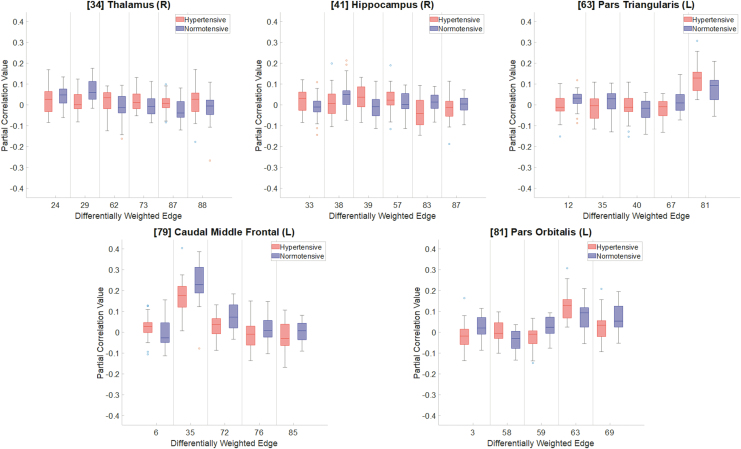
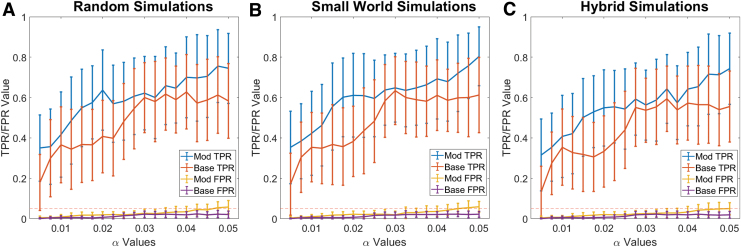
Introduction: Hypertension affects over a billion people worldwide, and the application of neuroimaging may elucidate changes brought about by the disease. We have applied a graph theory approach to examine the organizational differences in resting-state functional magnetic resonance imaging (rs-fMRI) data between hypertensive and normotensive participants. To detect these groupwise differences, we performed statistical testing using a modified difference degree test (DDT). Methods: Structural and rs-fMRI data were collected from a cohort of 52 total (29 hypertensive and 23 normotensive) participants. Functional connectivity maps were obtained by partial correlation analysis of participant rs-fMRI data. We modified the DDT null generation algorithm and validated the change through different simulation schemes and then applied this modified DDT to our experimental data. Results: Through a comparative analysis, the modified DDT showed higher true positivity rates (TPR) when compared with the base DDT while also maintaining false positivity rates below the nominal value of 5% in nearly all analytically thresholded trials. Applying the modified DDT to our rs-fMRI data showed differential organization in the hypertension group in the regions throughout the brain including the default mode network. These experimental findings agree with previous studies. Conclusions: While our findings agree with previous studies, the experimental results presented require more investigation to prove their link to hypertension. Meanwhile, our modification to the DDT results in higher accuracy and an increased ability to discern groupwise differences in rs-fMRI data. We expect this to be useful in studying groupwise organizational differences in future studies.

Keywords: functional connectivity; graph theory; hypertension; resting-state functional magnetic resonance imaging; resting-state networks.


Conflict of interest statement

No competing financial interests exist.

Figures

FIG. 1.
FIG. 1.
Flowchart of the DDT. The rsFC maps and participant demographic information are linearly regressed while regressing out the age, sex, and race as nuisance variables. The difference network (D) is used to generate an adaptive threshold value, as well as null networks with matching mean and variance with annihilated internal structure. The difference network, threshold, and null networks are used in the final statistical testing to obtain nodal statistical significance, which, when thresholded, produces statistically significant differentially expressed hub nodes. DDT, difference degree test; rsFC, resting-state functional connectivity.
FIG. 2.
FIG. 2.
The comparative analysis results between the modified (A–C) and base (D–F) DDT are shown for 1 (A, D), 3 (B, E), and 5 (C, F) simulated hub nodes. The nodal TPR and FPR are given along the y-axis, with the different number (4, 7, or 11) of DWEs per hub node being shown along the x-axis. Each different simulation type is shown in the assorted color combinations with the Rand simulation's TPR being shown in blue with FPR in purple, the SmW TPR in red, FPR in green, and the Hyb TPR in yellow with the FPR in light blue. The error bars shown in the plot represent the standard deviation of the simulation's TPR/FPR values and are drawn uneven as to illustrate that no T/FPR value ever exceeded 1 or fell below 0. DWEs, differentially weighted edges; FPR, false positivity rate; Hyb, hybrid; Rand, random; SmW, small-world; TPR, true positivity rate.
FIG. 3.
FIG. 3.
A tree graph representation of the hub nodes (red) and DWE connection with other non-hub nodes (blue) is shown. The numbers inside the circle represent the node number.
FIG. 4.
FIG. 4.
Illustration of the anatomical regions of seven statistically significant differentially expressed hub nodes. Region 34 is located at the right thalamus (light blue), region 41 at the right hippocampus (purple), region 69 at the left middle temporal (red), region 79 at the caudal middle frontal (yellow), and region 81 at the pars orbitalis (green).
FIG. 5.
FIG. 5.
Group-segregated box plots of partial correlation values are shown for the five differentially expressed hub nodes. The group's partial correlation value is listed on the y-axis, while the x-axis represents different DWEs that hub node is connected to (red: the hypertensive group; blue: the normotensive group).
FIG. 6.
FIG. 6.
Modified (Mod) and base DDT mean TPR and FPR are shown for the random (A), SmW (B), and hybrid (C) simulation schemes. With the Mod TPR shown as a blue line, the base TPR in red, Mod FPR in yellow, and base FPR in purple, the TPR and FPR values are shown as a function of α significance values. The bars shown on the lines represent a single standard deviation of the simulation over 100 trials.

References

    1. Ahmed I, Reeves WD, Sun W, et al. . Nutritional supplement induced modulations in the functional connectivity of a porcine brain. Nutr Neurosci 2023; In Press; doi: 10.1080/1028415X.2023.2166803 - DOI - PubMed
    1. Bassett DS, Bullmore E. Small-world brain networks. Neuroscientist 2006;12(6):512–523; doi: 10.1177/1073858406293182 - DOI - PubMed
    1. Calhoun VD, de Lacy N. Ten key observations on the analysis of resting-state functional MR imaging data using independent component analysis. Neuroimaging Clin N Am 2017;27(4):561–579; doi: 10.1016/j.nic.2017.06.012 - DOI - PMC - PubMed
    1. Carnevale L, Maffei A, Landolfi A, et al. . Brain functional magnetic resonance imaging highlights altered connections and functional networks in patients with hypertension. Hypertension 2020;76(5):1480–1490; doi: 10.1161/hypertensionaha.120.15296 - DOI - PubMed
    1. Chung J, Jackson BS, McDowell JE, et al. . Joint estimation and regularized aggregation of brain network in FMRI data. J Neurosci Methods 2021;364:109374; doi: 10.1016/j.jneumeth.2021.109374 - DOI - PubMed

Publication types

LinkOut - more resources