. 2023 Oct:66:102848.
doi: 10.1016/j.redox.2023.102848. Epub 2023 Aug 12.

Protective effects of luteolin against amyloid beta-induced oxidative stress and mitochondrial impairments through peroxisome proliferator-activated receptor γ-dependent mechanism in Alzheimer's disease

Affiliations

Protective effects of luteolin against amyloid beta-induced oxidative stress and mitochondrial impairments through peroxisome proliferator-activated receptor γ-dependent mechanism in Alzheimer's disease

Zhijun He et al. Redox Biol. 2023 Oct.

Abstract

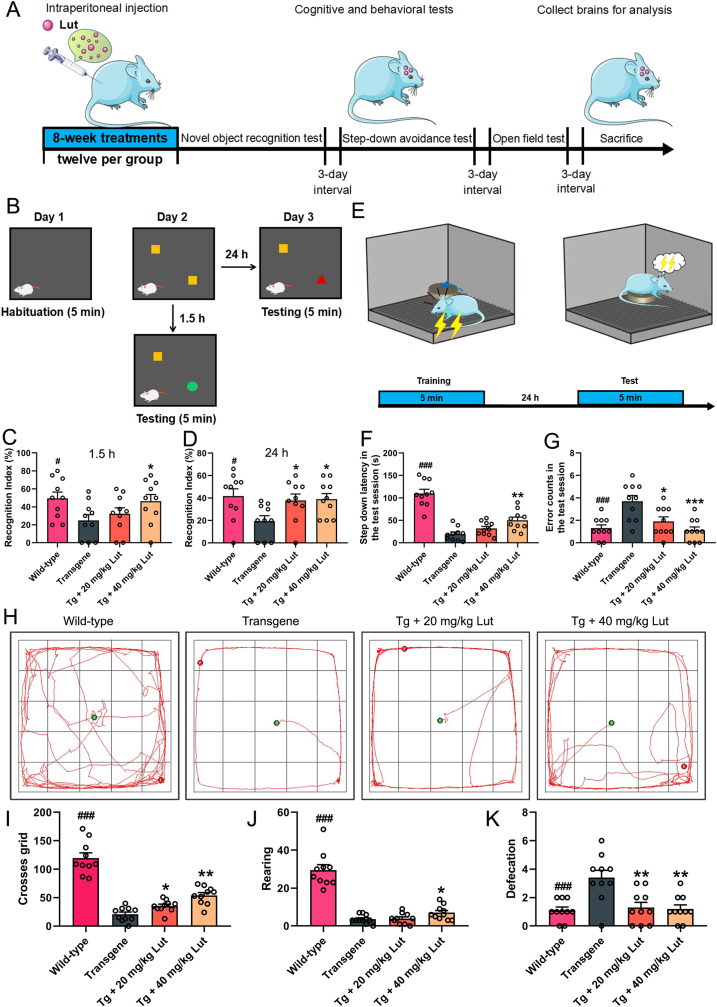
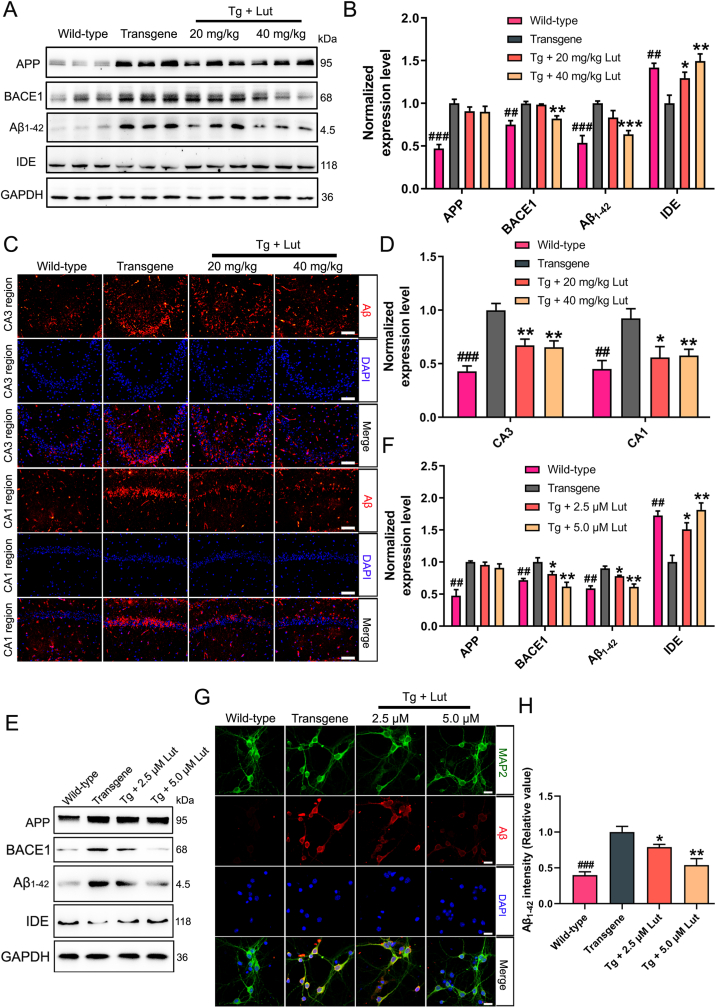
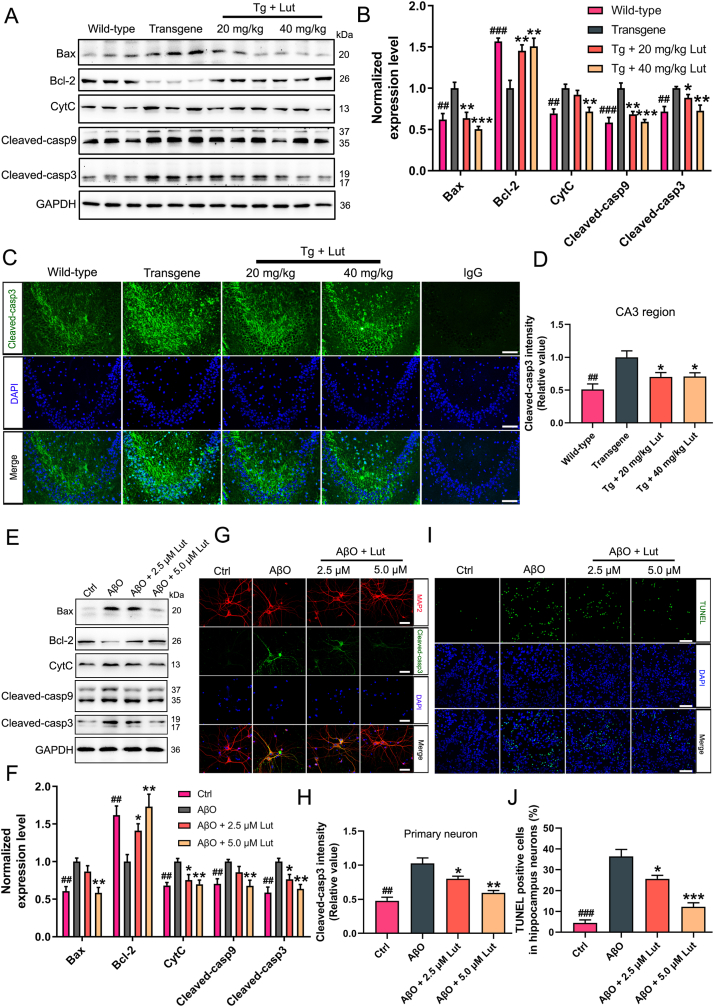
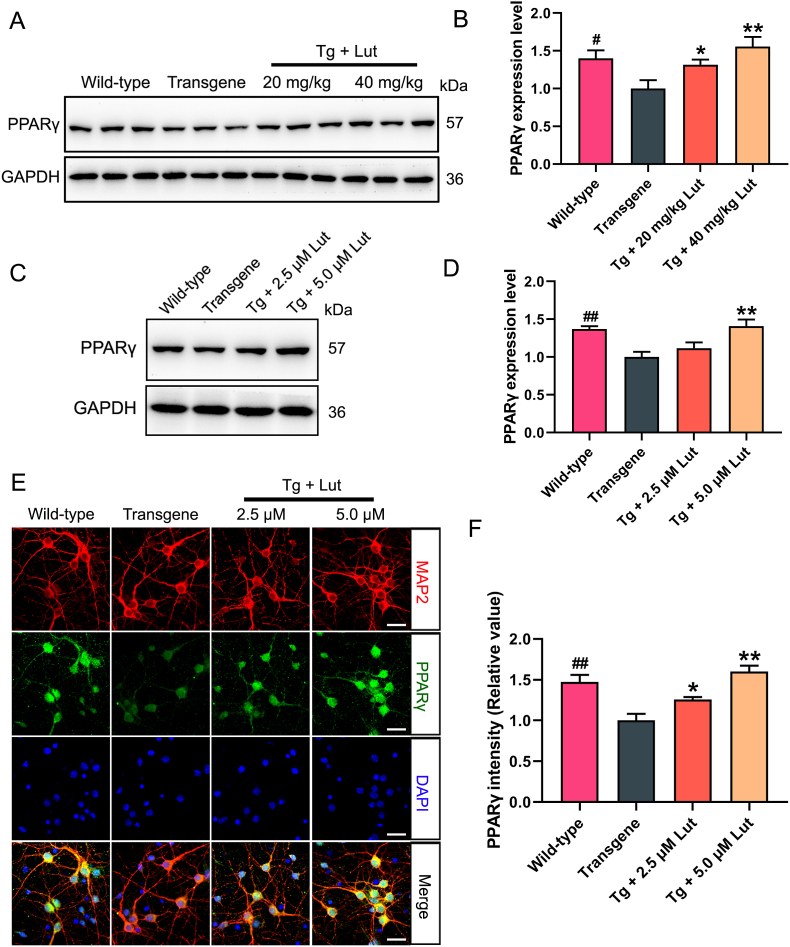
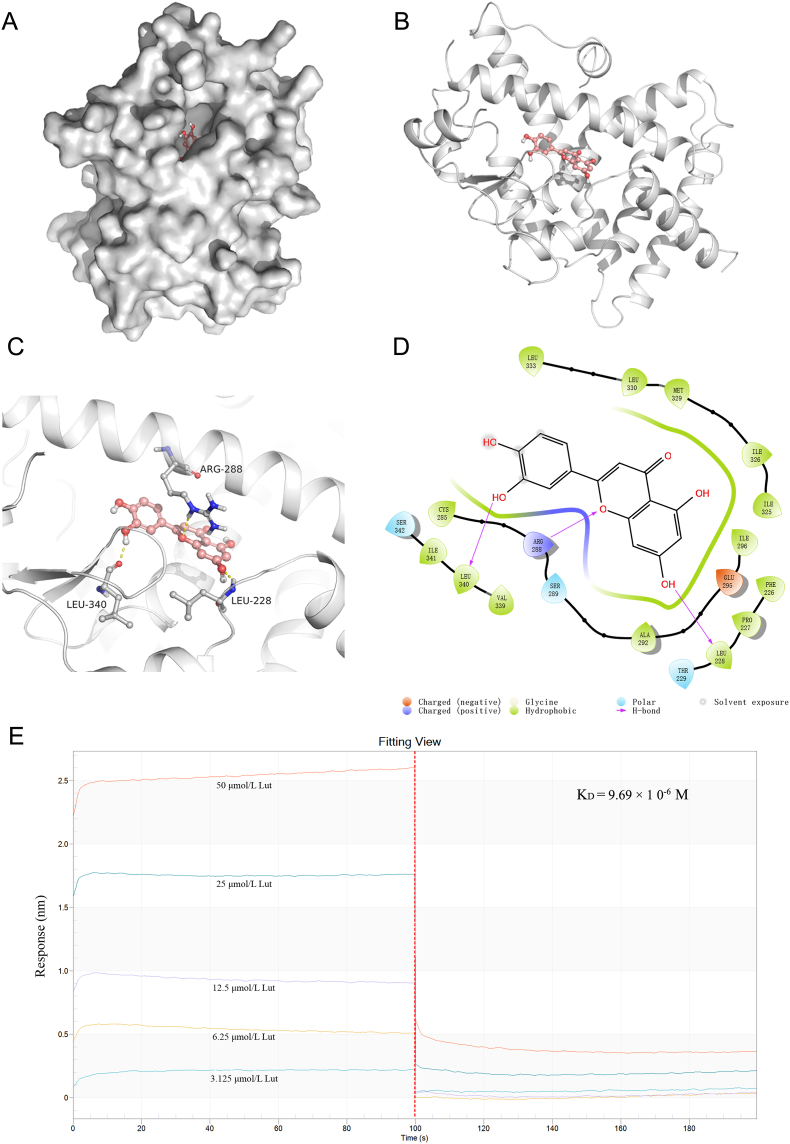
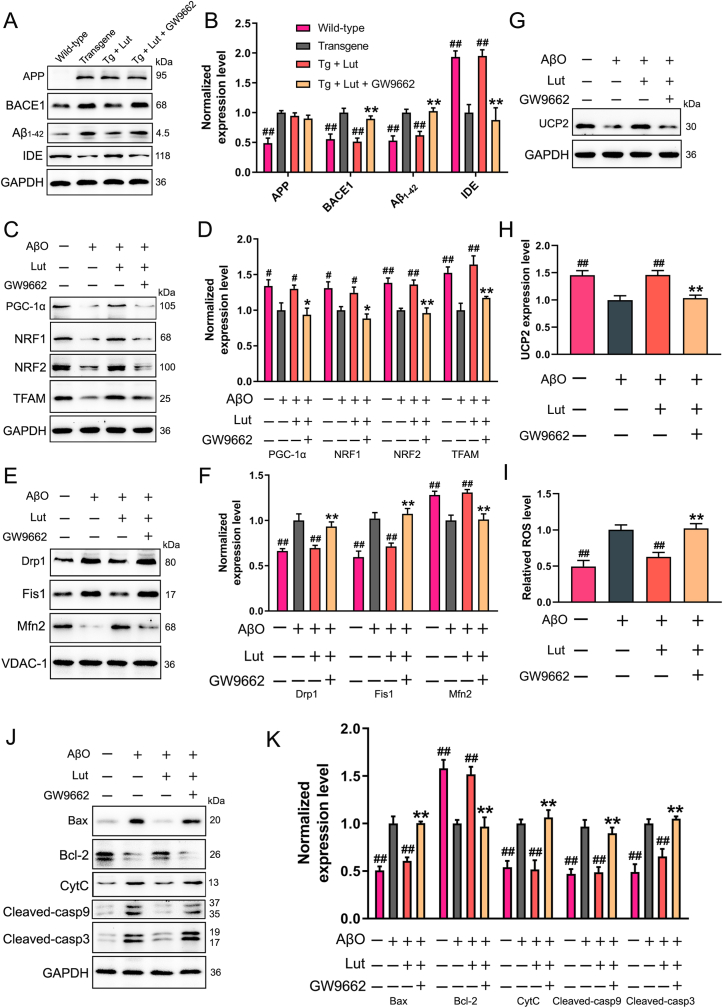
Alzheimer's disease (AD) is a devastating neurodegenerative disorder characterized by the deposition of β-amyloid (Aβ) peptides and dysfunction of mitochondrion, which result in neuronal apoptosis and ultimately cognitive impairment. Inhibiting Aβ generation and repairing mitochondrial damage are prominent strategies in AD therapeutic treatment. Luteolin, a flavonoid compound, exhibits anti-inflammatory neuroprotective properties in AD mice. However, it is still unclear whether luteolin has any effect on Aβ pathology and mitochondrial dysfunction. In this study, the beneficial effect and underlying mechanism of luteolin were investigated in triple transgenic AD (3 × Tg-AD) mice and primary neurons. Our study showed that luteolin supplement significantly ameliorated memory and cognitive impairment of AD mice and exerted neuroprotection by inhibiting Aβ generation, repairing mitochondrial damage and reducing neuronal apoptosis. Further research revealed that luteolin could directly bind with peroxisome proliferator-activated receptor gama (PPARγ) to promote its expression and function. In the culture of hippocampus-derived primary neurons, addition of PPARγ antagonist GW9662 or knockdown of PPARγ with its siRNA could eliminate the effect of luteolin on AD pathologies. In summary, this work revealed for the first time that luteolin effectively improved cognitive deficits of 3 × Tg-AD mice and inhibited Aβ-induced oxidative stress, mitochondrial dysfunction and neuronal apoptosis via PPARγ-dependent mechanism. Hence, luteolin has the potential to serve as a therapeutic agent against AD.

Keywords: Alzheimer's disease (AD); Apoptosis; Luteolin; Mitochondrial impairments; Peroxisome proliferator-activated receptor γ (PPARγ); β-amyloid (Aβ).


Conflict of interest statement

Declaration of competing interest The authors declare that they have no competing interests.

Figures

Image 1
Graphical abstract
Fig. 1
Fig. 1
Attenuation of cognitive impairments by luteolin in 3×Tg-AD mice. (A) Study design of animal experiments. 10-month-old 3 × Tg-AD mice (Transgene, Tg) were intraperitoneally administrated luteolin for 8 weeks and then the exploratory behavior and cognitive ability were evaluated by novel object recognition task, step-down avoidance test and open field test in turn. (B) Illustration of novel object recognition task. (C-D) Assessing the effects of luteolin on recognition index (%) in testing stage after 1.5 h and 24 h. (E) Schematic diagram of step-down avoidance test. (F-G) Step down latency and error counts during the test session. (H) The representative moving paths for the mice in the open field test during the 5 min test period. (I–K) The number of crossed grids, frequencies of rearing and amount of defecation in the open field test. #: WT group vs. Tg group; *: Tg + Lut group vs. Tg group. n=10 mice; #P < 0.05 and ###P < 0.001, *P < 0.05, **P < 0.01 and ***P < 0.01, respectively.
Fig. 2
Fig. 2
Decrease of Aβ generation and accumulation by luteolin in 3×Tg-AD mice and primarily cultured neurons. (A) Representative results of Western blot analysis displayed the degrees of APP, BACE1, Aβ1–42 and IDE in hippocampus of mice in WT, Tg and Tg + Lut group. (B) Quantification of these proteins were normalized to the degrees of GAPDH. (CD) Representative immunofluorescent images showed the levels of Aβ in CA3 and CA1 regions of the hippocampus (Scale bar: 100 μm). Quantitative analysis of fluorescence intensity of Aβ in these regions. (EF) Representative results of Western blot analysis showed the levels of APP, BACE1, Aβ1–42 and IDE in primary hippocampal neurons. Quantification results were normalized against the levels of GAPDH. (GH) Representative immunofluorescent images displayed the expression levels of Aβ in primary hippocampal neurons (Scale bar: 20 μm). The staining intensity of Aβ was quantified. #: WT group vs. Tg group; *: Tg + Lut group vs. Tg group. n=6 mice/wells per group; ##P < 0.01, ###P < 0.001, *P < 0.05, **P < 0.01 and ***P < 0.001, respectively.
Fig. 3
Fig. 3
Inhibition of oxidative stress by luteolin in 3×Tg-AD mice and primarily cultured neurons. (AB) Levels of MDA and GSH in the brain of WT, AD, and Lut-treated AD mice were determined with MDA and GSH assay kits, respectively. (C) Activity of SOD in the brain of mice were measured by SOD assay kit. (DE) Representative results of Western blot analysis showed the levels of UCP2 in the brain of mice. Quantification results were normalized against the levels of GAPDH. (FG) Representative immunofluorescent images showed the levels of UCP2 in CA3 region of the hippocampus (Scale bar: 100 μm). Quantitative analysis of fluorescence intensity of UCP2 in this region. As a negative control, rabbit control IgG was used instead of primary antibodies. (H) Representative levels of ROS in AβO-induced primary neurons were measured by DCFH-DA fluorescence probe. (IJ) Representative results of Western blot analysis showed the levels of UCP2 in Aβ-induced primary neurons. Quantification results were normalized against the levels of GAPDH. #: WT group vs. Tg group or Ctrl group vs. AβO group; *: Tg + Lut group vs. Tg group or AβO + Lut group vs. AβO group. n=6 mice or wells per group; ##P < 0.01, ###P < 0.001, *P < 0.05 and **P < 0.01, respectively.
Fig. 4
Fig. 4
Enhancement of mitochondrial biogenesis by luteolin in 3×Tg-AD mice and primarily cultured neurons. (AB) Representative results of Western blot analysis showed the levels of PGC-1α, NRF1, NRF2 and TFAM in the hippocanpus of mice. Quantification results were normalized against the levels of GAPDH. (CD) Representative immunofluorescent images showed the levels of NRF2 in CA1 region of the hippocampus (Scale bar: 100 μm). Quantitative analysis of fluorescence intensity of NRF2 in this region. As a negative control, rabbit control IgG was used instead of primary antibodies. (EF) Representative results of Western blot analysis showed the levels of PGC-1α, NRF1, NRF2 and TFAM in AβO-induced primary neurons. Quantification results were normalized against the levels of GAPDH. #: WT group vs. Tg group or Ctrl group vs. AβO group; *: Tg + Lut group vs. Tg group or AβO + Lut group vs. AβO group. n=6 mice or wells per group; #P < 0.05, ##P < 0.01, ###P < 0.001, *P < 0.05, **P < 0.01 and ***P < 0.001, respectively.
Fig. 5
Fig. 5
Improvement of mitochondrial dynamics and health by luteolin in 3×Tg-AD mice and primarily cultured neurons. (AD) Representative results of Western blot analysis showed the levels of Drp1, Fis1 and Mfn2 in the hippocampus of mice and AβO-induced primary neurons, respectively. Quantification results were normalized against the levels of VDAC-1. (EF) Transmission electron microscopic images of mitochondria (red arrows) in the hippocampus of the brain of mice. N, nucleus. The numbers of mitochondria were quantified in equal areas (Scale bar: 10 μm). (GH) Representative images of neurons stained with JC-1 showed the levels of MMP (Scale bar: 50 μm). Red/green fluorescence intensity were quantified. #: WT group vs. Tg group or Ctrl group vs. AβO group; *: Tg + Lut group vs. Tg group or AβO + Lut group vs. AβO group. n=6 mice/wells per group; ##P < 0.01, ###P < 0.001, *P < 0.05, **P < 0.01 and ***P < 0.001, respectively. (For interpretation of color in this figure, the reader is referred to the Web version of this article.)
Fig. 6
Fig. 6
Inhibition of neuronal apoptosis by luteolin in 3×Tg-AD mice and primarily cultured neurons. (A, E) Representative results of Western blot analysis showed the levels of Bax, bcl-2, CytC, cleaved-caspase 9 and cleaved-caspase 3 in the hippocampus of mice and AβO-induced primary neurons, respectively. (B, F) Quantification results were normalized against the levels of GAPDH. (C, G) Representative immunofluorescent images showed the levels of cleaved-caspase 3 in CA3 region of the hippocampus (Scale bar: 100 μm) and AβO-induced primary neurons (Scale bar: 20 μm). As a negative control, rabbit control IgG was used instead of primary antibodies. (D, H) Quantitative analysis of fluorescence intensity of cleaved-caspase 3. (I, J) Representative TUNEL staining images of apoptotic neurons displayed the effect of luteolin on AβO-induced primary neurons (Scale bar: 100 μm). The fluorescence intensity of TUNEL staining were quantified. #: WT group vs. Tg group or Ctrl group vs. AβO group; *: Tg + Lut group vs. Tg group or AβO + Lut group vs. AβO group. n=6 mice or wells per group; ##P < 0.01, ###P < 0.001, *P < 0.05, **P < 0.01 and ***P < 0.001, respectively.
Fig. 7
Fig. 7
Increase of PPARγ expression by luteolin in hippocampus of AD mice and primary hippocampal neurons. (A, C) Representative results of Western blot analysis showed the levels of PPARγ in the hippocampus of mice and primary neurons, respectively. (B, D) Quantification results were normalized against the levels of GAPDH. (E, F) Representative immunofluorescent images showed the levels of PPARγ in primary neurons (Scale bar: 20 μm). Quantitative analysis of fluorescence intensity of PPARγ. #: WT group vs. Tg group; *: Tg + Lut group vs. Tg group. n=6 miceor wells per group; #P < 0.05, ##P < 0.01, *P < 0.05 and **P < 0.01, respectively.
Fig. 8
Fig. 8
Direct interaction between PPARγ and luteolin. (AB) The docking mode of luteolin with PPARγ protein. (C) Luteolin interacts with the ligand-binding domain of PPARγ and forms three hydrogen bonds at the residues Leu340, Leu228 and Arg288, displayed by dashed yellow line. (D) The 2D graph showing interactions of luteolin with the residues of PPARγ. The binding features were displayed in different colors, in which the negative charged, positive charged, polar and hydrophobic residues are portrayed as red, deep blue, light blue and green, respectively. (E) The binding affinity of luteolin to PPARγ. Left part displays the dissociation curve of luteolin and PPARγ; right part stands for the relationship curve, the concentrations of luteolin adopted for the test were 3.125, 6.25, 12.5, 25, and 50 μM. (For interpretation of the color in this figure, the reader is referred to the Web version of this article.)
Fig. 9
Fig. 9
Effects of luteolin on AβO-induced oxidative stress, mitochondrial dysfunction and neuronal apoptosis by activating PPARγ. (AB) Primary hippocampal neurons were isolated respectively from WT or Tg mice. Neurons from Tg mice were also cultured with 5 μM luteolin and GW9662 for 24 h. Representative results of Western blot analysis showed the levels of APP, BACE1, Aβ1–42 and IDE. Quantification results were normalized against the levels of GAPDH. #: WT group or Tg + Lut group vs. Tg group; *: Tg + Lut + GW9662 group vs. Tg + Lut group. n=6 wells per group; ##P < 0.01 and **P < 0.01, respectively. (C, E, G) Primary hippocampal neurons isolated from WT mice were co-treated with Aβ oligomer (AβO), luteolin and GW9662 for 24 h. Representative results of Western blot analysis showed the levels of PGC-1α, NRF1, NRF2, TFAM, Drp1, Fis1, Mfn2 and UCP2 in AβO-induced primary neurons. (D, F, H) Quantification results were normalized against the levels of GAPDH or VDAC1. (I) Representative levels of ROS in AβO-induced primary neurons were measured by DCFH-DA fluorescence probe. (JK) Representative results of Western blot analysis showed the levels of Bax, bcl-2, CytC, cleaved-caspase 9 and cleaved-caspase 3. Quantification results were normalized against the levels of GAPDH. #: untreated or AβO + Lut group vs. AβO group; *: AβO + Lut + GW9662 group vs. AβO + Lut group. n=6 wells per group; #P < 0.05, ##P < 0.01, *P < 0.05 and **P < 0.01, respectively.
Fig. 10
Fig. 10
Effects of luteolin on AβO-induced oxidative stress, mitochondrial dysfunction and neuronal apoptosis in PPARγ knockdown neuron. (AB) Primary hippocampal neurons were isolated respectively from WT or Tg mice. Neurons from Tg mice were cultured with Lut or Lut + scrambled siRNA or Lut + PPARγ siRNA. Representative results of Western blot analysis showed the levels of APP, BACE1, Aβ1–42 and IDE. Quantification results were normalized against the levels of GAPDH. #: WT group or Tg + Lut group or Tg + Lut + scrambled siRNA group vs. Tg group; *: Tg + Lut group vs. Tg + Lut + PPARγ siRNA group. n=6 wells per group; ##P < 0.01 and **P < 0.01, respectively. (C, E, G) Primary hippocampal neurons isolated from WT mice were co-treated with Aβ oligomer (AβO) and Lut or Lut + scrambled siRNA or Lut + PPARγ siRNA. Representative results of Western blot analysis showed the levels of PGC-1α, NRF1, NRF2, TFAM, Drp1, Fis1, Mfn2 and UCP2 in AβO-induced primary neurons. (D, F, H) Quantification results were normalized against the levels of GAPDH or VDAC1. (I) Representative levels of ROS in AβO-induced primary neurons were measured by DCFH-DA fluorescence probe. (JK) Representative results of Western blot analysis showed the levels of Bax, bcl-2, CytC, cleaved-caspase 9 and cleaved-caspase 3. Quantification results were normalized against the levels of GAPDH. #: untreated or AβO + Lut group or AβO + Lut + scrambled siRNA group vs. AβO group; *: AβO + Lut group vs. AβO + Lut + PPARγ siRNA group. n=6 wells per group; #P < 0.05, ##P < 0.01, ###P < 0.001, *P < 0.05 and **P < 0.01, respectively.
Fig. 11
Fig. 11
Proposed mechanism for the protective effect of luteolin on Aβ-induced neuronal apoptosis in AD. Luteolin improved cognitive impairments via inhibiting Aβ production, promoting Aβ degradation, and suppressing mitochondrial dysfunction-induced neuronal apoptosis through a PPARγ-dependent pathway.

References

    1. 2021 Alzheimer's disease facts and figures. Alzheimers Dement. 2021;17:327–406. - PubMed
    1. Jett S., Malviya N., Schelbaum E., Jang G., Jahan E., Clancy K., et al. Endogenous and exogenous estrogen exposures: how women's reproductive health can drive brain aging and inform Alzheimer's prevention. Front. Aging Neurosci. 2022;14 - PMC - PubMed
    1. Klimova B., Maresova P., Kuca K. Non-pharmacological approaches to the prevention and treatment of Alzheimer's disease with respect to the rising treatment costs. Curr. Alzheimer Res. 2016;13:1249–1258. - PubMed
    1. Tanzi R.E., Moir R.D., Wagner S.L. Clearance of Alzheimer's Abeta peptide: the many roads to perdition. Neuron. 2004;43:605–608. - PubMed
    1. Yuan D.J., Yang G., Wu W., Li Q.F., Xu D.E., Ntim M., et al. Reducing Nav1.6 expression attenuates the pathogenesis of Alzheimer's disease by suppressing BACE1 transcription. Aging Cell. 2022;21 - PMC - PubMed

Publication types