. 2023 Nov 1:239:115597.
doi: 10.1016/j.bios.2023.115597. Epub 2023 Aug 12.

RaMALDI: Enabling simultaneous Raman and MALDI imaging of the same tissue section

Affiliations

RaMALDI: Enabling simultaneous Raman and MALDI imaging of the same tissue section

Ethan Yang et al. Biosens Bioelectron. .

Abstract

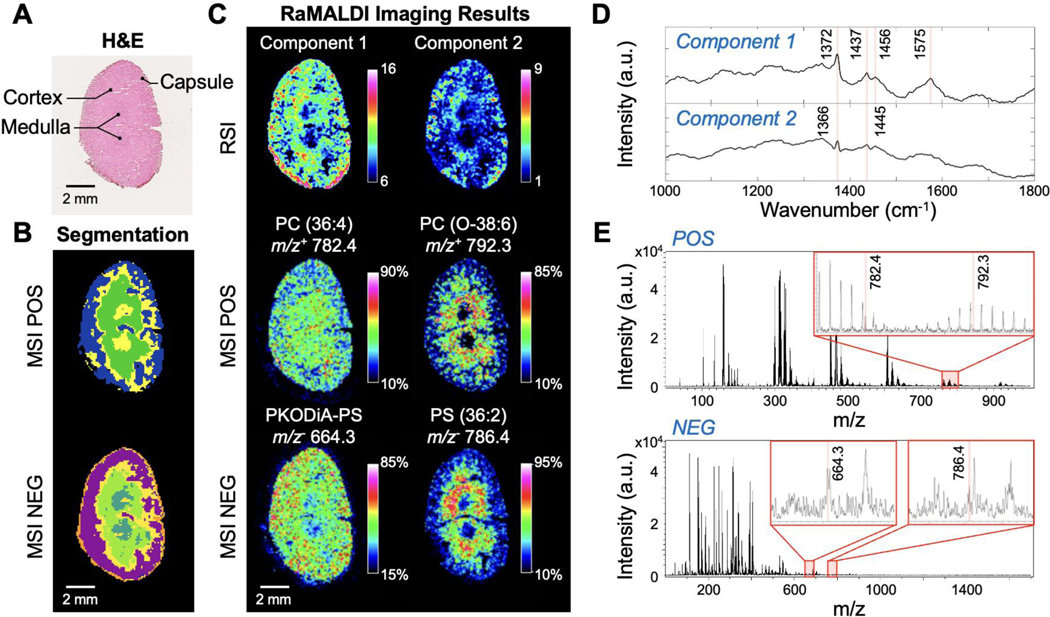
Multimodal tissue imaging techniques that integrate two complementary modalities are powerful discovery tools for unraveling biological processes and identifying biomarkers of disease. Combining Raman spectroscopic imaging (RSI) and matrix-assisted laser-desorption/ionization (MALDI) mass spectrometry imaging (MSI) to obtain fused images with the advantages of both modalities has the potential of providing spatially resolved, sensitive, specific biomolecular information, but has so far involved two separate sample preparations, or even consecutive tissue sections for RSI and MALDI MSI, resulting in images with inherent disparities. We have developed RaMALDI, a streamlined, integrated, multimodal imaging workflow of RSI and MALDI MSI, performed on a single tissue section with one sample preparation protocol. We show that RaMALDI imaging of various tissues effectively integrates molecular information acquired from both RSI and MALDI MSI of the same sample, which will drive discoveries in cell biology, biomedicine, and pathology, and advance tissue diagnostics.

Keywords: MALDI; Mass spectrometry imaging; Matrix; Multimodal imaging; Raman spectroscopy.


Conflict of interest statement

Declaration of competing interest The authors declare that they have no known competing financial interests or personal relationships that could have appeared to influence the work reported in this paper.

Figures

Figure 1.
Figure 1.. Experimental workflow for RaMALDI imaging.
A fresh-frozen tissue section is cryo-sectioned and thaw-mounted onto a conductive ITO microscopy slide. This is followed by MALDI matrix application by spraying DAN onto the tissue section. DAN was identified by an extensive optimization process to have the least influence on the spectral quality of RSI and MALDI MSI measurements. The prepared tissue section is first utilized for RSI and then the same sample is subjected to MALDI MSI measurement. This workflow enables the seamless production of two separate images of a single tissue section without compromising the spectral or spatial quality of the hyperspectral datasets.
Figure 2.
Figure 2.. RaMALDI imaging of Sharpie® markers.
Pink, Brown, and Red (from top to bottom) markings on an ITO slide underneath 1.6 μg/mm2 DAN matrix were measured using RaMALDI imaging. Both RSI and MSI of RaMALDI imaging were individually processed and images reconstructed at unique Raman and m/z peaks, respectively, for each Sharpie® marker color. Identified Raman and m/z peaks: 1650 cm−1 and m/z+ 443.4 for pink, 1406 cm−1 and m/z 649.1 for brown, and 621 cm−1 and m/z+ 415.3 for red, were selected as the most prominent peaks compounds, and naphthol and Rhodamine 6G for pink, brown, and red pigments, respectively. MSI peaks at m/z+ 443.4 and m/z+ 415.3 result from Rhodamine 6G and its derivatives. The MSI peak at m/z 649.1 arises from red dyes, such as direct red 28, frequently used in brown-colored markers. Scale bar = 1 mm.
Figure 3.
Figure 3.. RaMALDI imaging of mouse kidney tissue section.
RaMALDI imaging results are shown for RSI, followed by MSI of a representative coronal mouse kidney tissue section on an ITO slide sprayed with DAN matrix and imaged at 100 μm spatial resolution. (A) H&E-stained image of the same kidney tissue section was acquired following RaMALDI imaging. Anatomical structures of renal cortex, renal medulla, and capsule are labeled in the image. (B) K-means bisecting segmentation results of RaMALDI MSI data from positive (POS) and negative (NEG) MSI of the same section. (C) RSI data (top row) and MSI data (middle and bottom rows) of RaMALDI imaging. Two chemical component images (Component 1, Component 2) from the MCR-ALS model are displayed for RSI data. MALDI MS images are shown for two m/z’s for positive ion mode identified as specific phosphatidylcholines (PC) and two m/z’s for negative ion mode identified as specific phosphatidylserines (PS). Scale bar = 2 mm. (D) MCR-ALS resolved RaMALDI-RSI spectra of component 1 (nucleic acid-rich) and component 2 (lipid-rich), corresponding to (C) RaMALDI-RSI. Pure chemical spectra were decomposed from preprocessed RaMALDI-RSI spectra in the biological fingerprint region (1000–1800 cm−1) based on MCR-ALS model corresponding to (C). (E) RaMALDI-MSI spectra of positive ion (top) and negative ion (bottom) modes corresponding to (C). M/z signals shown as images in (C) are highlighted in red in the expanded spectral regions.
Figure 4.
Figure 4.. RaMALDI imaging of brain tissue section at 50 μm lateral spatial resolution.
RaMALDI imaging results are shown for RSI, followed by MSI of a horizontal brain tissue section on an ITO slide sprayed with DAN matrix and imaged at 50 μm spatial resolution in the region of the cerebellum. (A) H&E image of brain tissue section showing gray matter (GM) and white matter (WM) as labeled in the image. (B) K-means bisecting segmentation results of RaMALDI MSI data from positive (POS) and negative (NEG) MSI of the same section. (C) RSI data (top row) and MSI data (middle and bottom row) of RaMALDI imaging. Two chemical component images (Component 1, Component 2) from the MCR-ALS model are displayed for RSI data. MALDI MS images are shown for two m/z’s for positive ion mode identified as specific phosphatidylcholines (PC) and two m/z’s for negative ion mode identified as a specific phosphatidylinositol (PI) and a specific sulfatide. Scale bar = 2 mm. (D) MCR-ALS resolved RaMALDI-RSI spectra of component 1 (gray matter) and component 2 (white matter). Pure chemical spectra were decomposed from preprocessed RaMALDI-RSI spectra in the biological fingerprint region (1000–1800 cm−1) based on the MCR-ALS model corresponding to (C). (E) RaMALDI-MSI spectra of positive ion (top) and negative ion (bottom) modes corresponding to (C). M/z signals displayed as images in (C) are highlighted in red in the expanded spectral regions.
Figure 5.
Figure 5.. RaMALDI imaging of brain tissue section at 5 μm lateral spatial resolution.
RaMALDI imaging results are shown for RSI, followed by MSI of a horizontal brain tissue section on an ITO slide sprayed with DAN matrix and imaged at 5 μm spatial resolution in the region of the cerebellum. (A) H&E images of brain tissue section showing the three layers of molecular, Purkinje, and granular layer in gray matter and white matter as labeled in the image. Scale bar = 500 μm (left) and 200 μm (right). (B) RSI data (left) and MSI data (right) of RaMALDI imaging. Four chemical component images (Component 1, Component 2, Component 3, Component 4) from the MCR-ALS model are displayed for RSI data. MALDI MS images are shown for four m/z’s for positive ion mode identified as three specific phosphatidylcholines (PC) and a specific lysophosphatidic acid (LPA). Scale bar = 200 μm. (C) MCR-ALS resolved RaMALDI-RSI spectra of component 1 (gray matter), component 2 (white matter, cholesterol- and lipid-rich), component 3 (gray matter), and component 4 (white matter, lipid-rich). Pure chemical spectra were decomposed from preprocessed RaMALDI-RSI spectra in the biological fingerprint region (1000–1800 cm−1) based on the MCR-ALS model corresponding to (B). (D) RaMALDI-MSI spectra of positive ion (top) and negative ion (bottom) modes corresponding to (B). M/z signals shown as images in (B) are highlighted in red in the expanded spectral regions.

Similar articles

Cited by

References

    1. Ahlf DR, Masyuko RN, Hummon AB, Bohn PW, 2014. Correlated mass spectrometry imaging and confocal Raman microscopy for studies of three-dimensional cell culture sections. Analyst 139(18), 4578–4585. - PubMed
    1. Alessandri I, Vassalini I, Bertuzzi M, Bontempi N, Memo M, Gianoncelli A, 2016. “RaMassays”: Synergistic Enhancement of Plasmon-Free Raman Scattering and Mass Spectrometry for Multimodal Analysis of Small Molecules. Sci. Rep. 6(1), 34521. - PMC - PubMed
    1. Ali A, Abouleila Y, Germond A, 2020. An integrated Raman spectroscopy and mass spectrometry platform to study single-cell drug uptake, metabolism, and effects. JoVE (155), e60449. - PubMed
    1. Barry JA, Groseclose MR, Castellino S, 2019. Quantification and assessment of detection capability in imaging mass spectrometry using a revised mimetic tissue model. Bioanalysis 11(11), 1099–1116. - PubMed
    1. Bhargava A, Monteagudo B, Kushwaha P, Senarathna J, Ren Y, Riddle RC, Aggarwal M, Pathak AP, 2022. VascuViz: a multimodality and multiscale imaging and visualization pipeline for vascular systems biology. Nat. Methods 19(2), 242–254. - PMC - PubMed

MeSH terms

LinkOut - more resources