. 2023 Aug 31;186(18):3882-3902.e24.
doi: 10.1016/j.cell.2023.07.019. Epub 2023 Aug 18.

Epigenetic memory of coronavirus infection in innate immune cells and their progenitors

Affiliations

Epigenetic memory of coronavirus infection in innate immune cells and their progenitors

Jin-Gyu Cheong et al. Cell. .

Abstract

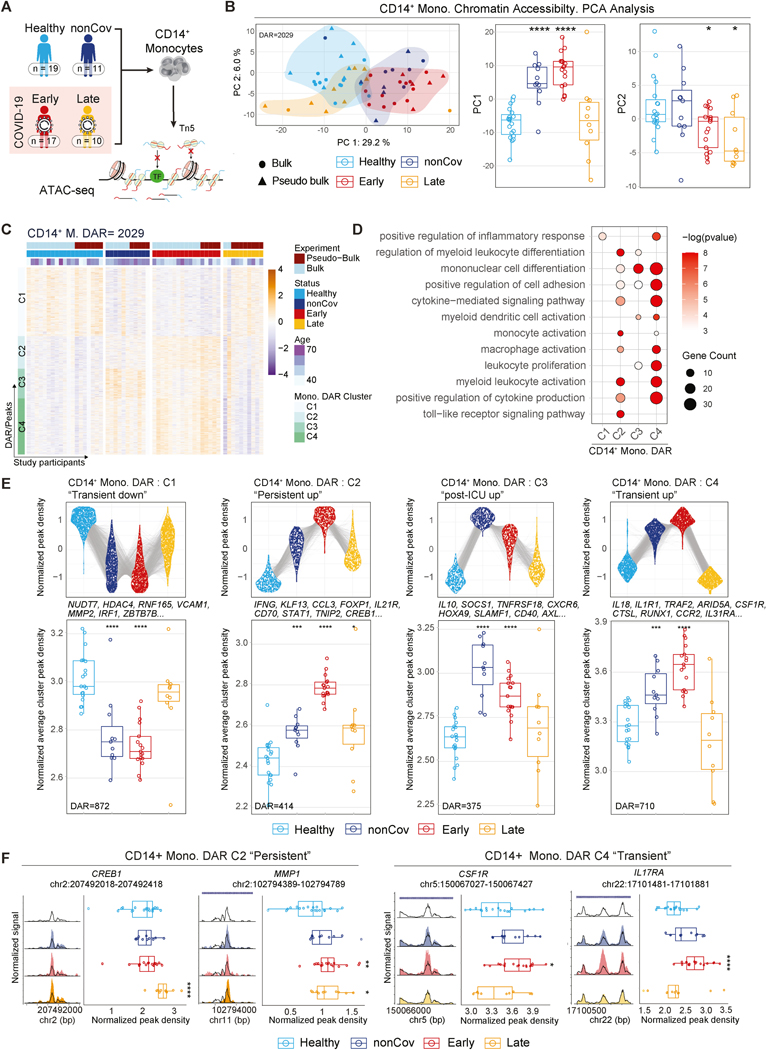
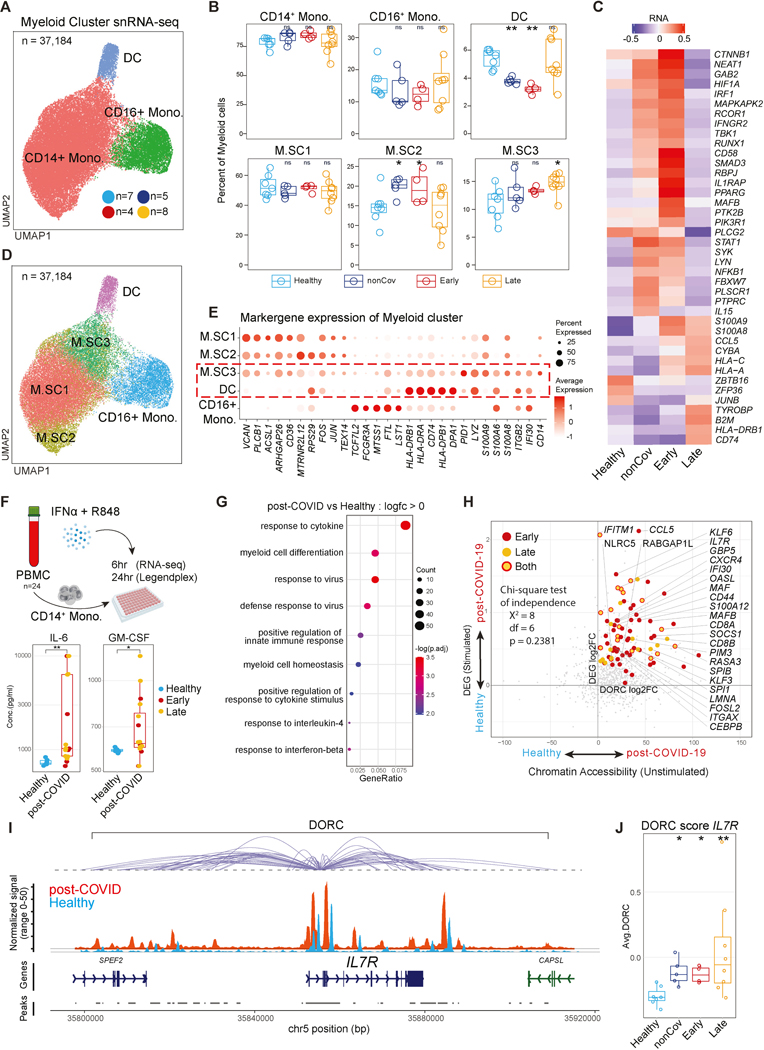
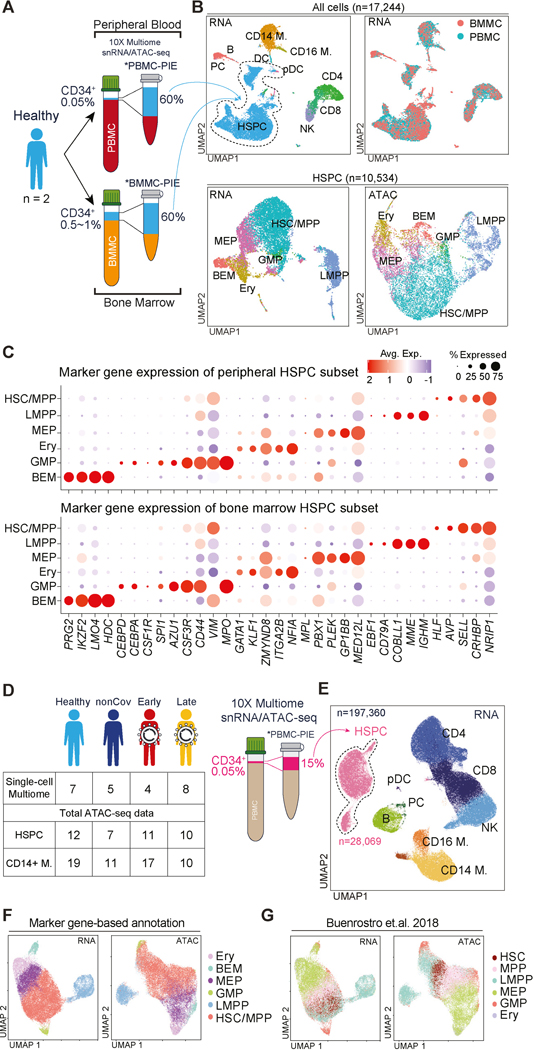
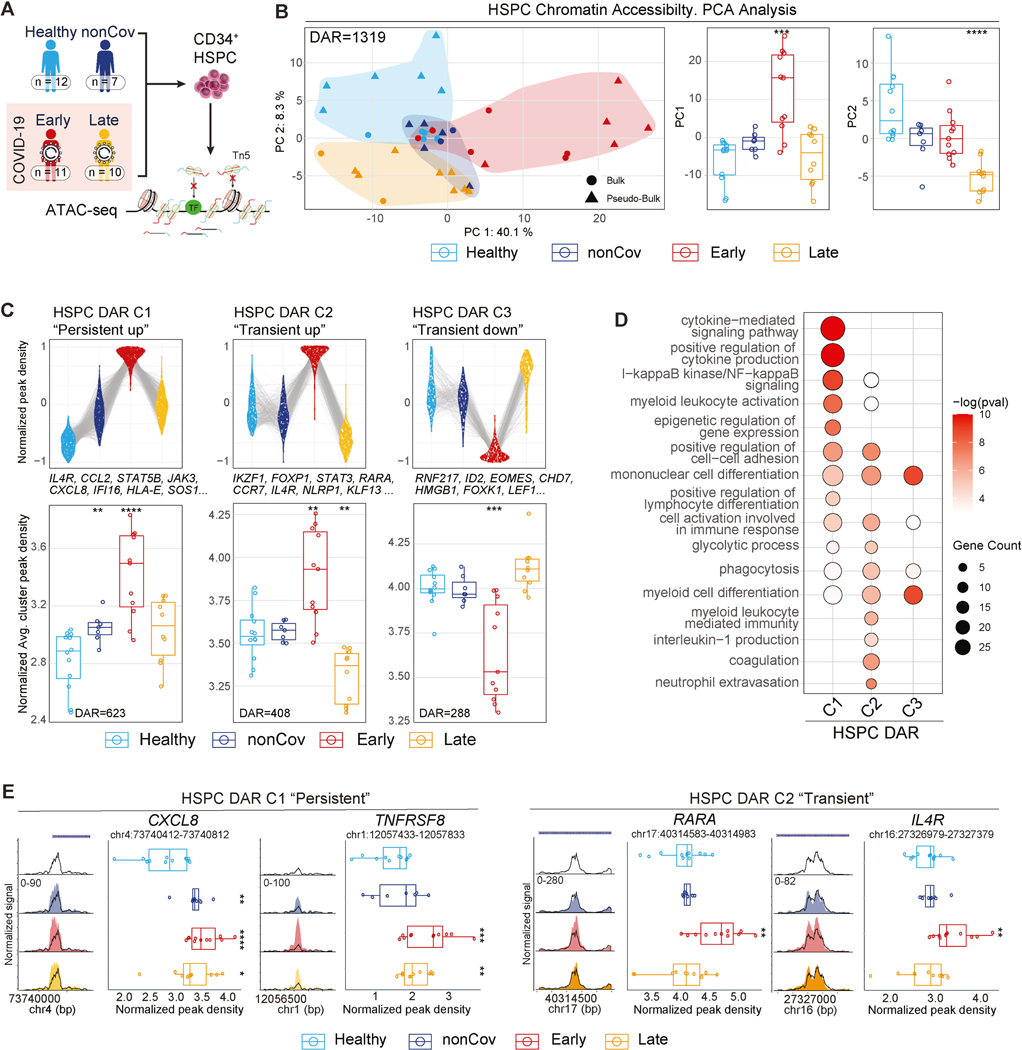
Inflammation can trigger lasting phenotypes in immune and non-immune cells. Whether and how human infections and associated inflammation can form innate immune memory in hematopoietic stem and progenitor cells (HSPC) has remained unclear. We found that circulating HSPC, enriched from peripheral blood, captured the diversity of bone marrow HSPC, enabling investigation of their epigenomic reprogramming following coronavirus disease 2019 (COVID-19). Alterations in innate immune phenotypes and epigenetic programs of HSPC persisted for months to 1 year following severe COVID-19 and were associated with distinct transcription factor (TF) activities, altered regulation of inflammatory programs, and durable increases in myelopoiesis. HSPC epigenomic alterations were conveyed, through differentiation, to progeny innate immune cells. Early activity of IL-6 contributed to these persistent phenotypes in human COVID-19 and a mouse coronavirus infection model. Epigenetic reprogramming of HSPC may underlie altered immune function following infection and be broadly relevant, especially for millions of COVID-19 survivors.

Keywords: COVID-19; IL-6; PASC; epigenetic memory; epigenome; hematopoietic stem and progenitor cells; monocytes; peripheral blood mononuclear cell progenitor input enrichment; post-acute sequelae SARS-CoV-2 infection; single-cell; trained immunity; transcriptome.


Conflict of interest statement

Declaration of interests J.D.B. holds patents related to ATAC-seq and scATAC-seq and serves on the Scientific Advisory Board of CAMP4 Therapeutics, seqWell, and CelSee. S.Z.J. and F.J.B. declare a related patent application: 10203-02-PC; EFS ID: 44924864 Enrichment and Characterization of Rare Circulating Cells, including Progenitor Cells from Peripheral Blood and Uses Thereof. F.J.B. is a co-founder and scientific advisor of IpiNovyx Bio. E.J.S. reports personal fees from NIAID through Axle Informatics for the subject matter expert program for the COVID-19 vaccine clinical trials. R.E.S. is on the scientific advisory board of Miromatrix Inc. and Lime Therapeutics and is a paid consultant and speaker for Alnylam Inc.

Figures

Figure 1.
Figure 1.. Durable epigenetic alterations in monocytes following severe COVID-19.
(A) Overview of the cohort and ATAC-seq workflow for epigenetic profiling of CD14+ monocytes. (B) PCA representation of CD14+ monocyte ATAC-seq dataset based on a combined set of DAR (n=2029) (left). Boxplots (right) show PC1 and PC2 values for the individuals in each clinical group. (C) Unsupervised hierarchical clustering of DAR in CD14+ monocytes by clinical group. Normalized peak accessibility for individuals and DAR clustered by chromatin accessibility trends across clinical groups. (FDR < 0.1 for DAR) (D) GO analysis of genes associated to cluster-specific DAR in CD14+ monocytes. (p<0.05) (E) Top: Normalized read density for cluster-specific DAR. Each DAR (group average) is represented by a linked line across groups. Bottom: Cluster average of normalized DAR density score per individual across clinical groups. (F) Representative ATAC-seq genome tracks of DAR from C2 and C4 in CD14+ monocytes. Boxplots display normalized DAR densities for each study participant.
Figure 2.
Figure 2.. Altered CD14+ monocyte programs and function following severe COVID-19.
(A) snRNA-seq UMAP visualization of myeloid clusters. (B) Frequency of myeloid subcluster within individual’s total myeloid population by clinical group. (C) Average normalized expression of top group-defining genes ranked by adjusted p-value in CD14+ monocytes. (D) Myeloid cluster UMAP showing CD14+ monocyte subclusters. (E) Expression of myeloid subcluster-defining genes. Red-dashed box highlights similarities between M.SC3 and DC. (F) Scheme for ex-vivo stimulation of CD14+ monocytes with R848 and IFNα (top). Boxplots show concentration of secreted cytokines 24hr post-stimulation. (G) GO analysis of upregulated genes in post-COVID CD14+ monocytes at 6hr post-stimulation compared to Healthy. (H) Correlation of foldchanges in DORC activity (unstimulated) and in gene expression (stimulated with R848+IFNα for 6 hours) between healthy and post-COVID groups (unstimulated, Early or Late or both). Labeled genes are DORC-associated genes with significant upregulation in both DORC and RNA expression (adj.p < 0.05 for both differential DORC and gene expression). Homogeneity between quadrant distribution of statistically significant and non-significant genes shown by chi-square test of independence. (I) Genome tracks displaying DORC region for IL7R in CD14+ monocytes by group. DORC-associated peaks are connected to the IL7R gene body with loops. (J) Average DORC score of each study participant across cohorts.
Figure 3.
Figure 3.. Epigenomic and transcriptomic analysis of rare circulating HSPC establishes their similarity to BM HSPC.
(A) Schema depicting donor-paired PBMC/BMMC analysis with Progenitor Input Enrichment (PBMC- and BMMC-PIE), followed by snRNA/ATAC-seq. Approximate percentage of HSPCs from pre-enrichment and enriched samples indicated. (B) UMAP for snRNA/ATAC-seq data of paired BMMC- and PBMC-PIE (n=2). Plots annotated for major cell types, and tissue origins. HSPC-only UMAP plots were annotated for HSPC subtypes (bottom). (C) Expression of HSPC subtype-specific genes in PBMC- (top) and BMMC-PIE (bottom) dataset. (D) Summary of study participants profiled using PBMC-PIE workflow. (E) UMAP of PBMC-PIE snRNA-seq data. (F-G) UMAP of HSPC for RNA- and ATAC-seq data. HSPC subtypes are annotated using two methods: annotation based on cell type-specific gene expression (F), and annotation from ATAC-seq dataset for human BM HSPC subtype (G).
Figure 4.
Figure 4.. Sustained epigenetic alterations in CD34+ HSPC following severe COVID-19.
(A) Overview depicting clinical groups and ATAC-seq workflow used for epigenomic profiling of CD34+ HSPC. (B) PCA plot of HSPC ATAC-seq samples using the combined set of DAR (left). Boxplots (right) show PC1 and PC2 values for each donor across groups. (C) Top: Normalized read density of all DAR in each clusters by groups. Each DAR (group average) is represented by a linked line across groups (top). Bottom: Cluster average of normalized DAR density score for individuals within groups. (D) GO analysis of genes associated to cluster-specific DAR in HSPC. (p<0.05) (E) ATAC-seq genome tracks for representative cluster-specific DAR in HSPC. Boxplots display normalized DAR densities for each donor across groups.
Figure 5.
Figure 5.. Durably altered phenotypes and programs in HSPC following severe COVID-19.
(A) GO analysis of genes with upregulated expression, and chromatin accessibility (DORC) in HSPC of each clinical group compared to Healthy. (B) Frequency of HSPC subcluster among total HSPC for individual across groups. (C) UMAP of HSPC with subtype annotations. (D) Gene set enrichment analysis (GSEA) between Early and Late HSPC. (E-F) UMAP displaying GMP module score (E) and DORC scores for the neutrophil module (F) per cell (left). Distribution of the module scores per cell in each clinical group (right). (G) Heatmap of chromVAR score (Z-score-normalized median) for subtype-defining TFs. (H-I) chromVAR scores for FOS::JUN and CEBPA in HSPC. TF scores projected on HSPC UMAP (left). Average TF score per individual (middle) and per-cell score (right) across groups.
Figure 6.
Figure 6.. TF programs are durably altered following severe COVID-19 and are shared between HSPC and CD14 + monocytes.
(A) Differentially active TFs in HSPC (left) and CD14+ monocytes (right) between Healthy and Early/Late groups. (B-C) chromVAR scores for IRF2 in HSPC (B) and CD14+ monocytes (C). Scores projected on myeloid UMAP (left). Per-cell scores across groups (right). (D) Average expression of representative marker genes of M.SC3 in each individual. (E-F) M.SC3 module score in myeloid cells (E) and HSPC (F). M.SC3 module score is projected onto UMAP (left). Per-cell M.SC3 module score across groups (right).
Figure 7.
Figure 7.. IL-6R signaling programs post-infection phenotypes
(A) GMP frequency in HSPC for each individual across groups. (Wilcoxon’s test, * p < 0.05; Healthy-reference) (B) Average chromVAR score (row-normalized) for selected TFs across groups. (C) DEG in Late HSC/MPP between aIL-6R treated and non-treated groups. (Wilcoxon’s test, * adj.p < 0.05, “Late with aIL-6R”-reference) (D) Experiment schema of A/J mice MHV-1 infection model. (E) UMAP of mouse BM lineage-depleted progenitor populations, with celltype annotation and simplified trajectories. (F) Frequency of progenitor subtypes among lineage-depleted cells across groups. (G) Average chromVAR score (row-normalized) for selected TFs across groups. (H) Per-cell GMP module score in the HSC/MPP cluster across groups. (Wilcoxon’s test, * p < 0.05; Recovered-reference) (I) UMAP of BALF macrophage and color-scaled density of each group. (J) Cell count ratio between two macrophage subclusters (Mac2/Mac1) in each group. (K) Absolute cell density (cells/mm2) of selected cell types in the region of interest (ROI) across sample groups in imaging mass cytometry data of post-mortem lung tissue. Density per ROI is represented by small transparent dots, while larger dots indicate the average density per study participant. (ROI value, Wilcoxon’s test, * p < 0.05; Recovered-reference) (L) Monocyte counts in brain tissue across different groups. (ANOVA, * p < 0.05; naïve, n = 5; recovered, n = 9; aIL-6R, n=6) (M) Representative images from immunofluorescence staining of mouse brain in different groups showing varying degrees of demyelination and a box plot displaying the average intensity of myelin basic protein (MBP) staining per ROI (transparent dot) and per mouse across groups (larger dot). (Wilcoxon’s test, * p < 0.05, Healthy-reference)

Comment in

References

    1. Xiong Y, Liu Y, Cao L, Wang D, Guo M, Jiang A, Guo D, Hu W, Yang J, Tang Z, et al. (2020). Transcriptomic characteristics of bronchoalveolar lavage fluid and peripheral blood mononuclear cells in COVID-19 patients. Emerg. Microbes Infect. 9, 761–770. 10.1080/22221751.2020.1747363. - DOI - PMC - PubMed
    1. Yang D, Chu H, Hou Y, Chai Y, Shuai H, Lee AC-Y, Zhang X, Wang Y, Hu B, Huang X, et al. (2020). Attenuated Interferon and Proinflammatory Response in SARS-CoV-2-Infected Human Dendritic Cells Is Associated With Viral Antagonism of STAT1 Phosphorylation. J. Infect. Dis. 222, 734–745. 10.1093/infdis/jiaa356. - DOI - PMC - PubMed
    1. Wang J, Jiang M, Chen X, and Montaner LJ (2020). Cytokine storm and leukocyte changes in mild versus severe SARS-CoV-2 infection: Review of 3939 COVID-19 patients in China and emerging pathogenesis and therapy concepts. J. Leukoc. Biol. 108, 17–41. 10.1002/JLB.3COVR0520-272R. - DOI - PMC - PubMed
    1. Lucas C, Wong P, Klein J, Castro TBR, Silva J, Sundaram M, Ellingson MK, Mao T, Oh JE, Israelow B, et al. (2020). Longitudinal analyses reveal immunological misfiring in severe COVID-19. Nature 584, 463–469. 10.1038/s41586-020-2588-y. - DOI - PMC - PubMed
    1. Zhang Q, Bastard P, Liu Z, Le Pen J, Moncada-Velez M, Chen J, Ogishi M, Sabli IKD, Hodeib S, Korol C, et al. (2020). Inborn errors of type I IFN immunity in patients with life-threatening COVID-19. Science 370. 10.1126/science.abd4570. - DOI - PMC - PubMed

Publication types