. 2023 Sep 12;56(9):2054-2069.e10.
doi: 10.1016/j.immuni.2023.07.017. Epub 2023 Aug 18.

A regulatory circuit controlled by extranuclear and nuclear retinoic acid receptor α determines T cell activation and function

Affiliations

A regulatory circuit controlled by extranuclear and nuclear retinoic acid receptor α determines T cell activation and function

Alexandre Larange et al. Immunity. .

Abstract

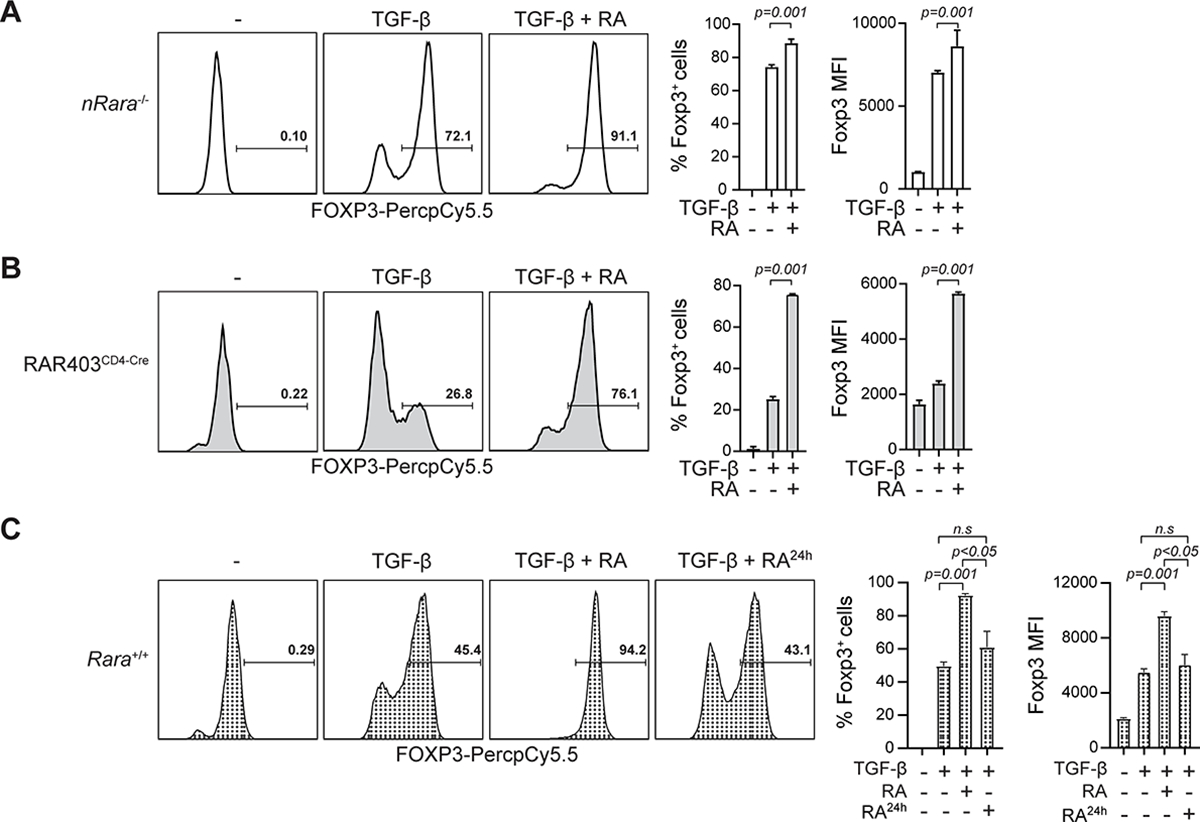
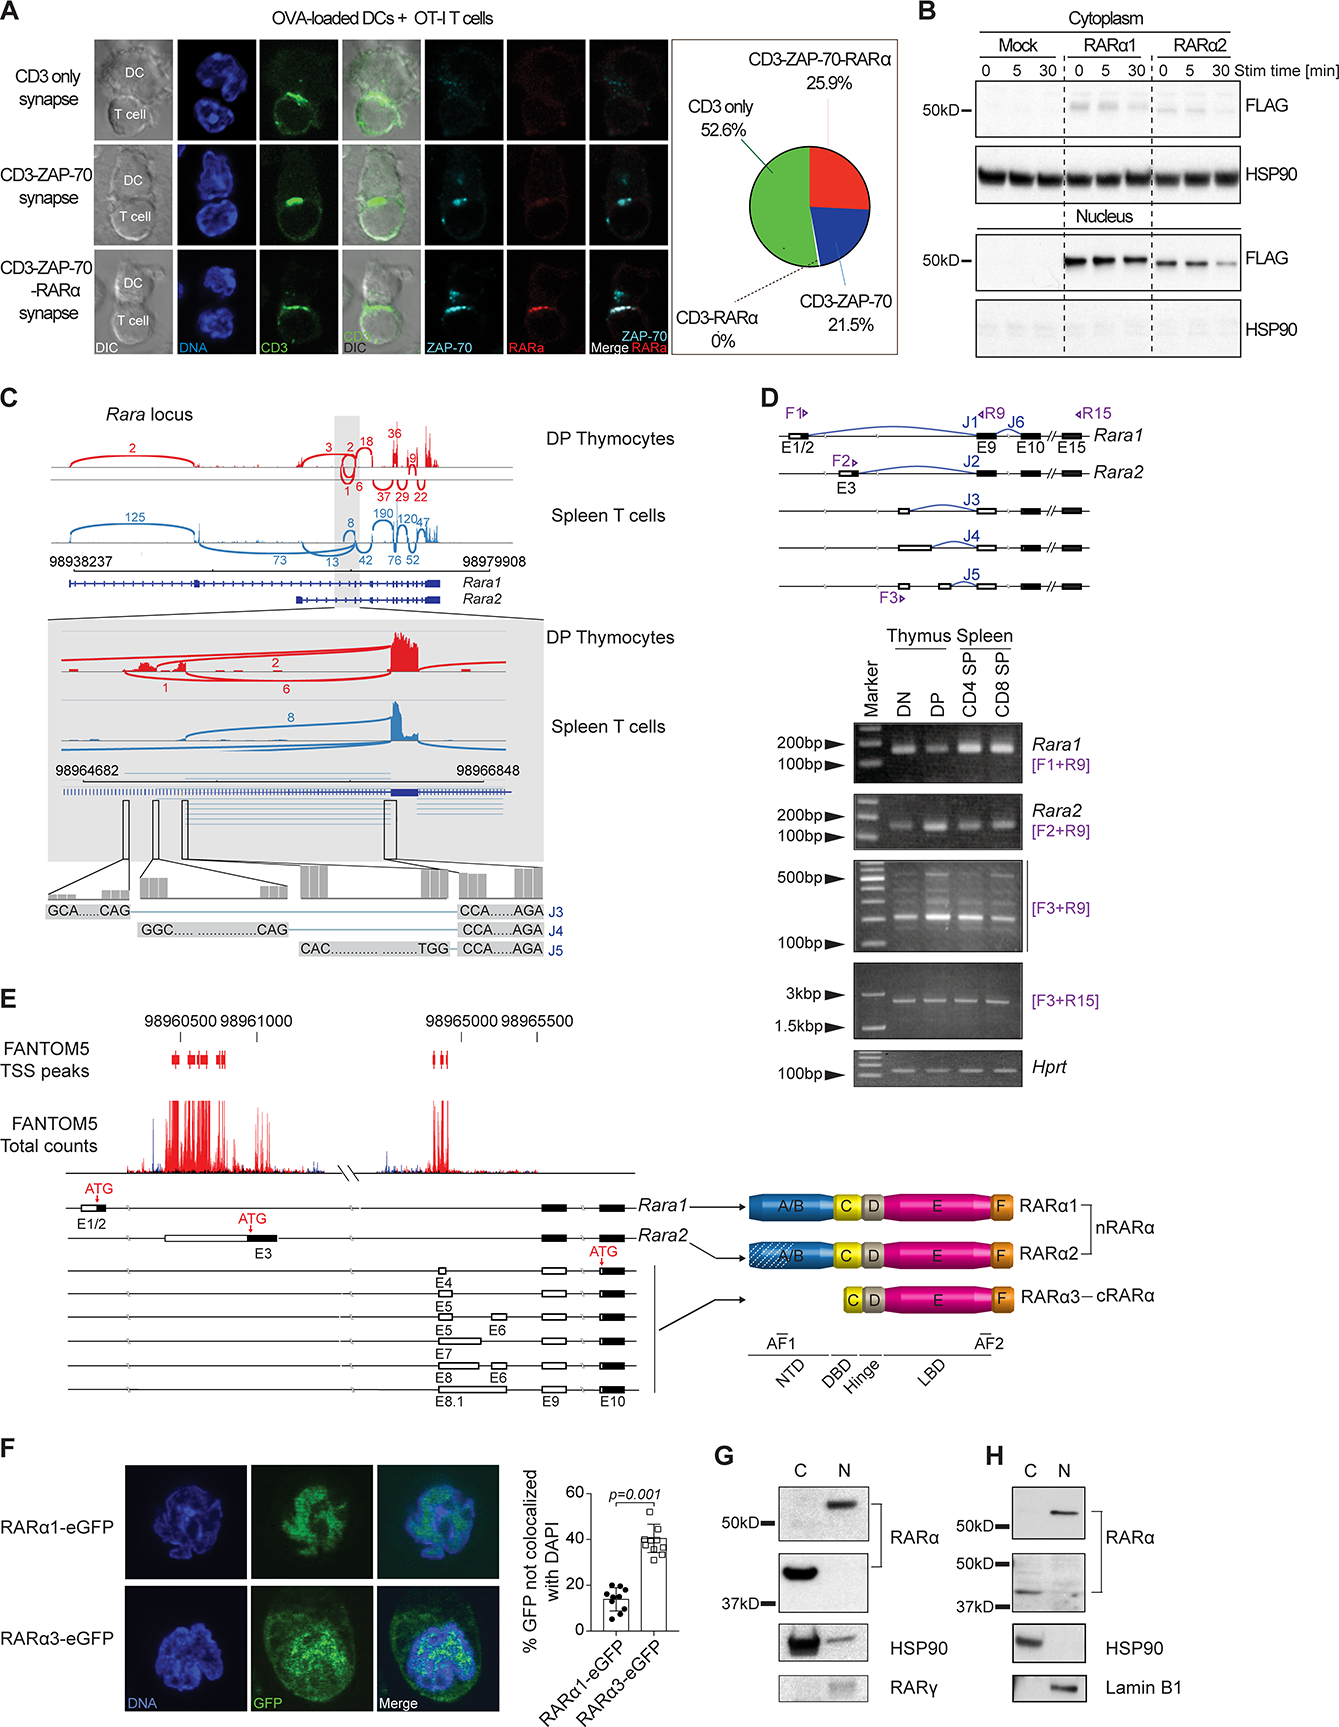
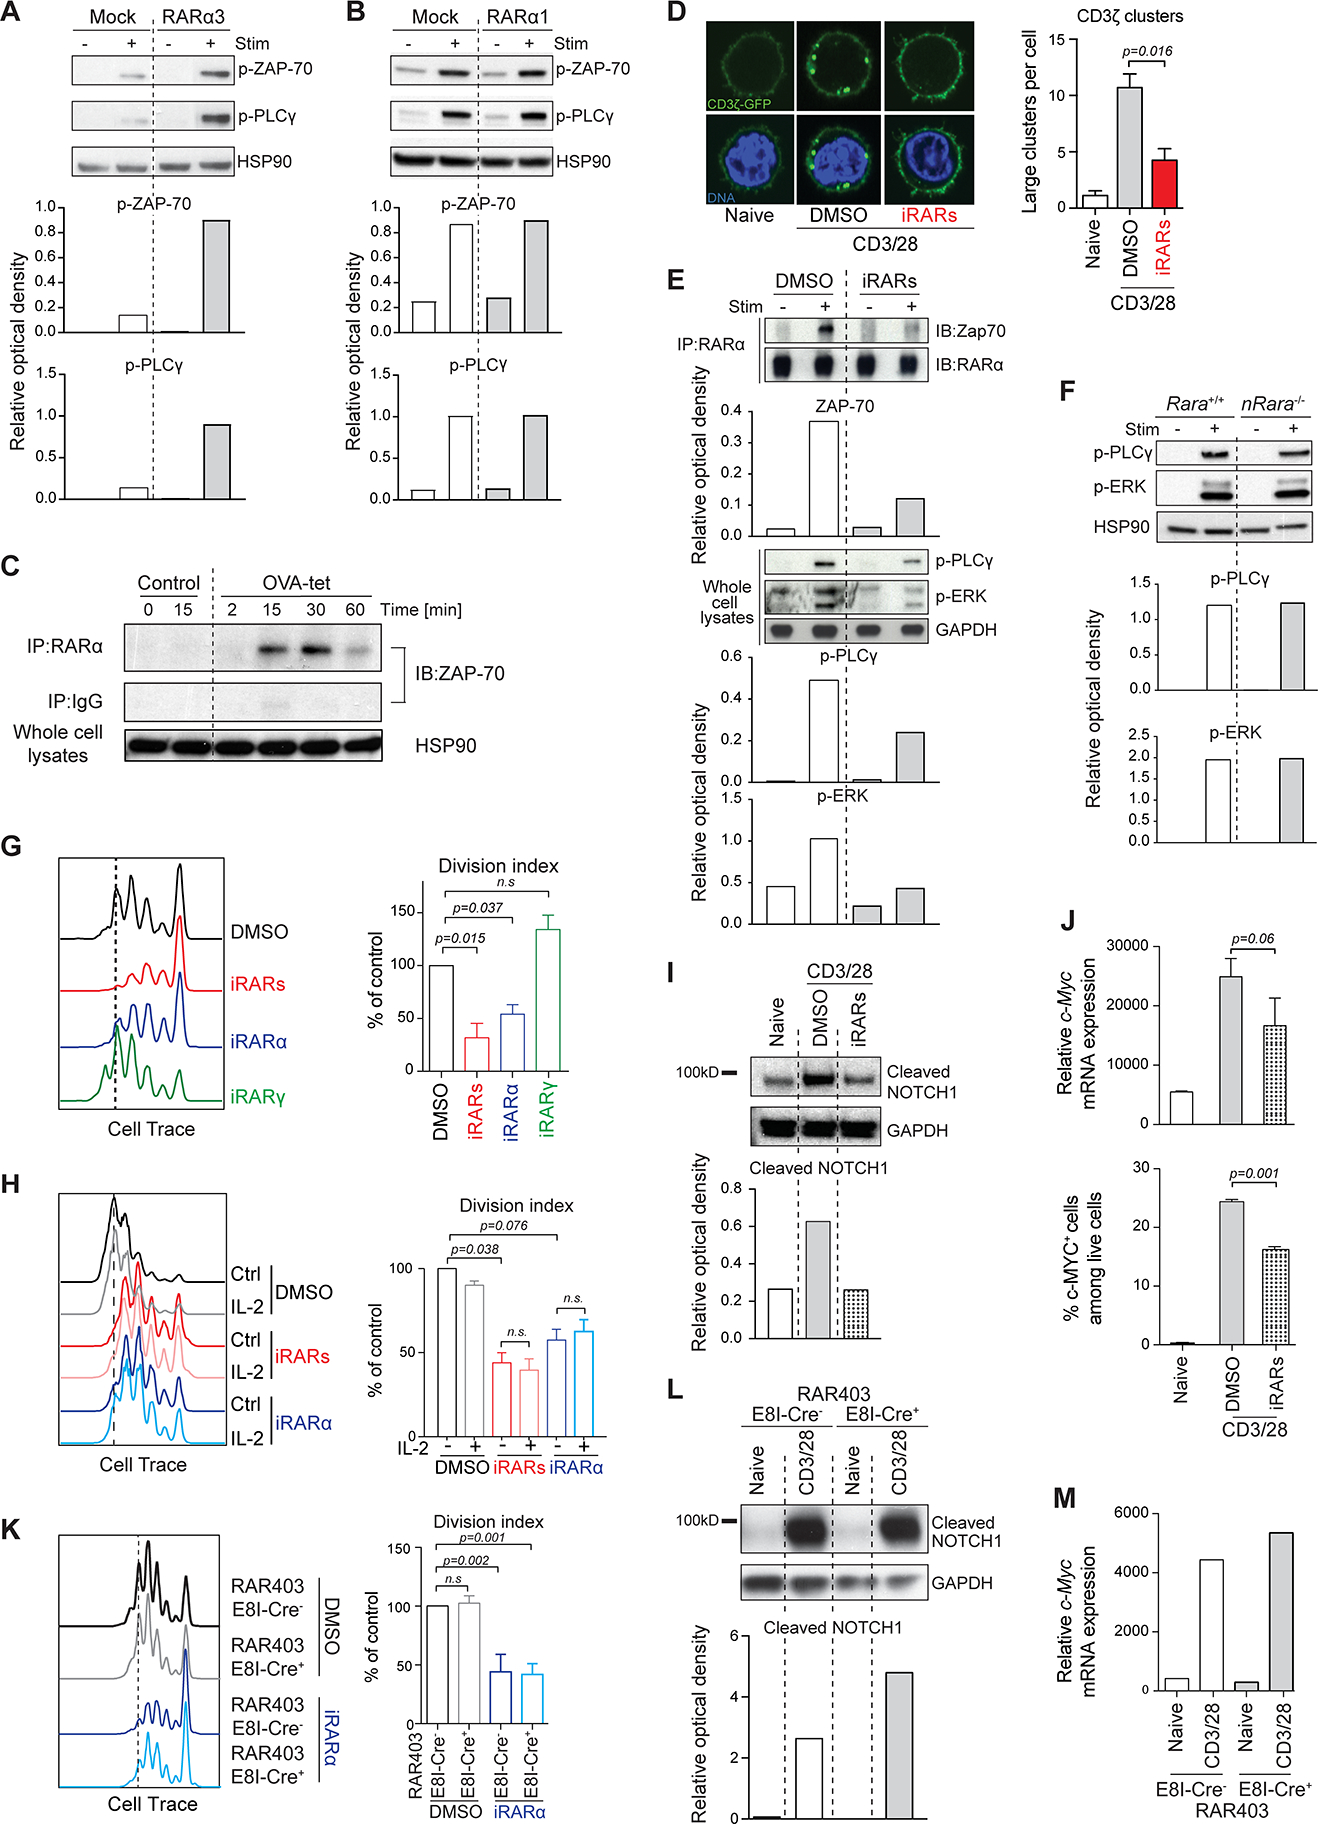
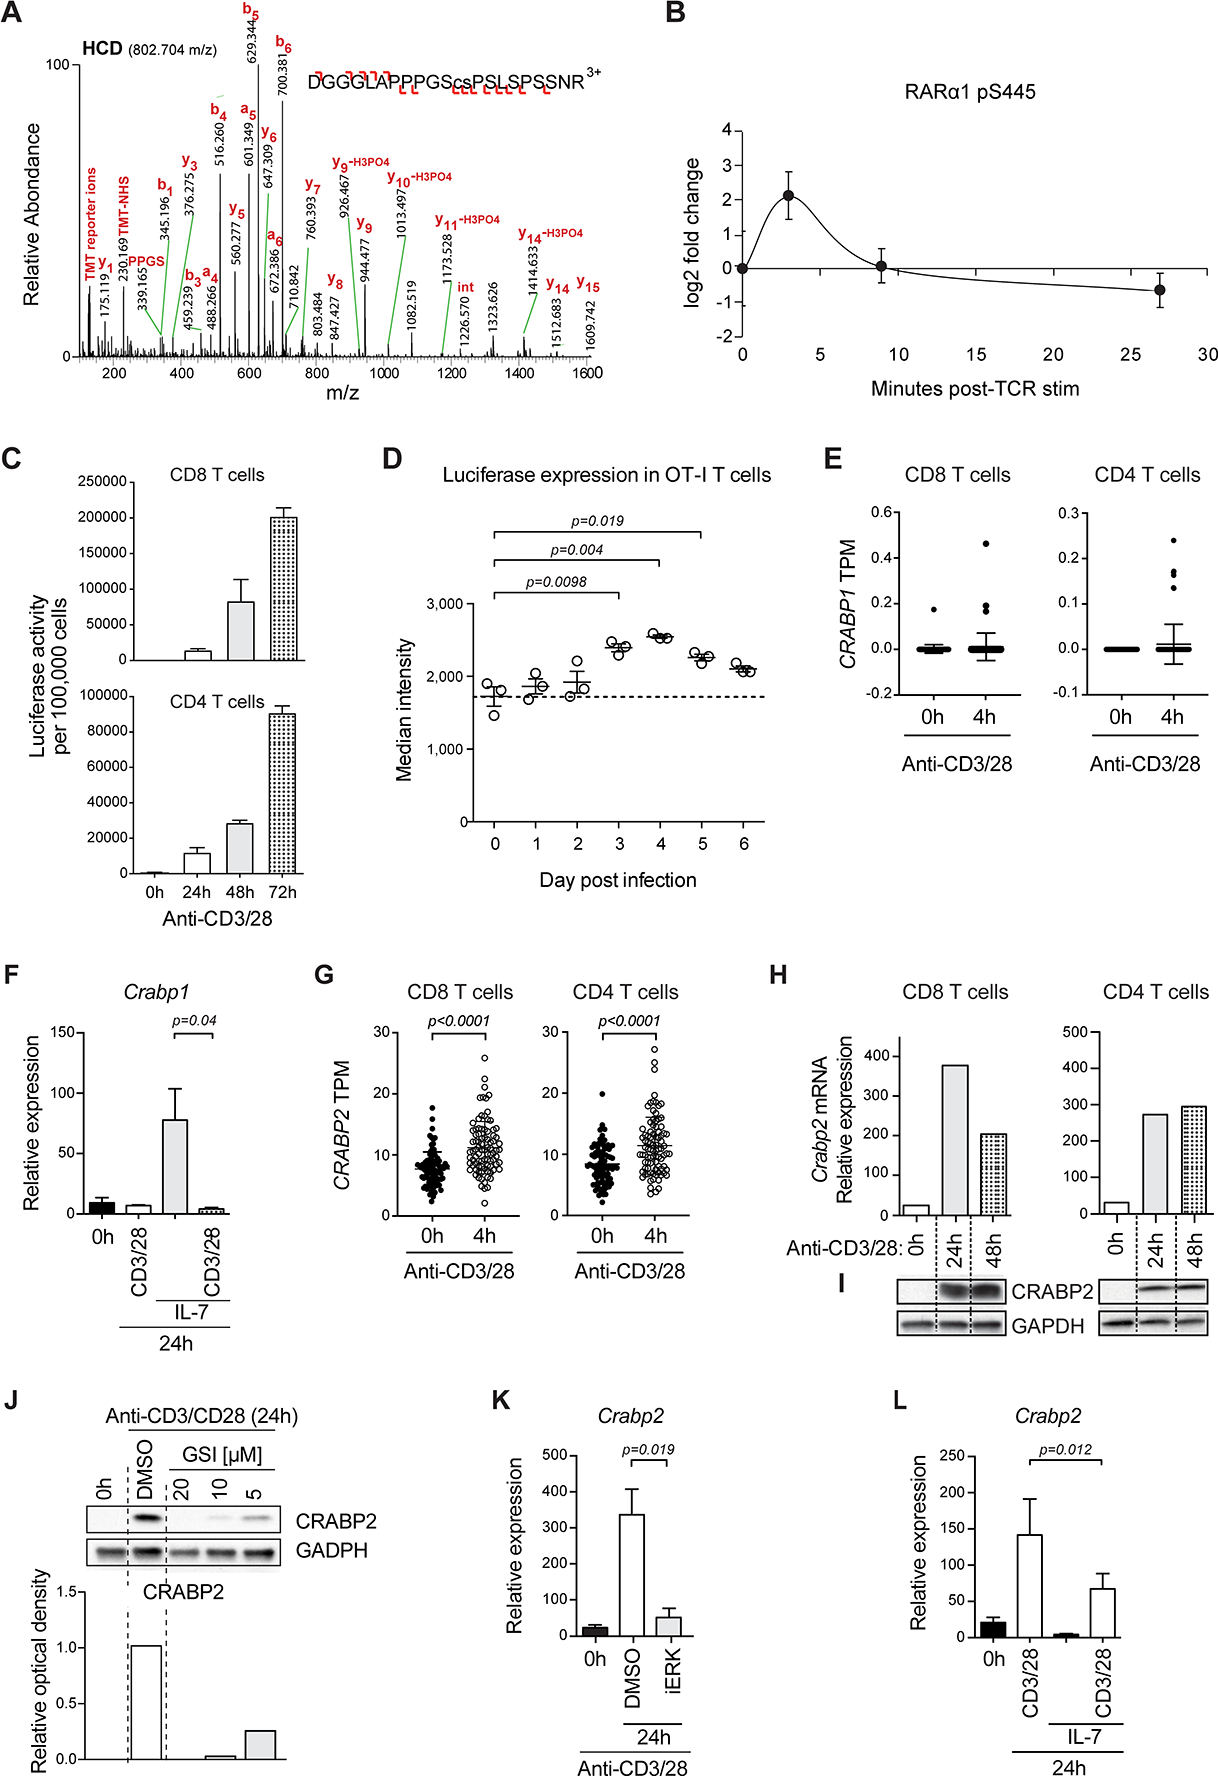
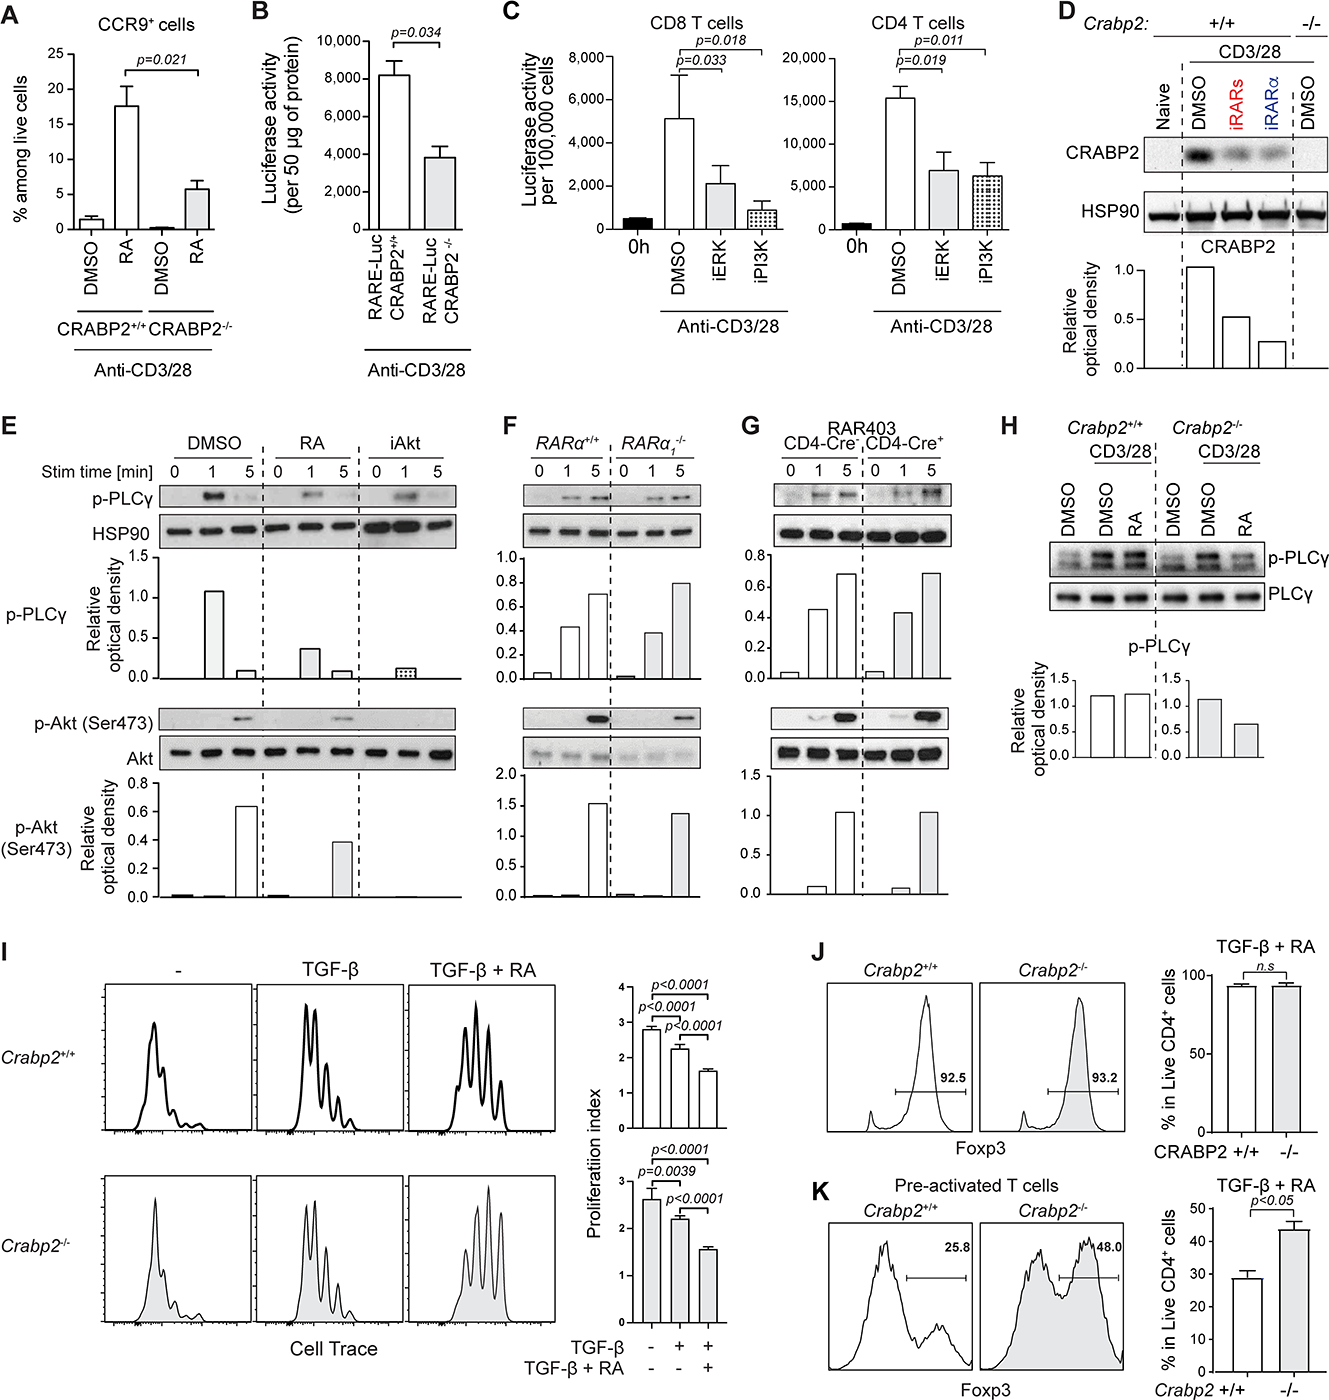
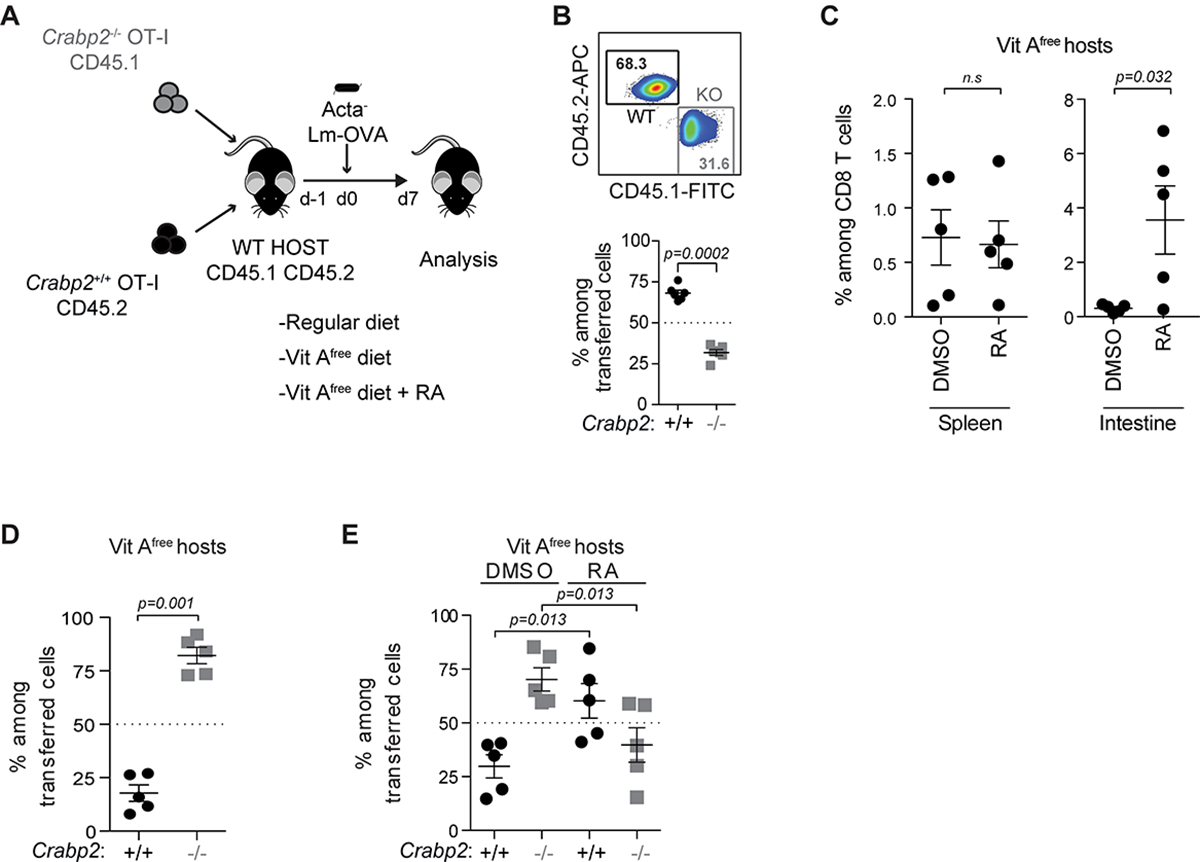
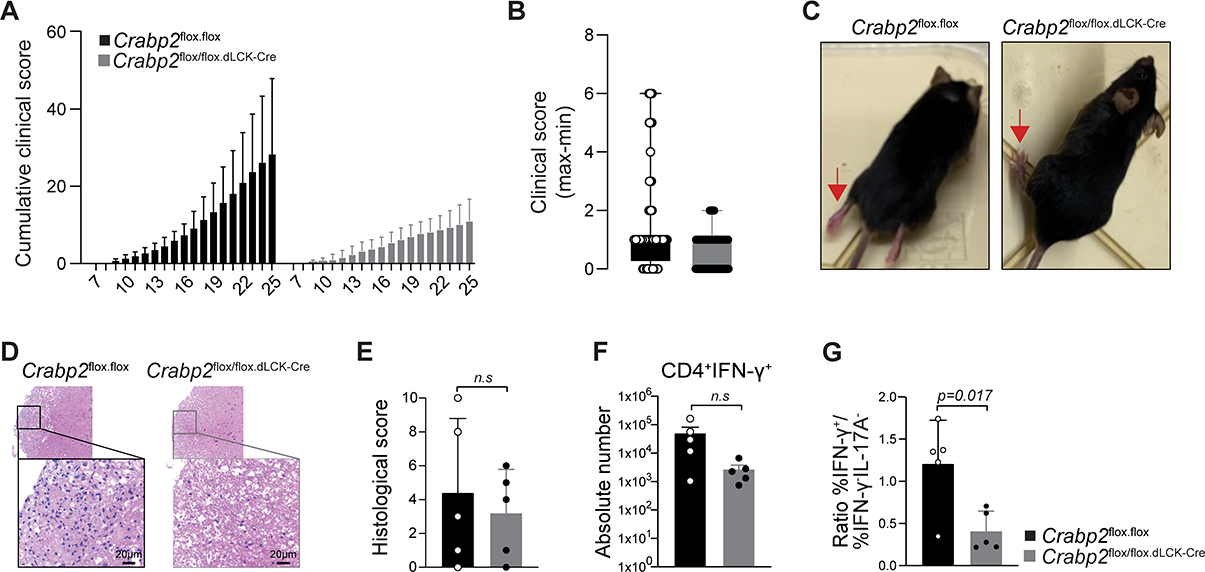
Ligation of retinoic acid receptor alpha (RARα) by RA promotes varied transcriptional programs associated with immune activation and tolerance, but genetic deletion approaches suggest the impact of RARα on TCR signaling. Here, we examined whether RARα would exert roles beyond transcriptional regulation. Specific deletion of the nuclear isoform of RARα revealed an RARα isoform in the cytoplasm of T cells. Extranuclear RARα was rapidly phosphorylated upon TCR stimulation and recruited to the TCR signalosome. RA interfered with extranuclear RARα signaling, causing suboptimal TCR activation while enhancing FOXP3+ regulatory T cell conversion. TCR activation induced the expression of CRABP2, which translocates RA to the nucleus. Deletion of Crabp2 led to increased RA in the cytoplasm and interfered with signalosome-RARα, resulting in impaired anti-pathogen immunity and suppressed autoimmune disease. Our findings underscore the significance of subcellular RA/RARα signaling in T cells and identify extranuclear RARα as a component of the TCR signalosome and a determinant of immune responses.

Keywords: FOXP3(+) regulatory T cells; T cell receptor; ZAP-70; anti-pathogen immunity; autoimmune disease; cellular-retinoic-acid-binding protein; effector differentiation; extranuclear; nuclear receptor; proliferation; retinoic acid; retinoic acid receptor alpha; signal transduction.


Conflict of interest statement

Declaration of interests The authors declare no competing interests.

Figures

FIGURE 1:
FIGURE 1:. RA enhances Treg cell conversion independently of nuclear RARα. (Related data shown in Figure S1)
(A-B) FOXP3 intracellular staining of (A) nRARα-deficient or (B) DNRARα (RAR403CD4-Cre) spleen CD4 T cells stimulated for 96hrs with α-CD3/CD28 with or without TGF-β or RA (10 nM). (C) Naïve WT spleen CD4 T cells stimulated with α-CD3/CD28 with or without TGF-β. After 24hrs RA (10 nM) was added or not and cells were cultured for another 72hrs and stained for intracellular FOXP3. Shown representative histograms of 3 independent experiments (left) and statistical analyses of FOXP3+ T cell frequency and mean fluorescence intensity (MFI) (right). Statistical significance calculated with two-tailed Student t-test. Shown mean +/− SEM.
FIGURE 2:
FIGURE 2:. T cells express an extranuclear isoform of RARα. (Related data shown in Figure S2)
(A) CD3, ZAP-70 and RARα staining of OT-I T cells co-cultured with OVA-loaded DCs for 40min. DAPI marks DNA. Representative cells are shown. Frequencies of synapse types from 1 representative experiment out of 2. (B) Naive spleen T cells transduced with FLAG-tagged RARα1 or RARα2 activated with α-CD3/CD28 for 5 or 30min. Localization of FLAG-tagged RARα1 and RARα2 assessed by western blotting. HSP90 as control. Data are representative of 3 experiments. (C) Mouse DP thymocytes and spleen T cells RNA-seq data aligned on UCSC mm10. Rara-mapped short-reads around exon 9 (gray background) shown. Numbers indicate short-reads of exons. J3, J4 and J5 are new splice junctions. (D) Junction usage with exon 9 in common. Forward (F) and reverse (R) primers indicated. RT-PCR of DN and DP thymocytes and CD4 and CD8 T cells with primers as shown. F1+R9 and F2+R9 primers detect Rara1 and -2. F3 primer is of 5’ end of exon E6 of XM_006532597.2. (E) Transcription start site(s) (TSS) of new Rara transcripts using FANTOM5 database. Forward and reverse transcription direction marked by red and blue peaks. New exon sequences shown. New RARα protein sequences with internal ATG translational starts. Domains in RARα1, -α2 and -α3 are shown. (F) CD4 T hybridoma cells transduced with RARα1-GFP or RARα3-GFP analyzed by confocal microscopy and localization of GFP assessed. Images show 1 focal plane of representative cells. Graph represents mean +/− SEM from 150 or more cells from 1 representative experiment out of 2 (each dot represents 15–20 cells). (G-H) RARα expression in cytoplasm (C) and nucleus (N) of human (Jurkat) (G) and primary mouse T cells (H). Expression of RARγ, Lamin B1 and HSP90 as control for N or C fractions, respectively. Data are representative from 2 (h) and 3 (m) independent experiments.
FIGURE 3:
FIGURE 3:. Extranuclear RARα controls TCR signal transduction. (Related data shown in Figure S3)
(A-B) Primary mouse spleen T cells transduced with (A) Rara3- or (B) Rara1 cDNA, were activated with α-CD3/CD28 for 5min. Phosphorylation of ZAP-70 and PLCγ assessed by western blotting. HSP90 used as control. Representative of 2 experiments. (C) OT-I CD8 T cells stimulated with H2Kb-OVA tetramers. Cell-lysates immunoprecipitated with α-RARα. Precipitates were assessed for ZAP-70 by western blotting. HSP90 in whole cell lysates as control. Shown 1 representative out of 3 experiments. (D) Spleen T cells transduced with CD3ζ-GFP activated with α-CD3/CD28 for 30min. CD3ζ-GFP clustering was quantified. Representative cells shown. Graph is mean +/− SEM from > 150 cells from 3 experiments. A large cluster was empirically defined. (E) OT-I T cells stimulated with H2Kb-OVA tetramers with or without RARα inhibitor (Ro41–5253). Cell-lysates were immunoprecipitated with α-RARα and blotted for ZAP-70 or RARα. (F) WT or RARα1-deficient spleen T cells activated with α-CD3/CD28 for 5min. Phosphorylation of PLCγ and ERK was assessed. HSP90 as control. Shown representative western blot out of 3. (G-H) Cell trace-labeled spleen T cells treated with DMSO, a pan-RAR antagonist LE540 (iRARs), an RARα-specific antagonist Ro 41–5253 (iRARα) or an RARγ antagonist MM11253 (iRARγ), activated with α-CD3/CD28 without (G) or with rIL-2 (H). Proliferation assessed after 72hrs. Shown representative data. Graph means +/− SEM of division index calculated from 3 experiments expressed as percentage of control. (I) Primary spleen T cells treated with DMSO or RAR antagonist were activated with α-CD3/CD28 for 4hrs. Cleaved NOTCH1-intracellular domain assessed by western blotting. Shown 1 representative out of 3. (J) Primary spleen T cells with DMSO or inhibitor activated with α-CD3/CD28 for 4hrs and analyzed for c-Myc mRNA (upper panel) and c-MYC protein (lower panel). Graph represents means +/− SEM from 3 experiments. (K) Cell trace-labeled dnRara cre− or cre+ T cells with DMSO or iRARα and activated with α-CD3/CD28. Proliferation assessed after 72hrs. Shown representative experiment. Graph represents means +/− SEM of division index from 3 experiments expressed as a percentage of control. (L) dnRara cre− or cre+ spleen T cells activated with α-CD3/CD28 for 4hrs. Cleaved NOTCH1 was assessed. Shown 1 representative western blot out of 3. (M) dnRara cre− or cre+ spleen T cells activated with α-CD3/CD28 for 4hrs. c-Myc mRNA assessed. Graph shows means +/− SEM from 2 experiments. Where appropriate band intensities were quantified by Relative Optical Density (ROD) relative to control.
FIGURE 4:
FIGURE 4:. Extranuclear and nuclear RARα are activated by distinct mechanisms
(A) Higher-energy C-trap dissociation (HCD) MS2 mass spectrum identifying TCR-induced phosphorylation of RARα at S445. Sequence of a 22 amino acid F domain peptide with phosphorylated serine is in lower case. Difference between measured and theoretical m/z expressed as parts per million (ppm). Product ions leading to the peptide sequence are shown, with b- (N-terminal) and y-series (C-terminal) ions indicated with left and right facing signs. (B) Phosphorylation dynamics of RARα pS445 in the first 30min of T cell stimulation, relative to unstimulated, determined by tandem mass tag (TMT)-based quantification. Error bars show standard deviation for double or triple biological replicates. (C) RARE-Luc CD8 or CD4 T cells activated with α-CD3/CD28 for 24hrs, 48hrs and 72hrs. Luciferase activity was measured. The means +/− SEM of 2 experiments are shown. (D) Three OT-I TCR transgenic RARE-Luc mice infected i.v. with ActA Lm-OVA/day analyzed until 6 days post-infection for luciferase expression in spleen cells. Median fluorescence intensity of luciferase expression per mouse is shown. Data are from 1 experiment out of 2. (E) RNA-Seq data from human naïve CD8 or CD4 (CD3+ CD45RA+ CD127+ CCR7+) peripheral blood T cells stimulated with α-CD3/CD28 for 4hrs analyzed for CRABP1 expression. CRABP1 mRNA in transcripts per million (TPM) for each donor (n=88). P value calculated by Mann-Whitney U test. Datasets are from Database of Immune Cell Expression, expression quantitative trait loci (eQTLs) and epigenomics (DICE); https://dice-database.org/. (F) Mouse spleen CD8 T cells activated with α-CD3/CD28 or IL-7 or both. Crabp1 mRNA was quantified. Data are means +/− SEM of 4 experiments. (G) Expression of CRABP2 mRNA in activated human T cells assessed as in (E). (H-I) CD8 or CD4 mouse spleen T cells activated with α-CD3/CD28 and Crabp2 mRNA (H) and protein (I) were evaluated. Relative expression (mRNA) or western blot (Protein) of 1 of 3 experiments. (J) Expression of CRABP2 in CD4 mouse spleen T cells activated for 24hrs with α-CD3/CD28 alone or together with various doses of γ-secretase inhibitor (GSI). Quantification of the optical band density relative to control HSP90. Representative western blot of two independent experiments. (K) Spleen T cells activated with α-CD3/CD28 for 24hrs in DMSO or with MEK/ERK inhibitor U0126 (iERK). Crabp2 mRNA was evaluated. Means +/− SEM of Crabp2 mRNA are shown of 3 experiments. (L) Mouse spleen T cells activated with α-CD3/CD28 or IL-7 or both. mRNA of Crabp2 was quantified. Data are means +/− SEM of 4 experiments.
FIGURE 5:
FIGURE 5:. RA counteracts extranuclear RARα signaling in T cells. (Related data shown in Figure S4)
(A) WT or CRABP2-deficient spleen T cells activated with α-CD3/CD28 and RA for 72hrs and assessed for CCR9 expression. Graphs show means +/− SEM of CCR9+ T cells from 3 experiments. (B) WT- or CRABP2-deficient-RARE-Luc spleen T cells activated with α-CD3/CD28 for 48hrs and assessed for luciferase activity. Shown are means +/− SEM of luciferase activity per 50μg of protein for 3 experiments. (C) RARE-Luc CD8 (left) or CD4 (right) T cells activated with α-CD3/CD28 for 24hrs in DMSO, or a MEK/ERK inhibitor U0126 (iERK) or a PI3K inhibitor LY294002 (iPI3K). Luciferase activity was measured. Data are shown as means +/− SEM of 3 experiments. (D) WT or CRABP2-deficient spleen T cells activated with α-CD3/CD28 for 24hrs in DMSO and for WT T cells also with pan-RAR antagonist (iRARs) or RARα antagonist (iRARα). CRABP2 expression is evaluated. Representative western blot of 2 independent experiments. (E) Naïve CD4 T cells in DMSO, Retinoic Acid (RA) or an AKT inhibitor (AKT Inhibitor VIII) and activated with α-CD3/CD28 for indicated times. Phosphorylation of PLCγ and AKT was assessed. (F-G) Naïve CD4 T cells from nRARα-deficient (F) or DNRARα mice (G), activated with α-CD3/CD28 for indicated times were assessed for phosphorylation of PLCγ and AKT. (H) WT or CRABP2-deficient spleen T cells activated with α-CD3/CD28 for 72hrs were sorted and re-activated for 1min in DMSO or DMSO + (10nM) RA and PLCγ phosphorylation evaluated. Total PLCγ was measured as control. Data in (E-H) are representative from 3 experiments. (I) Proliferation of cell trace-labeled WT or CRABP2-deficient CD4 T cells activated with α-CD3/CD28 alone or with TGF-β or TGF-β + RA for 72hrs was evaluated. Histograms show a representative experiment and graphs show means +/− SEM of the division index from 3 experiments, expressed as a percentage of control. (J) Naïve WT or CRABP2-deficient CD4 T cells activated with α-CD3/CD28 alone or with TGF-β or TGF-β + RA for 72hrs were assessed for FOXP3. Frequency of FOXP3+ cells is shown. A representative histogram and_means +/− SEM of 3 experiments are shown. (K) Naïve WT or CRABP2-deficient CD4 T cells activated with α-CD3/CD28 alone or with TGF-β or TGF-β + RA for 72hrs after 24hrs pre-activation without TGF-β + RA. FOXP3 was assessed and frequency of FOXP3+ cells assessed. A representative histogram and means +/− SEM of 3 experiments are shown. Student t-test was used for the statistical analysis. Where appropriate band intensity was quantified by ROD relative to control.
Figure 6:
Figure 6:. Extranuclear RARα signaling controls TCR-induced proliferation in vivo. (Related data shown in Figure S5)
(A) Experimental strategy. (B) Tracking of adoptively transferred naïve CD45.2+ WT and CD45.1+ CRABP2-deficient OT-I cells in spleen of CD45.1+CD45.2+ recipient mice 7 days after intravenous (i.v.) infection with ActA Lm-OVA. Percentage of WT(CD45.2+) and CRABP2-deficient (CD45.1+) OT-I cells among donor cells is shown. (C) Tracking of adoptively transferred naïve CD45.2+ WT OT-I cells in spleen and small intestine epithelium of CD45.1+CD45.2+ vitamin A-free recipient mice treated with DMSO or RA, 7 days after infected i.v. with ActA Lm-OVA. Percentage is shown of WT OT-I T cells among total CD8 T cells. (D) Frequency of donor WT and CRABP2-deficient OT-I cells in the spleen of vitamin A-free CD45.1+CD45.2+ recipient mice infected i.v. with ActA Lm-OVA and assessed 7 days later. Percentage of WT and CRABP2-deficient OT-I cells among donor cells is shown. (E) Frequency of donor WT and CRABP2-deficient OT-I cells in spleen of DMSO or RA treated vitamin A-free CD45.1+CD45.2+ recipient mice infected i.v. with ActA Lm-OVA and assessed 7 days later. Percentage of WT and CRABP2-deficient OT-I cells among donor cells is shown. Data are representative of 2 experiments.
FIGURE 7:
FIGURE 7:. Extranuclear RARα signaling controls effector differentiation in vivo. (Related data shown in Figure S6)
(A-C) EAE was induced and the clinical score was evaluated daily. (A) Cumulative clinical score, (B) maximum and minimum clinical scores and (C) images of WT and Crabp2 conditional deletion mutant mice at day 22. Red arrows point to the hind limb position. (D-G) Histopathology analyses at day25 after EAE induction. (D) H&E staining of spinal cords from WT or Crabp2 conditional deletion mutant mice, (E) Histological score comprising inflammation severity and axon dilation, (F) IFNγ expression of FOXP3CD45+TGF-β+CD4 T cells from the spinal cord, (G) Ratio of IFNγ+ cells over IFNγ and IL-17 cells. P value was calculated by Student t-test. Five female mice of 8 to 12 weeks old were analyzed per condition in 2 EAE experiments. Shown mean +/− SD.

Comment in

References

    1. Larange A, Cheroutre H. Retinoic Acid and Retinoic Acid Receptors as Pleiotropic Modulators of the Immune System. Annu Rev Immunol. 2016;34:369–94. - PubMed
    1. di Masi A, Leboffe L, De Marinis E, Pagano F, Cicconi L, Rochette-Egly C, et al. Retinoic acid receptors: from molecular mechanisms to cancer therapy. Mol Aspects Med. 2015;41:1–115. - PubMed
    1. Hall JA, Cannons JL, Grainger JR, Dos Santos LM, Hand TW, Naik S, et al. Essential role for retinoic acid in the promotion of CD4(+) T cell effector responses via retinoic acid receptor alpha. Immunity. 2011;34(3):435–47. - PMC - PubMed
    1. Hall JA, Grainger JR, Spencer SP, Belkaid Y. The role of retinoic acid in tolerance and immunity. Immunity. 2011;35(1):13–22. - PMC - PubMed
    1. Farboud B, Privalsky ML. Retinoic acid receptor-alpha is stabilized in a repressive state by its C-terminal, isotype-specific F domain. Mol Endocrinol. 2004;18(12):2839–53. - PubMed

Publication types

Substances