. 2023 Dec;165(6):1458-1474.
doi: 10.1053/j.gastro.2023.08.009. Epub 2023 Aug 18.

Hypoxia-Inducible Factor 1α Stabilization Restores Epigenetic Control of Nitric Oxide Synthase 1 Expression and Reverses Gastroparesis in Female Diabetic Mice

Affiliations

Hypoxia-Inducible Factor 1α Stabilization Restores Epigenetic Control of Nitric Oxide Synthase 1 Expression and Reverses Gastroparesis in Female Diabetic Mice

Fei Gao et al. Gastroenterology. 2023 Dec.

Abstract

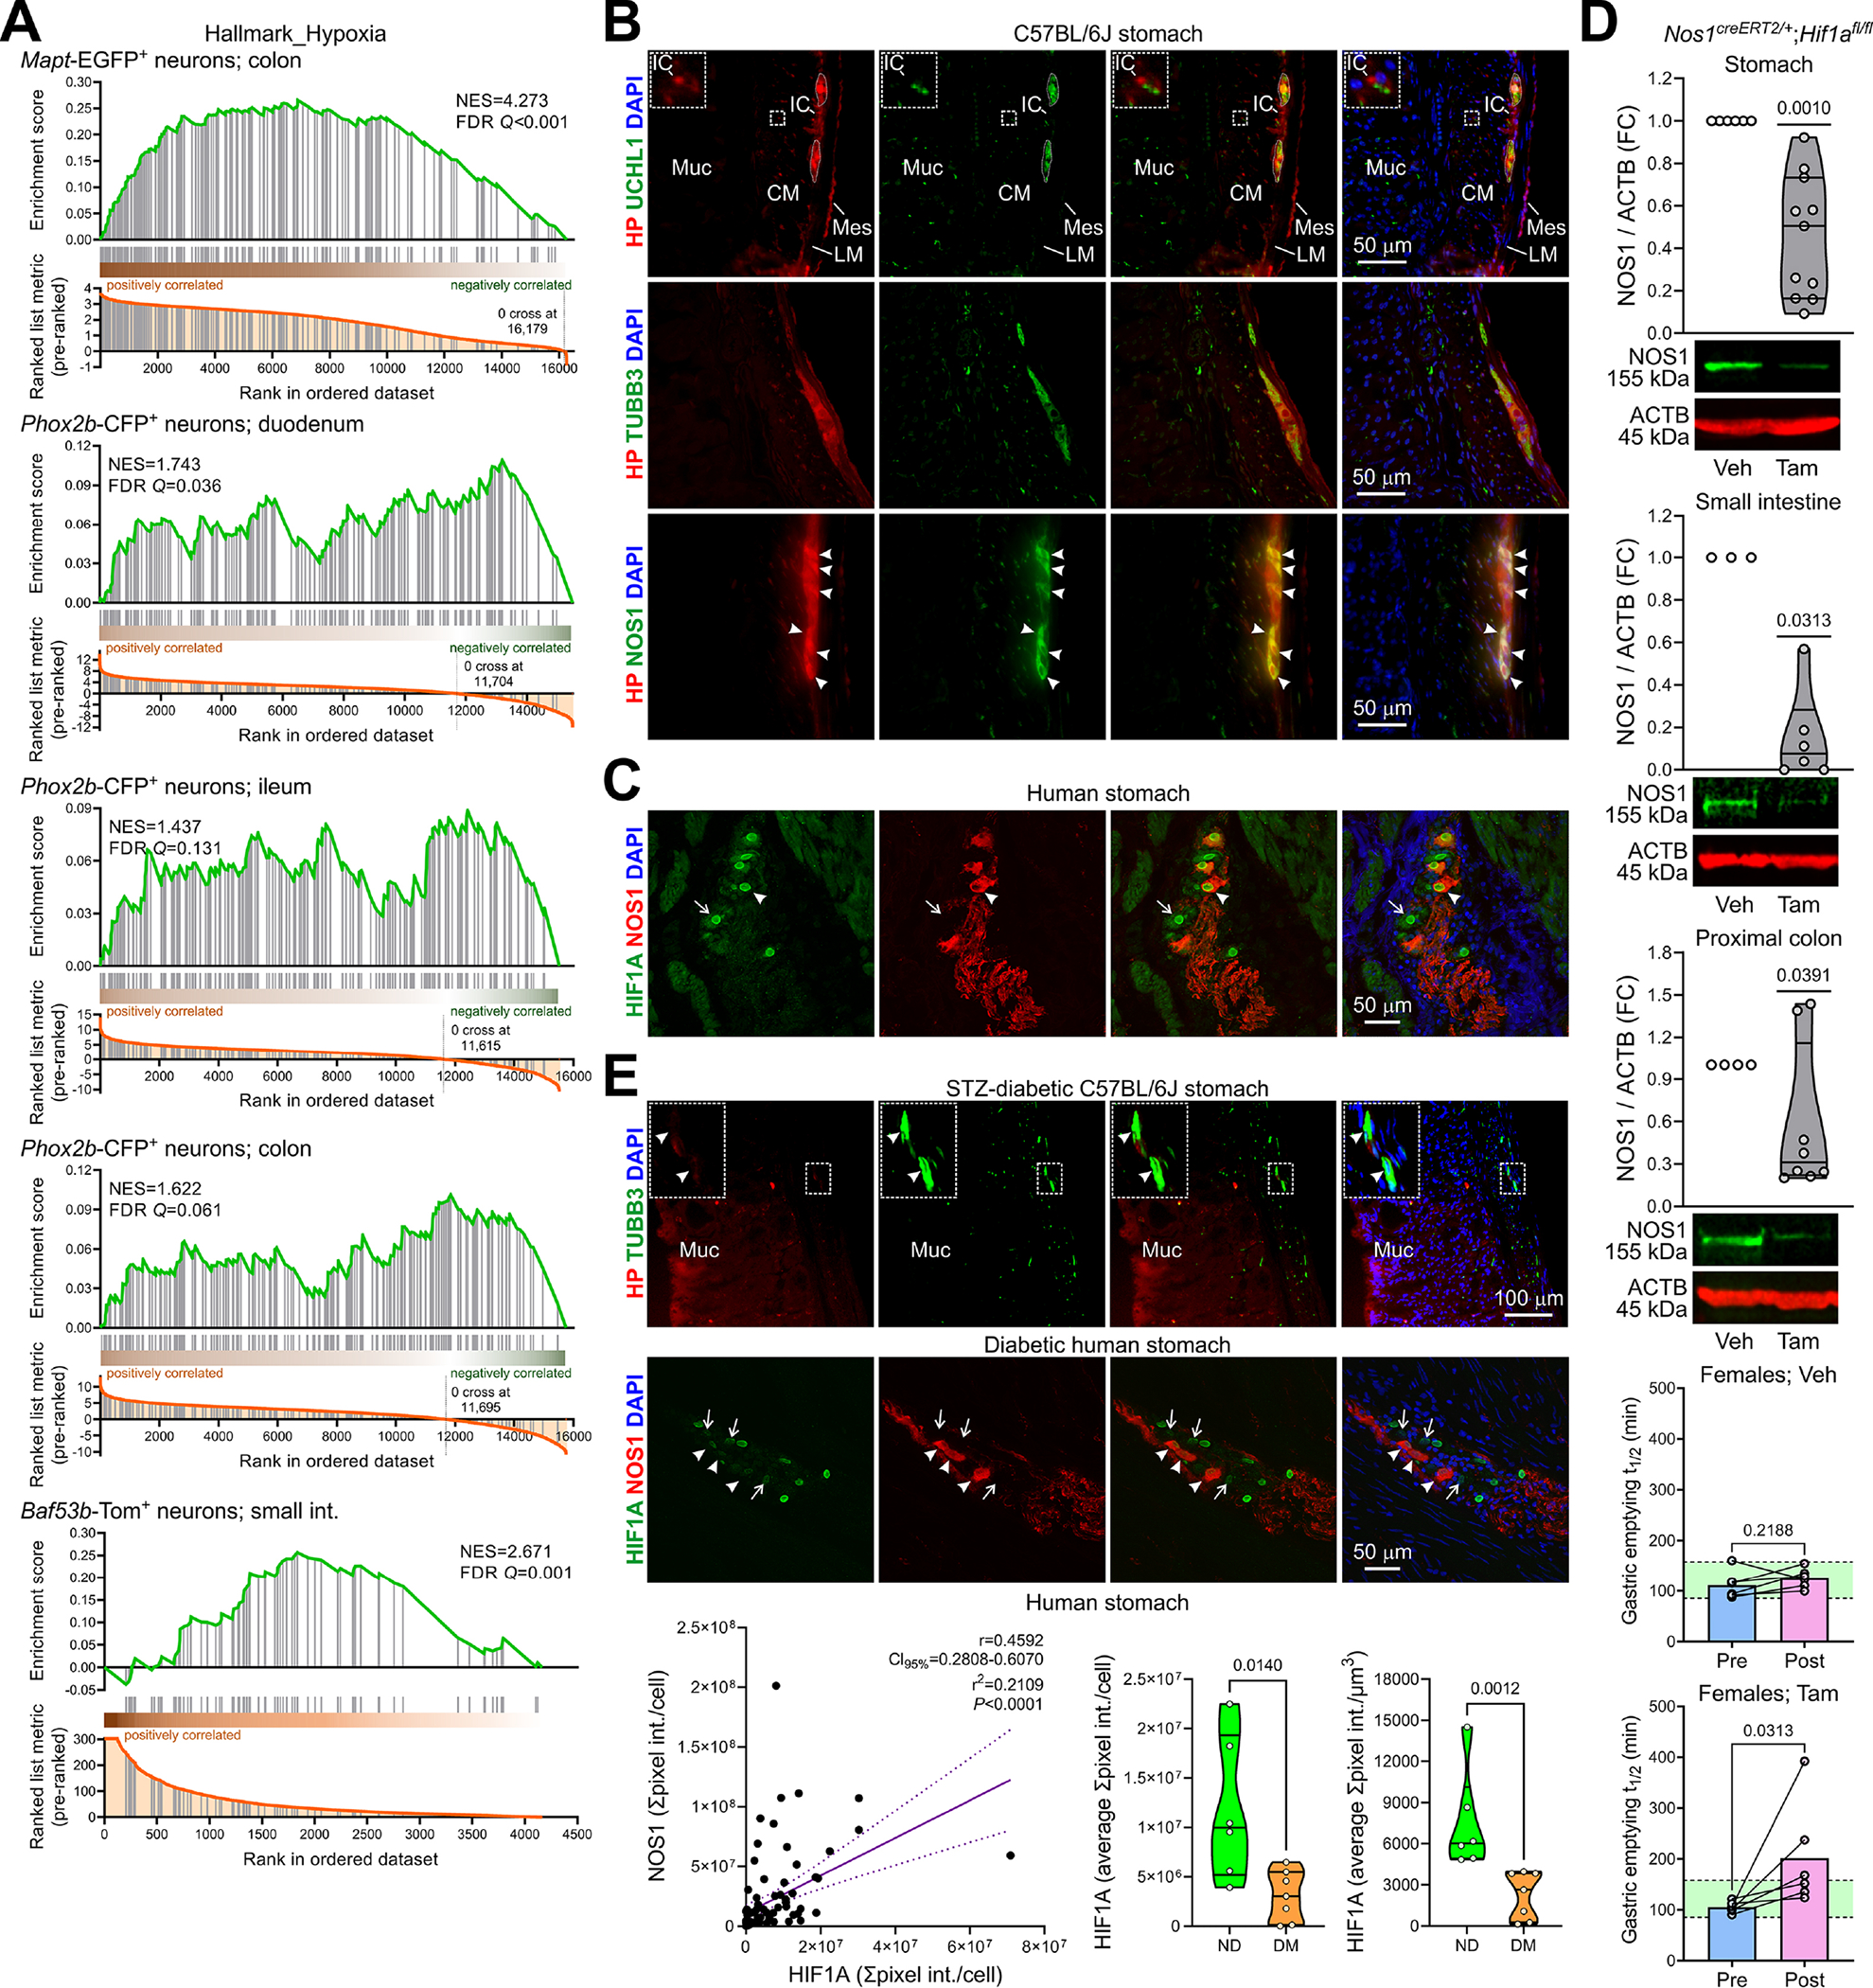
Background & aims: Although depletion of neuronal nitric oxide synthase (NOS1)-expressing neurons contributes to gastroparesis, stimulating nitrergic signaling is not an effective therapy. We investigated whether hypoxia-inducible factor 1α (HIF1A), which is activated by high O2 consumption in central neurons, is a Nos1 transcription factor in enteric neurons and whether stabilizing HIF1A reverses gastroparesis.

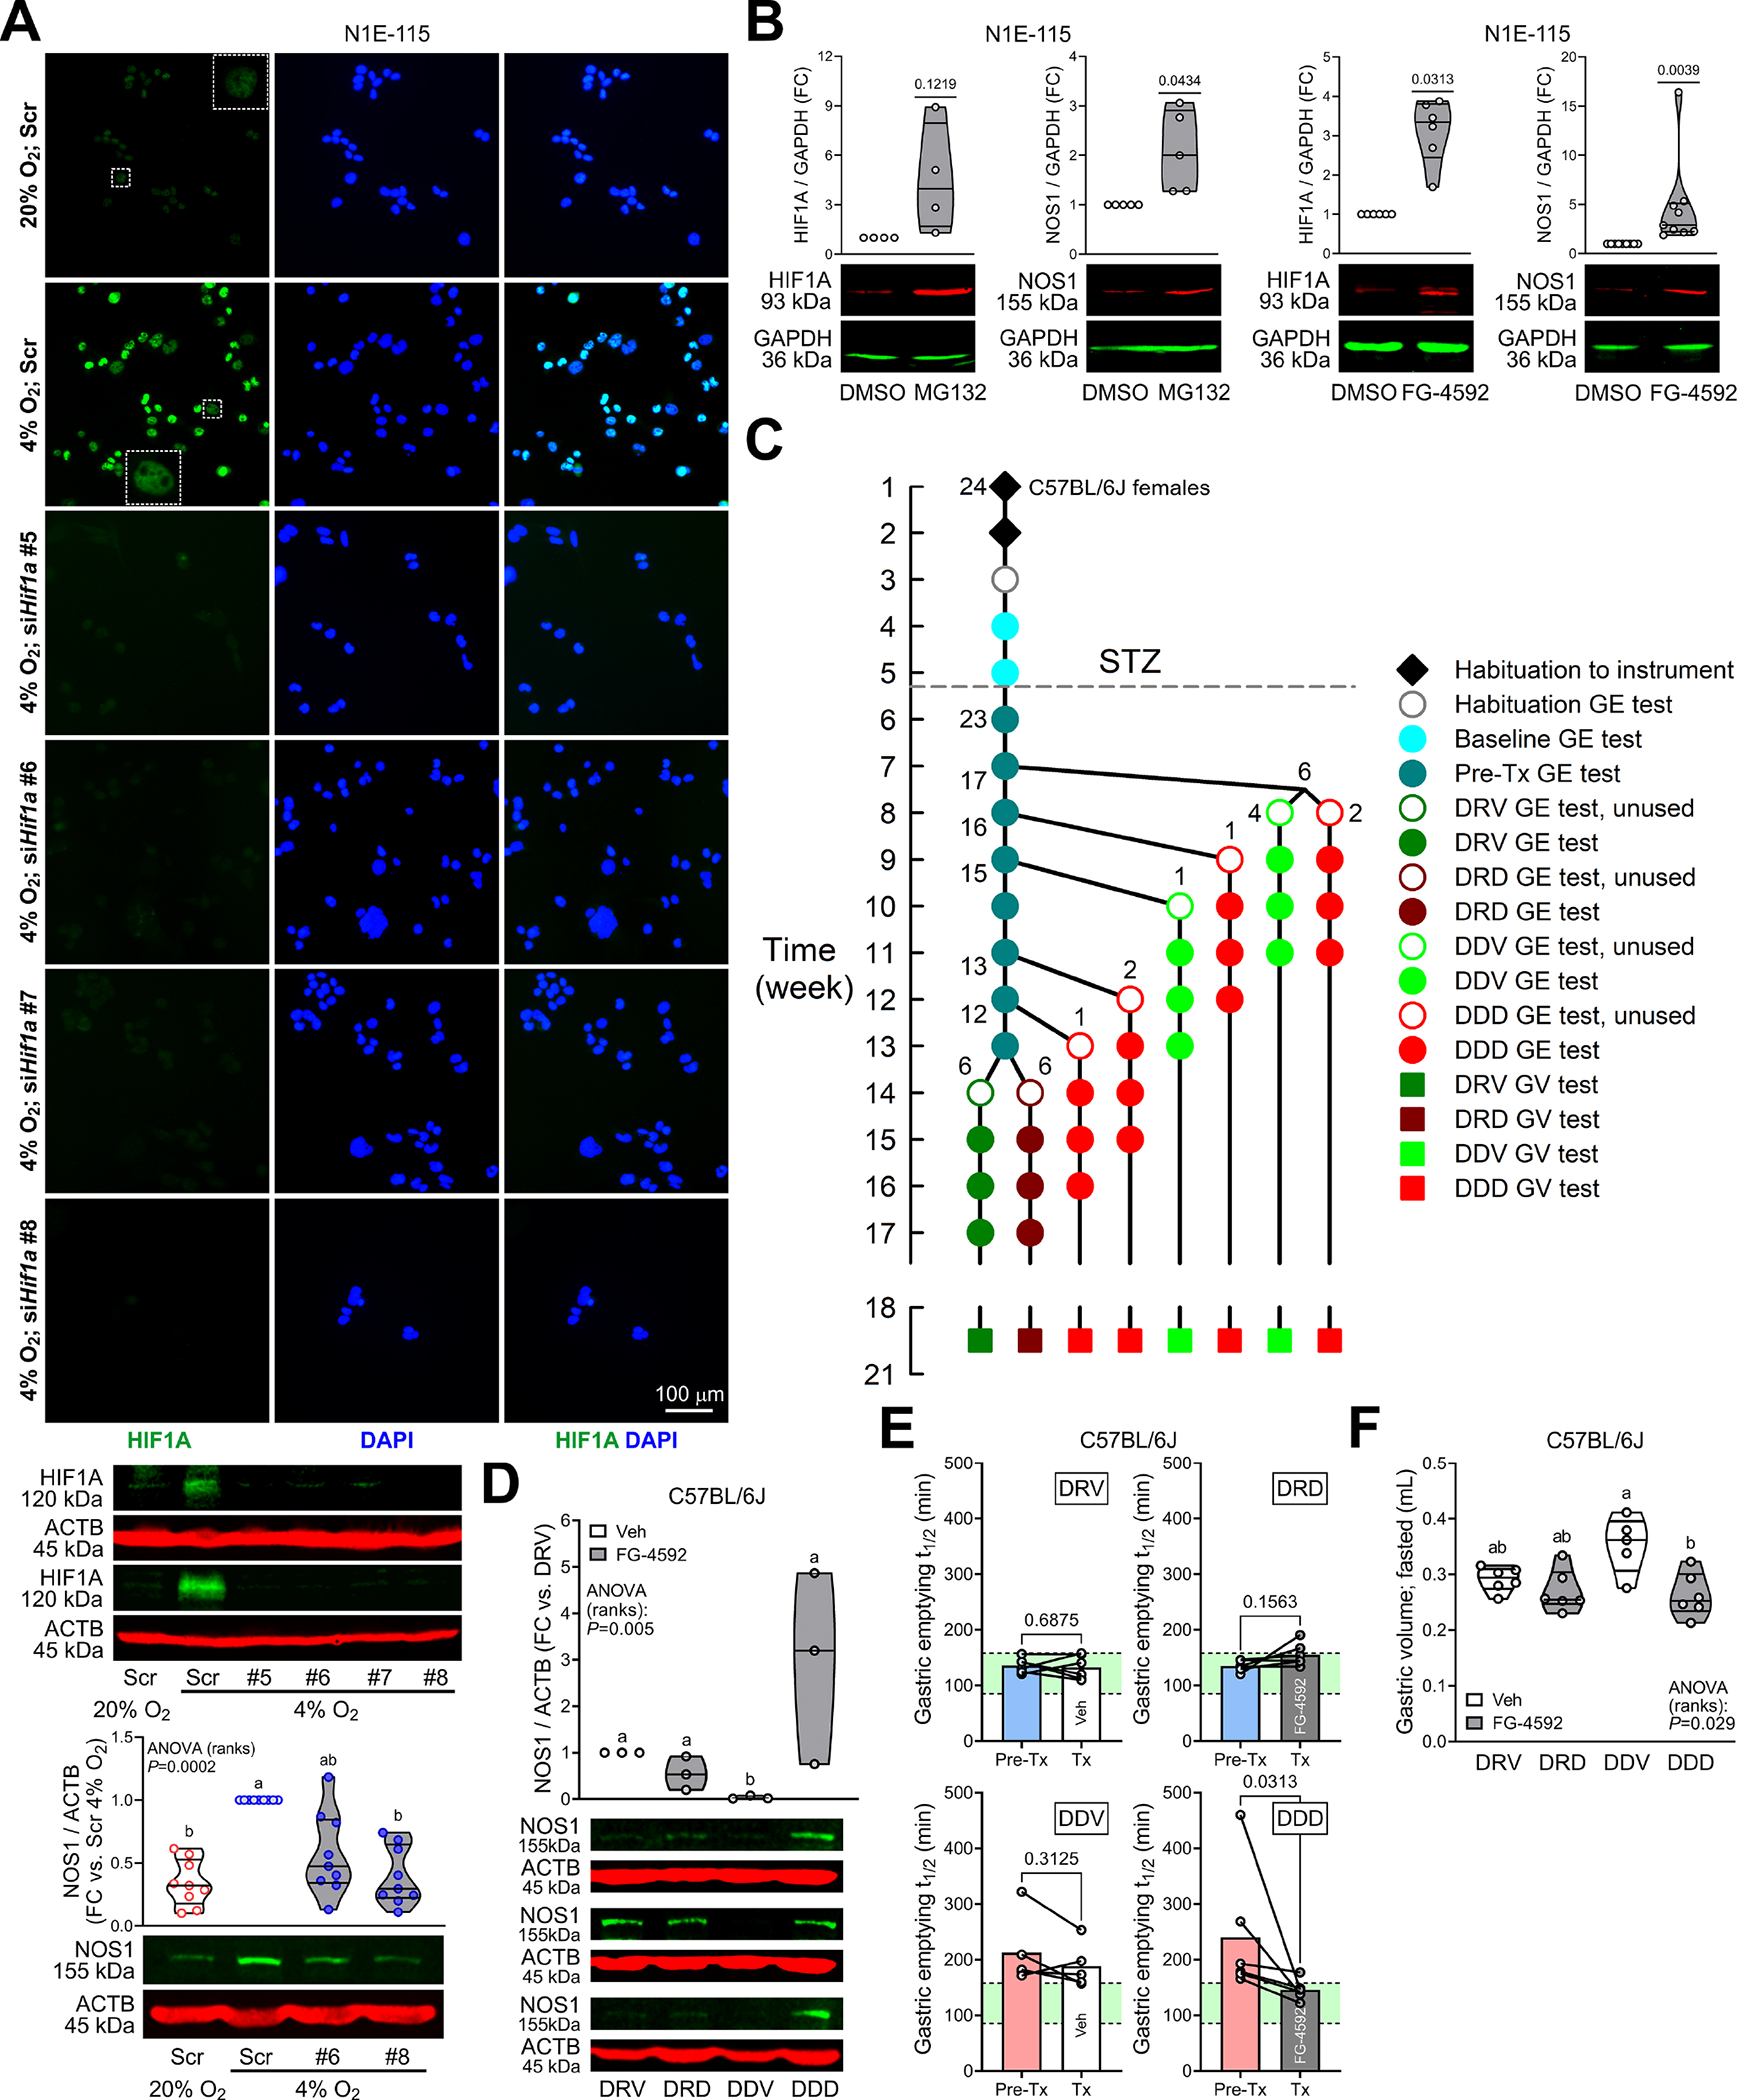
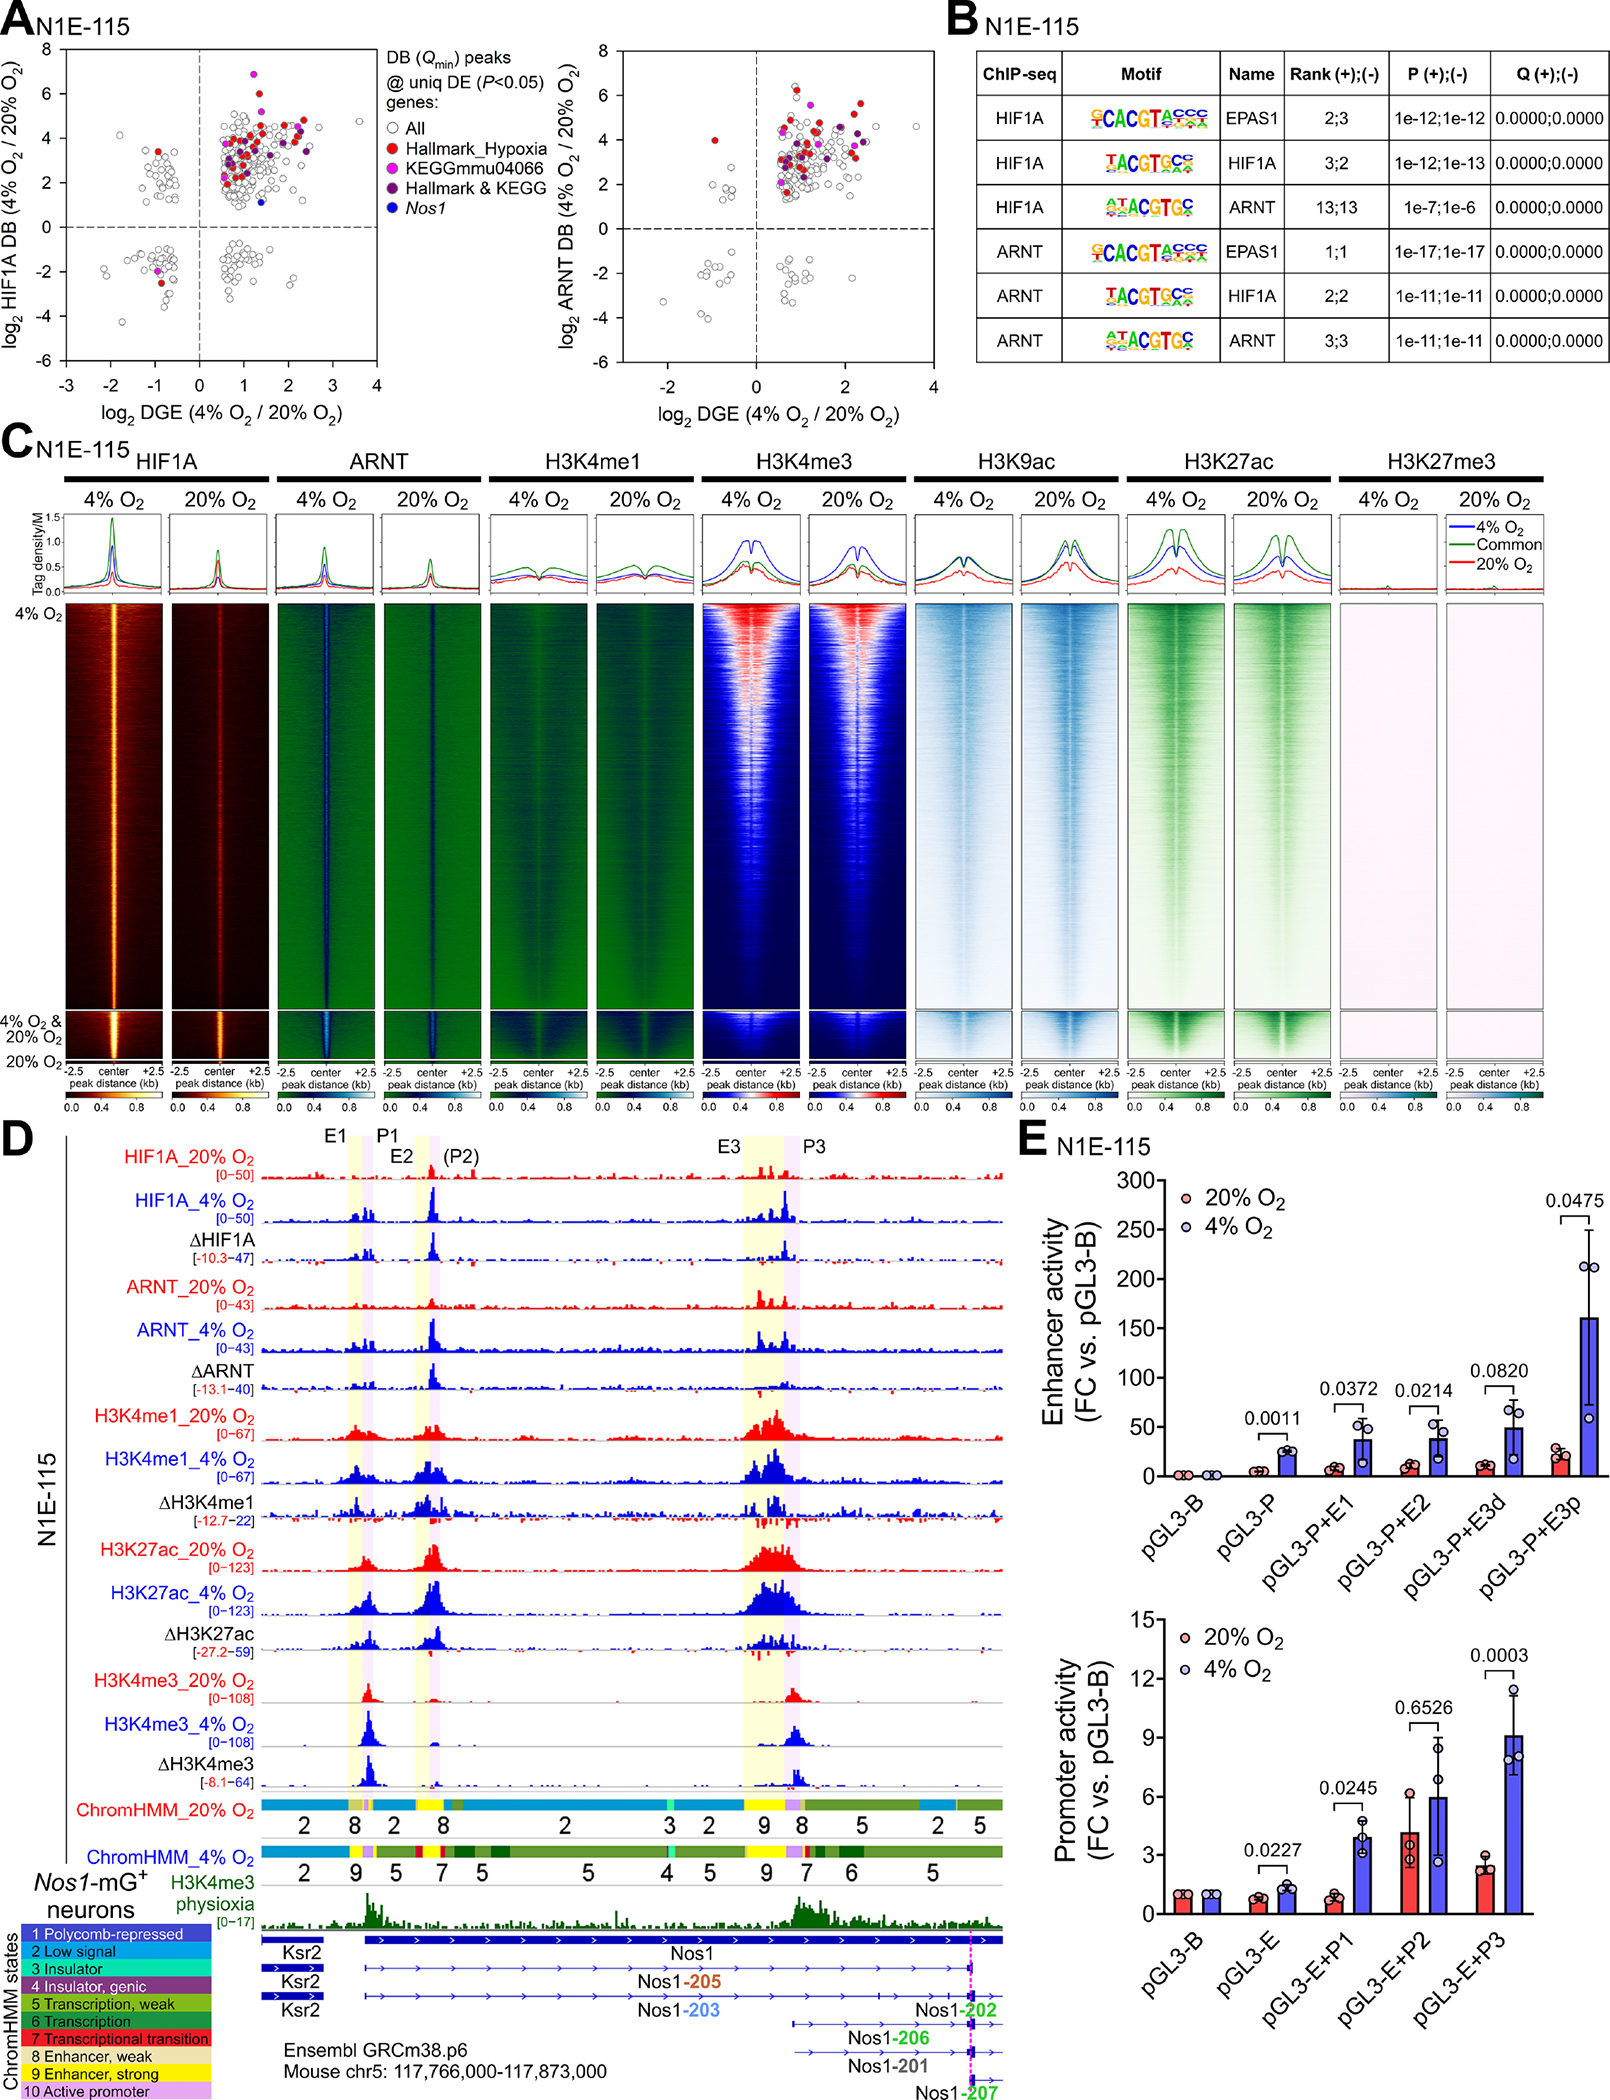
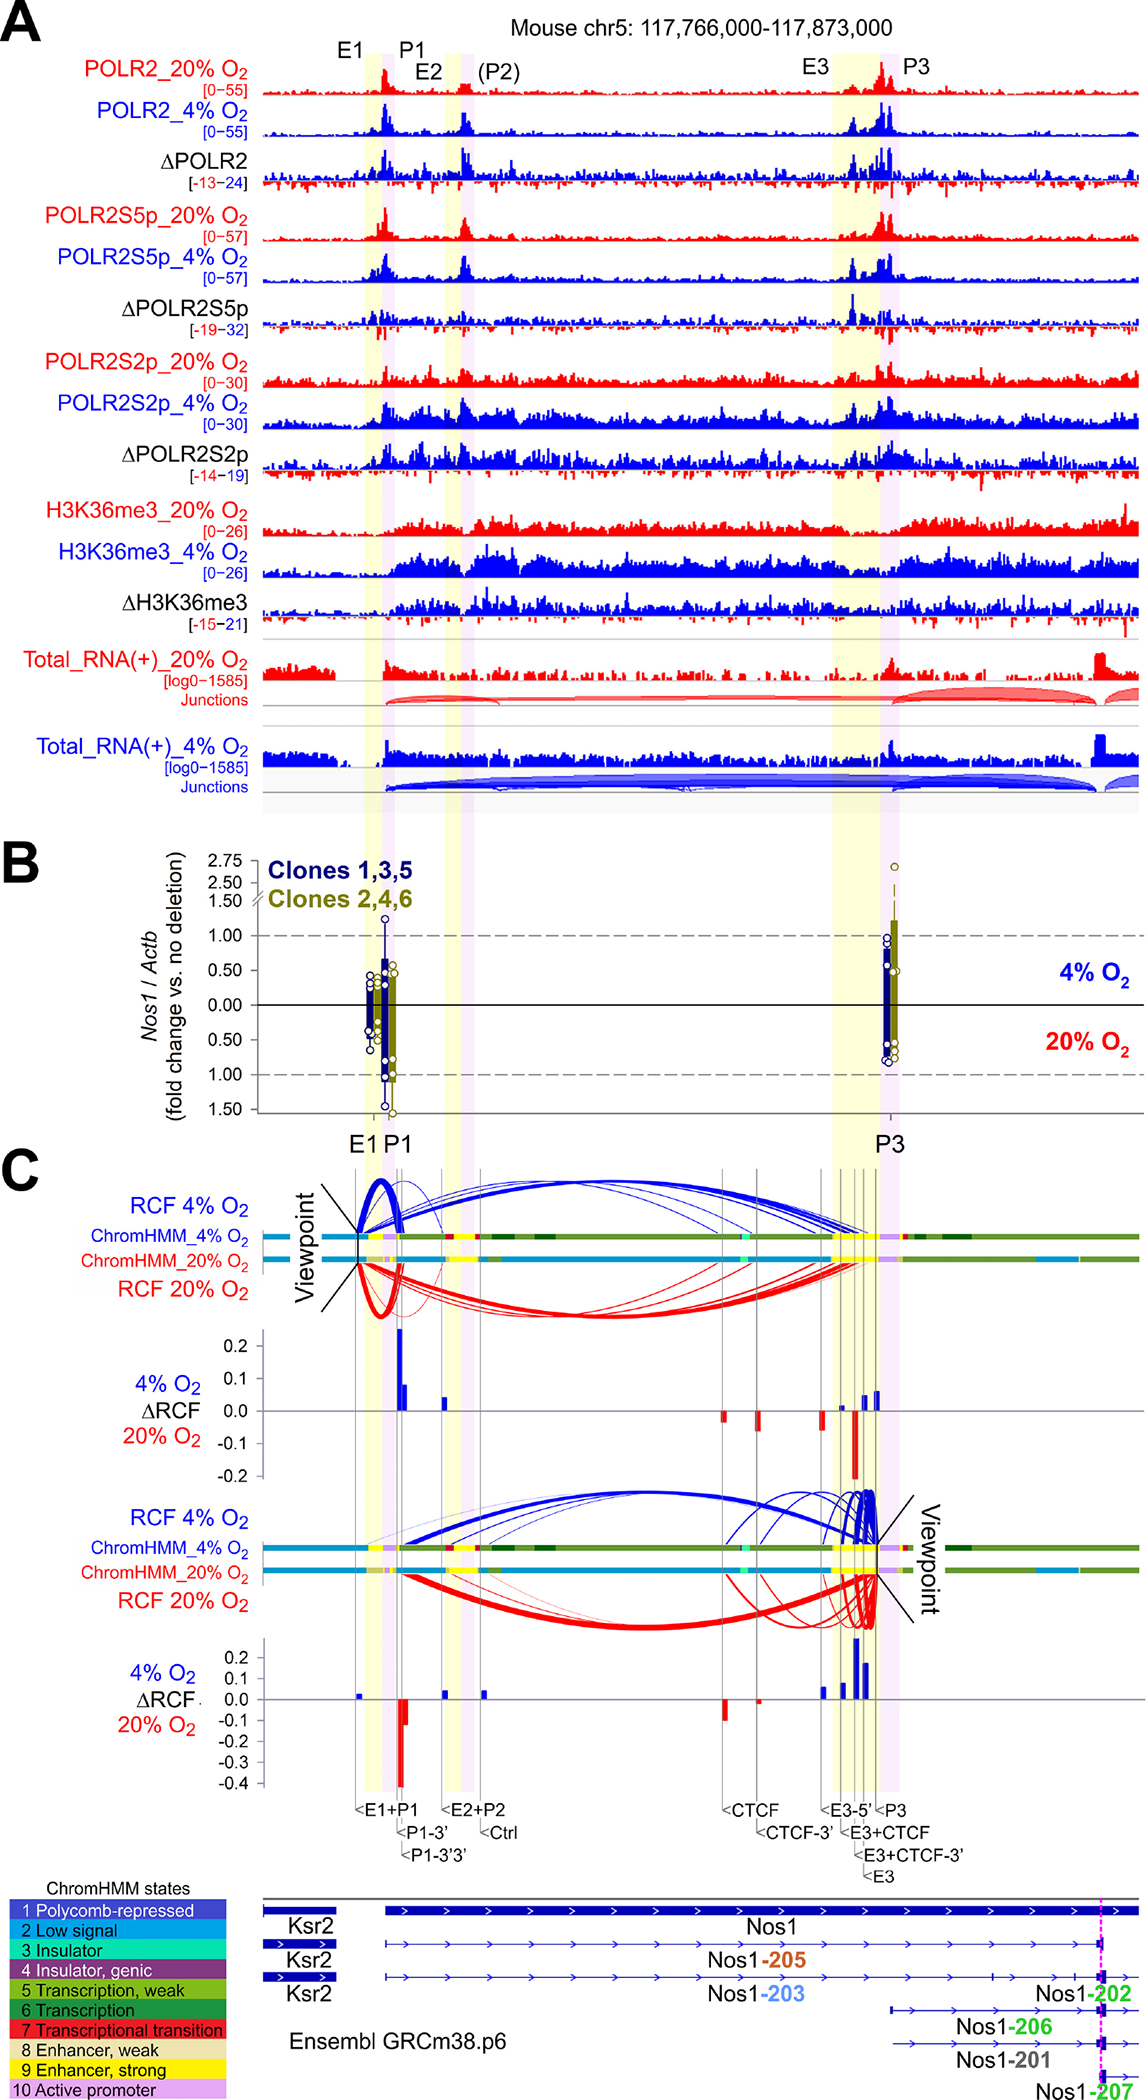
Methods: Mice with streptozotocin-induced diabetes, human and mouse tissues, NOS1+ mouse neuroblastoma cells, and isolated nitrergic neurons were studied. Gastric emptying of solids and volumes were determined by breath test and single-photon emission computed tomography, respectively. Gene expression was analyzed by RNA-sequencing, microarrays, immunoblotting, and immunofluorescence. Epigenetic assays included chromatin immunoprecipitation sequencing (13 targets), chromosome conformation capture sequencing, and reporter assays. Mechanistic studies used Cre-mediated recombination, RNA interference, and clustered regularly interspaced short palindromic repeats (CRISPR)-CRISPR-associated protein 9 (Cas9)-mediated epigenome editing.

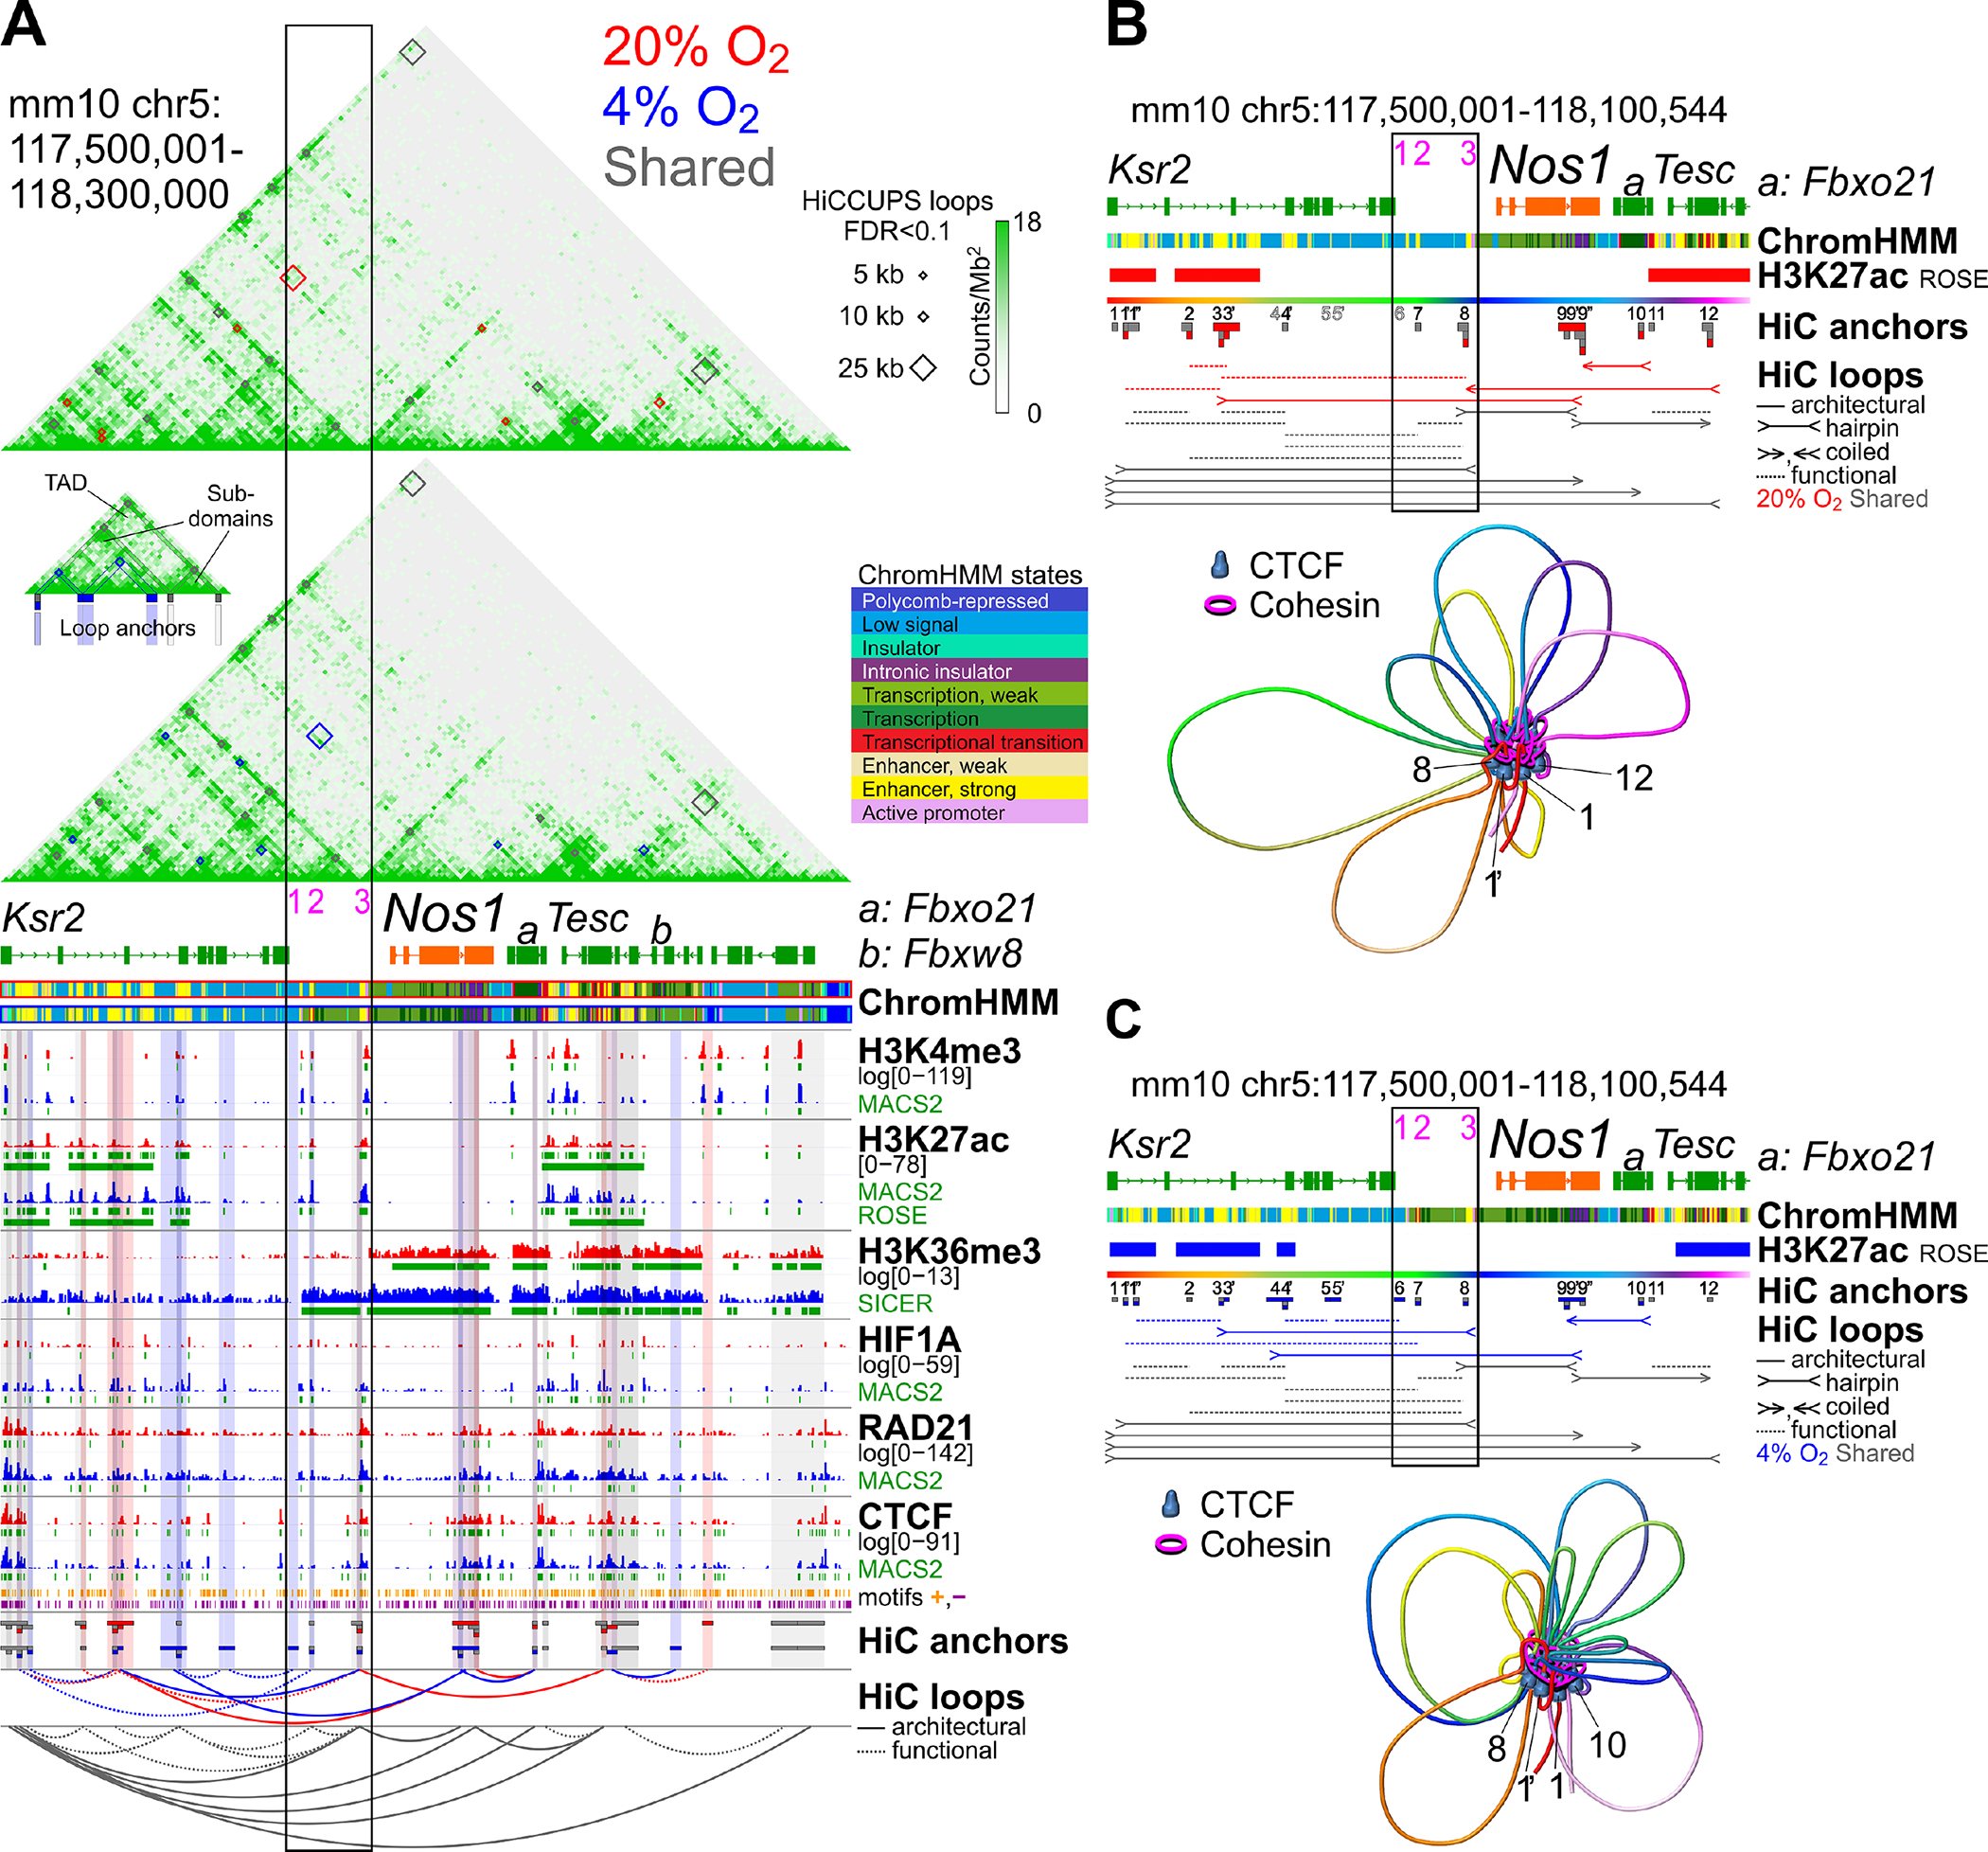
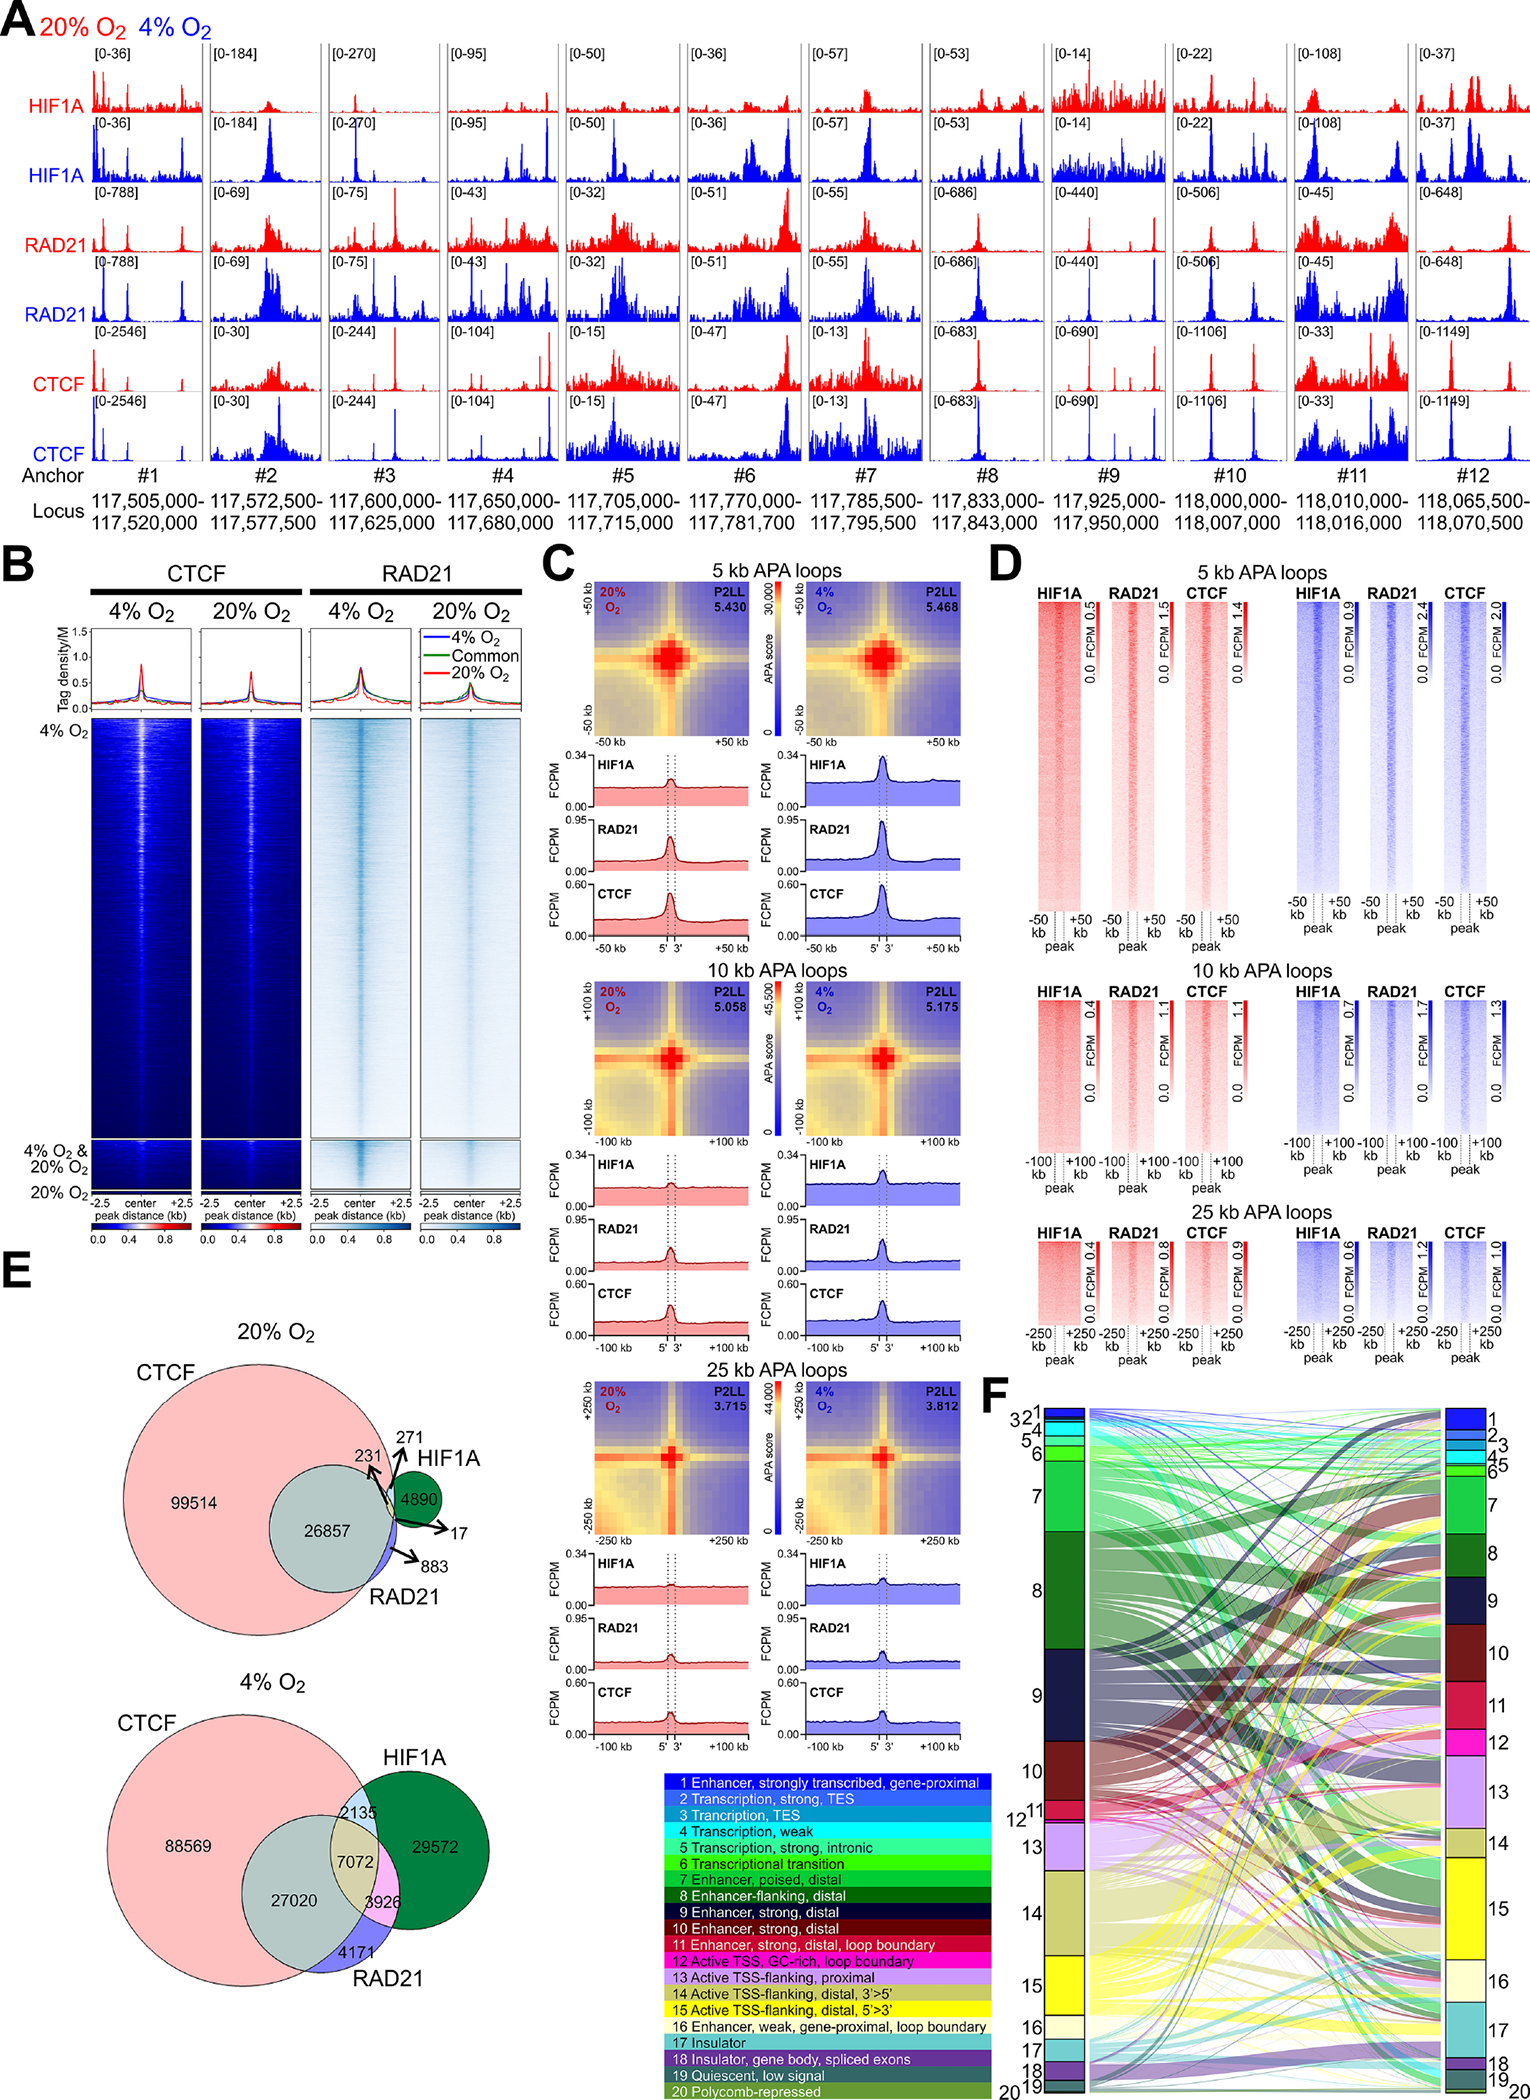
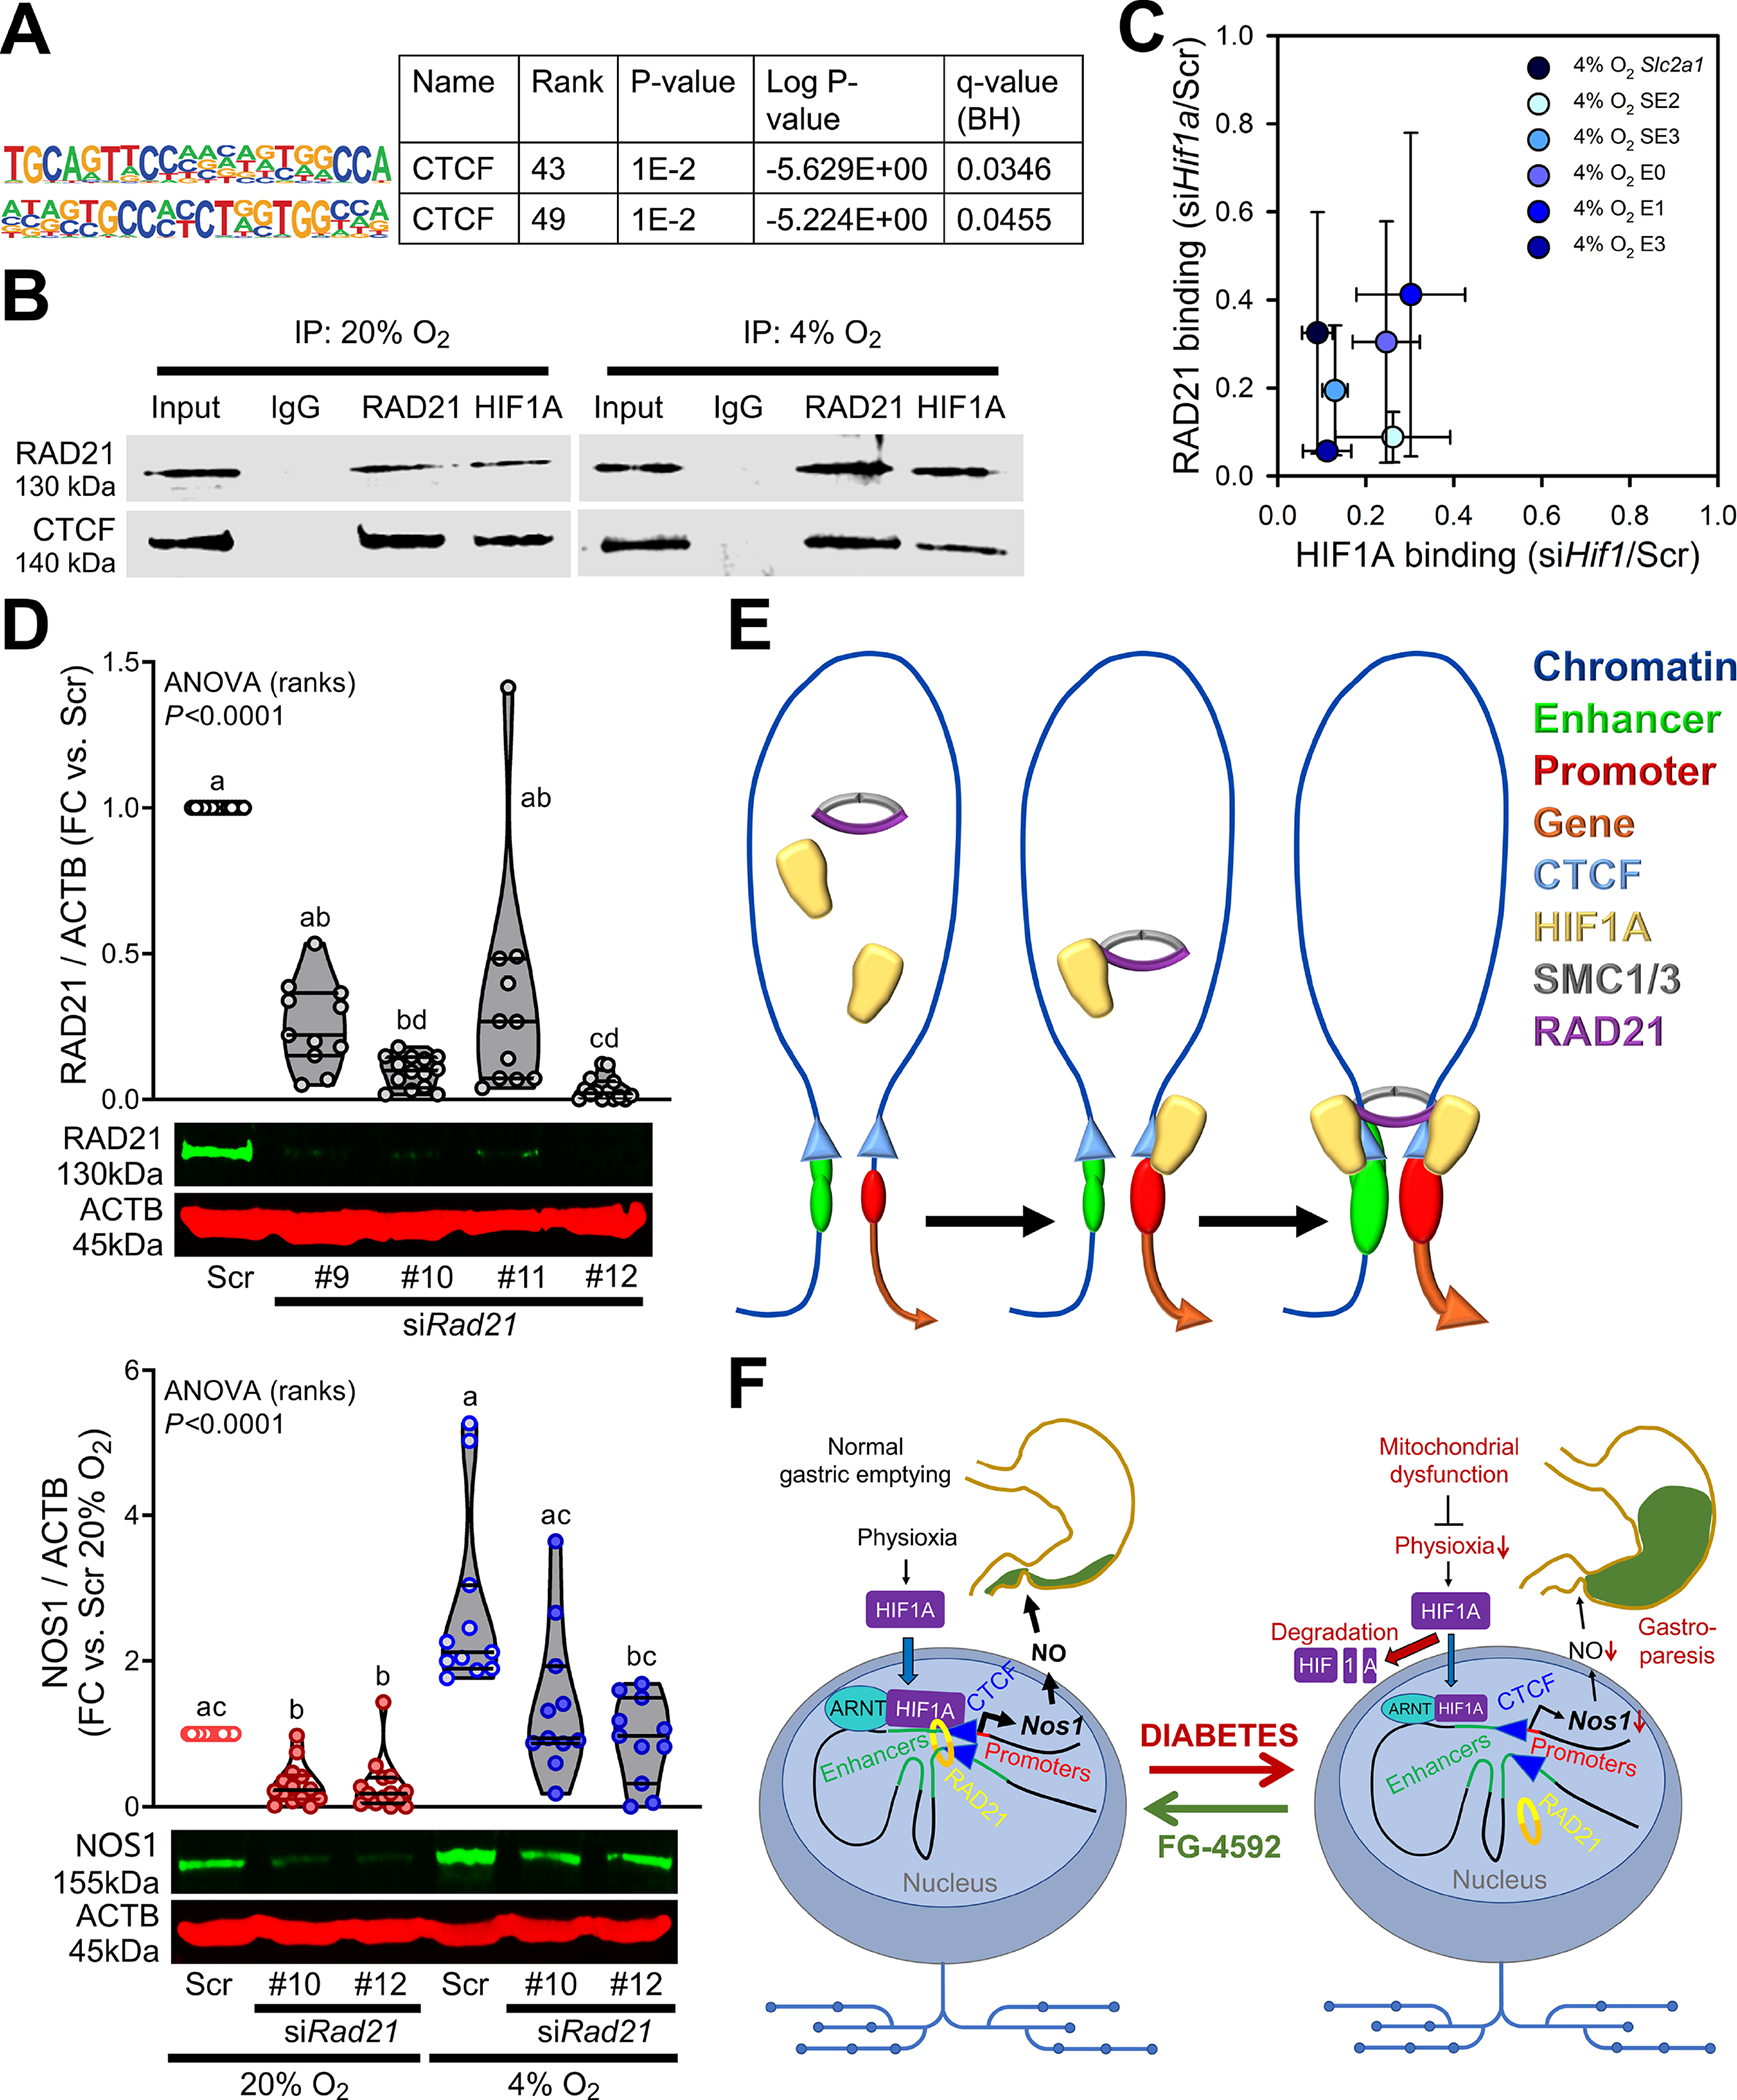
Results: HIF1A signaling from physiological intracellular hypoxia was active in mouse and human NOS1+ myenteric neurons but reduced in diabetes. Deleting Hif1a in Nos1-expressing neurons reduced NOS1 protein by 50% to 92% and delayed gastric emptying of solids in female but not male mice. Stabilizing HIF1A with roxadustat (FG-4592), which is approved for human use, restored NOS1 and reversed gastroparesis in female diabetic mice. In nitrergic neurons, HIF1A up-regulated Nos1 transcription by binding and activating proximal and distal cis-regulatory elements, including newly discovered super-enhancers, facilitating RNA polymerase loading and pause-release, and by recruiting cohesin to loop anchors to alter chromosome topology.

Conclusions: Pharmacologic HIF1A stabilization is a novel, translatable approach to restoring nitrergic signaling and treating diabetic gastroparesis. The newly recognized effects of HIF1A on chromosome topology may provide insights into physioxia- and ischemia-related organ function.

Keywords: CTCF; Hypoxyprobe; Physioxia; RAD21.


Conflict of interest statement

Disclosures: The authors disclose no conflicts.

Figures

Figure 1.
Figure 1.. HIF1A from intracellular hypoxia is required for normal NOS1 levels in enteric neurons and for normal gastric emptying in female mice and is reduced in diabetes.
(A) Pre-ranked GSEA of hypoxia-related genes in enteric neurons. (B) Wide-field images of cryosections from nondiabetic mouse stomachs (n=2) showing Hypoxyprobe (HP)+ cells. UCHL1, TUBB3, NOS1: neuronal markers. DAPI, 4’,6-diamidino-2-phenylindole. IC, interstitial cells; Muc, mucosa; CM, circular muscle; LM, longitudinal muscle; Mes, mesothelial cells. Inset: enlargement of the outlined area showing a hypoxic IC adjacent to a nerve fiber. Dotted lines: enteric ganglia. Arrowheads: hypoxic NOS1+ neurons. (C) Confocal images of cryosections from 4 nondiabetic patients showing predominantly nuclear HIF1A (antibody: Thermo Fisher 700505) in NOS1+ (arrowhead) and NOS1 (arrow) neurons. (D) Top panels: Reduction of NOS1 by genomic deletion of Hif1a in tamoxifen (Tam) vs. vehicle (Veh)-treated Nos1creERT2/+;Hif1afl/fl mice (nVeh=6, 3, 4; nTam=11, 6, 8). P, Wilcoxon signed rank tests. Bottom panels: Increase in GE t1/2 by genomic deletion of Hif1a in female mice (n=6/group). Green area: strain- and sex-specific normal range. P, ratio-paired t tests. (E) Top: Wide-field images of cryosections from 2 STZ-diabetic mouse stomachs. Note reduced HP in TUBB3+ enteric neurons (outlined area enlarged in the inset) and preserved HP in the luminal epithelium. Middle: Confocal images of cryosections from 4 diabetic patients showing reduced HIF1A (Thermo Fisher 700505) in NOS1+ (arrowhead) and NOS1 (arrow) neurons. Bottom left: Direct linear relationship between HIF1A and NOS1 immunofluorescence in nitrergic neurons of 6 nondiabetic (n=37) and 7 diabetic patients (n=55). CI95%, 95% confidence interval. P is from linear regression and Pearson correlation. Right: HIF1A immunofluorescence/cell and immunofluorescence concentration were reduced in nitrergic neurons of the diabetic (DM) vs. nondiabetic (ND) patients. P, Mann-Whitney tests.
Figure 2.
Figure 2.. HIF1A stabilization restores NOS1 and reverses diabetic gastroparesis.
(A) Top and middle: Validation of Hif1a knockdown in N1E-115 cells by HIF1A immunofluorescence and immunoblotting (HIF1A antibody: Cell Signaling Technology #36169). Top: Wide-field images from 2 experiments. Scr, scrambled. Insets are enlargements of the outlined areas. Bottom: Effects of Hif1a knockdown on 4% O2-induced upregulation of NOS1 protein (n=9). P, Kruskal-Wallis ANOVA on ranks. Groups not sharing the same superscript are different by Dunn’s test. (B) Upregulation of HIF1A (Novus Biologicals NB100–134) and NOS1 protein by HIF1A stabilization with the proteasome inhibitor MG132 (10μM, 4h) or the PHD inhibitor FG-4592 (20μM, 2 days) (HIF1A: nMG132/Veh=4, nFG-4592/Veh=6; NOS1: nMG132/Veh=5; nFG-4592/Veh=9). P, one sample t or Wilcoxon signed rank tests. NOS1 was upregulated even relative to the HIF1A target GAPDH. (C) Design of longitudinal GE study. One mouse did not develop diabetes. DRV, diabetic, resistant to GP, Veh-treated (n=6); DRD, diabetic, resistant to GP, FG-4592-treated (n=6); DDV, diabetic, delayed GE, Veh-treated (n=5); DDD, diabetic, delayed GE, FG-4592-treated (n=6). (D) Upregulation of NOS1 in GP mouse gastric corpus+antrum tunica muscularis by FG-4592 (n=3). P, Kruskal-Wallis ANOVA on ranks. Groups not sharing the same superscript are different by Tukey’s test. (E) Significant reduction of GE t1/2 from pretreatment values in GP mice treated with FG-4592 (DDD) but not in Veh-treated animals (DDV). GE t1/2 did not change significantly in the non-GP mice (DRV, DRD). Green area: strain- and sex-specific normal range. P, Wilcoxon matched-pairs signed rank tests. (F) Normalization of fasting GVs by FG-4592. P, Kruskal-Wallis ANOVA on ranks. Groups not sharing the same superscript are different by Dunn’s test.
Figure 3.
Figure 3.. Hypoxia approximating physioxia increases HIF1A and ARNT binding to cis-regulatory elements of the Nos1 locus.
(A) Correlation between differential binding (DB; FDR Q<0.1) of HIF1A and ARNT within peaks with the lowest FDR Q value among the peaks assigned to the same gene and differential gene expression (DE; P<0.05) in N1E-115 cells cultured for 3 days at 4% or 20% O2. (B) Motifs within the HIF1A and ARNT peaks assigned to KEGG mmu04066 genes. (C) Heatmaps and average tag density plots of ChIP-seq data aligned to the centers of HIF1A peaks±2.5 kb are shown for HIF1A peaks unique to cells cultured at 4% O2 (blue lines, top heatmap panels) or 20% O2 (red lines, bottom heatmap panels) or common to cells cultured at 4% or 20% O2 (green lines, middle heatmap panels). (D) Binding profiles of HIF1A, ARNT, and key histone marks in the Ensembl GRCm38.p6 Nos1 locus of N1E-115 cells cultured at 20% (red tracks) or 4% O2 (blue) for 3 days. Aggregate and subtracted (4% O2−20% O2) occupancy data from two replicates are displayed. Colored ribbons: epigenetic states discovered by ChromHMM (10-state model). Green track: H3K4me3 in FACS-isolated Nos1-mG+ enteric neurons. (E) Activities of the indicated candidate Nos1 cis-regulatory elements cloned into the pGL3-Promoter (pGL3-P; top) or the pGL3-Enhancer (pGL3-E; bottom) vectors vs. the pGL3-Basic (pGL3-B) plasmid. The E3 putative enhancer was separated into a Nos1-distal (E3d) and Nos1-proximal (E3p) fragment. P, ratio-paired t tests.
Figure 4.
Figure 4.. HIF1A controls Nos1 transcription through multiple cis-regulatory elements of the Nos1 locus.
(A) ChIP-seq and total RNA-seq (+ strand) profiles in the Ensembl GRCm38.p6 Nos1 locus of N1E-115 cells cultured at 20% O2 (red) or 4% O2 (blue) for 3 days. Aggregate data from 2 (ChIP-seq) or 3 (RNA-seq) replicates and subtracted (4% O2−20% O2) data are displayed. (B) Nos1 expression in N1E-115 cells bearing CRISPR-Cas9 deletions in E1, P1, and P3 (two clones/position, n=3 cultures/clone). Mean±SD data from cells cultured at 4% (upright) and 20% O2 (inverted) are shown. (C) Enhancer-promoter loops detected by 3C using NcoI. qPCR data from 3 experiments were expressed relative to genomic DNA representing the same locus expressed in bacterial artificial chromosome (BAC). BAC-normalized data were scaled to a range of 0–1 across the loci tested to compare data obtained at 4% O2 (upright) and 20% O2 (inverted). RCF, relative crosslinking frequency (scaled 2ΔCT vs. BAC). The colored ribbons identify epigenetic states discovered by ChromHMM using a 10-state model. Bar plots show ΔRCF values (4% O2−20% O2).
Figure 5.
Figure 5.. HIF1A binds remote super-enhancers that interact with cis-regulatory elements of the Nos1 locus in a pO2-dependent manner.
(A) Upper panel: HiC heatmaps of the TAD containing Nos1 in N1E-115 cells cultured at 20% O2 or 4% O2 for 3 days. Chromosome loops detected at 5-, 10-, and 25-b resolution are displayed as red (loops unique to 20% O2), blue (loops unique to 4% O2), and gray diamonds (loops detected at both 20% and 4% O2). Lower panel: ChromHMM and ChIP-seq tracks. Anchors and unscaled arc plots are color-coded as above. CTCF motif orientations are from ref. Solid and dashed lines: architectural and functional/transient loops, respectively. Black rectangle: cis-regulatory elements of the Ensembl Nos1 locus. (B) Upper panel: loops in N1E-115 cells cultured at 20% O2. Arrows: CTCF motif orientations permissive to architectural loop formation (convergent, left tandem, right tandem). Dashed lines without arrows: functional/transient loops. Lower panel: 3D chromatin structure of the locus inferred from the loop data. Numbered CTCF molecules correspond to the numbering of loop anchors in the upper panel. (C) Loops, and proposed chromosome conformation in N1E-115 cells cultured at 4% O2. See legend to panel B.
Figure 6.
Figure 6.. HIF1A alters chromosome topology genomewide.
(A) HIF1A, RAD21, and CTCF binding (aggregate data from 2 replicates/condition) in N1E-115 cells within 12 clusters of HiC loop anchors identified in Figure 5. (B) Heatmaps and average tag density plots of CTCF and RAD21 ChIP-seq data aligned to the centers of HIF1A peaks±2.5 kb (see in Figure 3C) are shown for HIF1A peaks unique to cells cultured at 4% O2 (blue lines, top heatmap panels) or 20% O2 (red lines, bottom heatmap panels) or common to cells maintained at 4% O2 or 20% O2 (green lines, middle heatmap panels). (C) Heatmaps of standard APA results obtained at 5-, 10-, and 25-kb resolution. P2LL, peak-to-lower-left-quadrant enrichment values. Below the APA plots, HIF1A, RAD21, and CTCF average tag density plots centered around all detected APA loop anchors are shown. Dashed vertical lines demarcate the central APA bins. (D) Heatmaps corresponding to the average tag density plots in C. (E) Venn diagrams showing overlaps of HIF1A, CTCF, and RAD21 peaks at 20% O2 and 4% O2. (F) Sankey plot showing chromatin state changes from 20% O2 (left) to 4% O2 (right) in N1E-115 cells. The colored ribbons show the relative frequencies of epigenetic states discovered by ChromHMM using a 20-state model.
Figure 7.
Figure 7.. HIF1A recruits RAD21 to CTCF-bound sites to upregulate NOS1.
(A) Enrichment of known CTCF motifs in HIF1A-bound cis-regulatory elements of the Nos1 TAD in N1E-115 cells. (B) Co-immunoprecipitation of RAD21 and CTCF with RAD21 and HIF1A. Representative immunoblots from 3 (RAD21) or 2 (CTCF) experiments. (C) Concordant reduction in HIF1A and RAD21 binding in the promoter of the canonical HIF1A target Slc2a1 gene and key HIF1A-bound SEs and enhancers of the sub-TAD containing Nos1 in HIF1A-silenced N1E-115 cells cultured at 4% O2. The loci targeted for analysis are indicated by pink bars in Supplementary Figure 10D and a pink vertical line in Supplementary Figure 7A. (D) Top: Silencing efficiencies of 4 siRNAs targeting Rad21. nScr=14, n#9=11, n#10=14, n#11=11, n#12=14. P, Kruskal-Wallis one-way ANOVA. Groups not sharing the same superscript are different by Dunn’s test. Bottom: Effects of Rad21 knockdown using the two most efficacious siRNAs on NOS1 protein in N1E-115 cells. nScr;20%=14, n#10;20%=14, n#12;20%=14, nScr;4%=11, n#10;4%=11, n#12;4%=11. P, Kruskal-Wallis one-way ANOVA. Groups not sharing the same superscript are different by Dunn’s test. (E) Schematic illustration showing the formation of architectural enhancer-promoter loops triggered by HIF1A recruitment of RAD21 to CTCF-bound sites. (F) Overview of the proposed main roles of HIF1A in gastroparesis.

References

    1. Rao M, Gershon MD. The bowel and beyond: the enteric nervous system in neurological disorders. Nat Rev Gastroenterol Hepatol 2016;13:517–528. - PMC - PubMed
    1. Rivera LR, Poole DP, Thacker M, et al. The involvement of nitric oxide synthase neurons in enteric neuropathies. Neurogastroenterol Motil 2011;23:980–988. - PubMed
    1. Watkins CC, Sawa A, Jaffrey S, et al. Insulin restores neuronal nitric oxide synthase expression and function that is lost in diabetic gastropathy. J Clin Invest 2000;106:373–384. - PMC - PubMed
    1. Anitha M, Gondha C, Sutliff R, et al. GDNF rescues hyperglycemia-induced diabetic enteric neuropathy through activation of the PI3K/Akt pathway. J Clin Invest 2006;116:344–356. - PMC - PubMed
    1. Grover M, Farrugia G, Lurken MS, et al. Cellular changes in diabetic and idiopathic gastroparesis. Gastroenterology 2011;140:1575–1585 e1578. - PMC - PubMed

Publication types