. 2023 Aug 19;14(1):5051.
doi: 10.1038/s41467-023-40776-y.

Epigenetic and molecular coordination between HDAC2 and SMAD3-SKI regulates essential brain tumour stem cell characteristics

Affiliations

Epigenetic and molecular coordination between HDAC2 and SMAD3-SKI regulates essential brain tumour stem cell characteristics

Ravinder K Bahia et al. Nat Commun. .

Abstract

Histone deacetylases are important epigenetic regulators that have been reported to play essential roles in cancer stem cell functions and are promising therapeutic targets in many cancers including glioblastoma. However, the functionally relevant roles of specific histone deacetylases, in the maintenance of key self-renewal and growth characteristics of brain tumour stem cell (BTSC) sub-populations of glioblastoma, remain to be fully resolved. Here, using pharmacological inhibition and genetic loss and gain of function approaches, we identify HDAC2 as the most relevant histone deacetylase for re-organization of chromatin accessibility resulting in maintenance of BTSC growth and self-renewal properties. Furthermore, its specific interaction with the transforming growth factor-β pathway related proteins, SMAD3 and SKI, is crucial for the maintenance of tumorigenic potential in BTSCs in vitro and in orthotopic xenograft models. Inhibition of HDAC2 activity and disruption of the coordinated mechanisms regulated by the HDAC2-SMAD3-SKI axis are thus promising therapeutic approaches for targeting BTSCs.


Conflict of interest statement

The authors declare no competing interests.

Figures
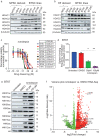
Fig. 1
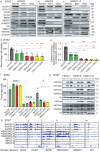
Fig. 1. HDAC1 and 2 are required for BTSC growth and stem cell characteristics by regulating associated histone modifications and transcriptional programs.
Protein levels of different classes of HDACs in BTSC cell lines (a) relative to hiPSCs and their normal NSCs and astrocyte derivatives (b) relative to normal HFs and HFAs. c Cell viability for 9 BTSC lines and HFAs from three biological replicates following 14 days treatment with HDAC1/2 specific inhibitor romidepsin (100–1000 pM) Data represent mean values ± SD, n = 3. d Sphere forming frequency of BT67 cells following 21 days treatment with 50 pM and 100 pM doses of romidepsin as assessed with limiting dilution assays. Significance was determined using ANOVA (Dunnett’s test) at 95% confidence intervals, *p < 0.05, **p < 0.01, Data represent mean ± upper and lower 95% confidence intervals, n = 3. e Acetylation levels of lysine residues of histones, H3 and H4, and crotonylation of H3 at lysine 18 in BT67 cells following 72 h treatment with romidepsin (50 pM and 100 pM) and vehicle control. f Volcano plot depicting the differential expression of transcripts associated with stem cell functions (SOX2 and OLIG2), neuronal differentiation (CNTN1, BDNF, NRXN1, SYT7, and NEFs) and a modulation of transcripts associated with the TGF-β pathway such as SMAD3, TGFB1l1, SKI, NEDD4L, BMP4, and 6 in romidepsin treated BT67 cells relative to vehicle control. Green dots denote transcripts that are significantly downregulated and red dots denote significantly upregulated transcripts in vehicle treated vs. romidepsin treated BT67 samples. *p < 0.05 for all genes. n = 3 biologically independent. Brain tumor stem cells (BTSCs), human induced pluripotent stem cells (hiPSCs), neural stem cells (NSCs), human fetal stem cells (HFs), human fetal astrocytes (HFAs)” represents molecular weight markers (50, 37, 15, and 10). Source data are provided in the source data file.
Fig. 2
Fig. 2. HDAC1/2 mediated histone deacetylations govern the transcriptional state of genes related to self-renewal, cell-fate, and TGF-β signaling in BTSCs.
a Validation of RNA-seq data confirming the changes in the protein levels of SOX2, GFAP, STX3 and BDNF, and the cell cycle regulators, CDKN1A (p21) and p38 in BT67 vehicle treated vs romidepsin treated cells for 72 h n = 3. b Western blot validation of components of TGF-β pathway including total and phospho-SMAD3, negative regulator, proto-oncogene, SKI, inhibitory SMAD protein, SMAD7 and negative regulator of SMAD3, NEDD4L. n = 3. cf Changes in the levels of the H3K27ac mark at the 5’ regulatory region of SOX2, BDNF and TGF-β pathway-related genes, SMAD3, SKI. g, h Validation of ChIP-seq data by ChIP-PCR. Significance was determined using unpaired two-tailed t-test with 95% confidence intervals, *p < 0.05, **p < 0.0048; data are represented as fold enrichment mean values ± SEM; n = 3. i, j Assessment of changes in the H4K5ac mark by ChIP-PCR at the 5’ region of SMAD3 and BDNF genes. Significance was determined using unpaired two-tailed t-test with 95% confidence intervals, *p < 0.024, **p < 0.009; data are represented as fold enrichment mean values ± SEM; n = 3). - represents molecular weight markers (50 and 37). Source data are provided in the source data file.
Fig. 3
Fig. 3. HDAC2 has more diverse roles than HDAC1 in regulating BTSC growth and specific histone modifications and transcriptional programs.
ac Validation of single and double CRISPR-cas9 mediated HDAC1/2 KOs in BT67 cells using two independent guide RNAs for each gene. AAVS1 was used as CRISPR-cas9 cut control. Western blots showing changes in protein levels of stem cell regulators; SOX2 and OLIG2, neuronal fate-specific marker; BDNF and the TGF-β pathway-related proteins including total and phospho-SMAD3, SKI, SMAD7, and NEED4L in single and double HDAC1/2 KO cells relative to the AAVS1 control cells. d Effect of single and double HDAC1/2 KOs on the cell viability of BT67 cells relative to AAVS1 control cells. Significance was determined using ANOVA (Tukey’s test) at 95% confidence intervals, *p < 0.05, **p < 0.0021, ***p < 0.0009; data are represented as mean values ± SEM, (n = 3, with two independent gRNAs. e Sphere forming frequency of BT67 cells following single and double knockout of HDAC1 and 2 in BT67 cells relative to AAVS1 cut control. Significance was determined using ANOVA (Tukey’s test) at 95% confidence intervals, *p < 0.05, **p < 0.01, ***p < 0.001, ****p < 0.000; Data represent mean ± upper and lower 95% confidence intervals, n = 3. f EdU assays showing the effect of single and double HDAC1/2 KOs on different phases of cell cycle. Significance was determined using ANOVA (Dunnett’s test) at 95% confidence intervals, *p < 0.048, **p < 0.009; data are represented as mean values ± SEM; n = 3 Gating strategies are provided in Supp. Fig. 22a. g Changes in global acetylation levels of lysine residues of histones H3 and H4 and H3 lysine 18 crotonylation following single and double HDAC1/2 KO in BT67 cells (n = 3). hm Changes in the H4K5ac domains at 5’ regulatory regions of stem cell, cell-fate specific and the TGF-β pathway-related genes in HDAC2 KO BTSCs relative to AAVS1 control cells. - represents molecular weight markers (50, 15, and 10). Source data are provided in the source data file.
Fig. 4
Fig. 4. HDAC2 interacts with the TGF-β related proteins, SMAD3-SKI in BTSCs.
a Kaplan–Meier survival curves for mice orthotopically xenografted with single and double HDAC1/2 KO BT67 cells compared to AAVS1 control mice (Log-rank (Mantel–Cox) method, **p < 0.01, ****p < 0.0001, n = 10). b Kaplan–Meier survival curves for mice orthotopically xenografted with HDAC2 KD BT147 cells compared to mice xenografted with their respective scrambled control cells (Log-rank (Mantel–Cox) method, ****p < 0.0002, n = 10). cf Co-immunoprecipitation and sequential co-IP assays in dual crosslinked BT67 cells. (n = 3). g In situ proximity ligation assays (PLA) confirm protein-protein interactions between HDAC2 and the SMAD3-SKI complex which was disrupted following 24 h treatment with romidepsin relative to DMSO control in BTSCs. Quantitative representation of the average number of PLA foci counted in 30 nuclei/reaction in BT67. Significance was determined using ANOVA (Tukey’s test) at 95% confidence intervals, **p < 0.01, ***p < 0.001; Data are represented as mean values ± SEM; n = 3. HDAC1/2 protein-protein interaction was used as positive control and PLA probe only and IgG only were used as negative controls for the assay. h, i Co-IP assays in dual crosslinked HEK293T/17 cells expressing different SMAD3 (SMAD3, SMAD3NL, SMAD3C and SMAD3ΔC) and HDAC2(HDAC2N and HDAC2C) mutants or empty vector (n = 3 biologically independent transductions). Input: 1% input was used for all the co-IP assays. IP-immunoprecipitation, ID-immunodepleted samples, IgG- antibody controls for non-specific pull down. - represents molecular weight markers (50 and 150). Source data are provided in the source data file.
Fig. 5
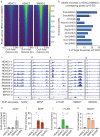
Fig. 5. HDAC2 and SMAD3 coregulate stemness and cell-fate programs and the TGF-β pathway-related genes in BTSCs.
a ChIP-sequencing evaluating the common target genes regulated by the HDAC1/2 and SMAD3 complex in BT67 cells. n = 3. b Motif enrichment analysis of HDAC2 and SMAD3 overlapping peaks. *p < 0.05 for all enriched motifs. cg Enrichment levels of HDAC1/2 and SMAD3 within the gene regions of SOX2, BDNF, L1CAM, SMAD7, and NEDD4L. hk Validation of ChIP-seq data by ChIP-qPCR. Significance was determined using unpaired two-tailed t-test 95% confidence intervals, data are represented as fold enrichment mean values ± SEM; *p < 0.039, *p < 0.03 and p < 0.021, ***p < 0.00039 and *p < 0.019, n = 3). Fold enrichment of HDAC2 and SMAD3 within the heterochromatin region QML5/6 was used as negative control for ChIP-qPCR. Source data are provided in the source data file.
Fig. 6
Fig. 6. HDAC2 and SMAD3 co-regulate self-renewal versus cell-fate specification potentials of BTSCs.
a Constitutive overexpression of SMAD3 in HDAC2 knockout and AAVS1 control BT67 cells. Empty control vector was used as a negative control. Western blot analysis of protein levels of SOX2, GFAP, BDNF and SKI in HDAC2-/Neg+ vs. HDAC2-/SMAD3+ cells (n = 3). b Sphere forming frequency measured following SMAD3 overexpression in HDAC2 KO and AAVS1 control BT67 cells. Significance was determined using ANOVA (Tukey’s test) at 95% confidence intervals, ***p < 0.001, *p < 0.05, Data represent mean ± upper and lower 95% confidence intervals, n = 3). c Analysis of cell cycle changes in AAVS1 control, HDAC2-/Neg+, HDAC2-/SMAD3+, AAVS1/SMAD3+ BT67 cells. Significance was determined using ANOVA (Tukey’s test) at 95% confidence intervals, *p < 0.05, **p < 0.01; data are represented as mean values ± SEM; n = 3). Gating strategies are provided in Supp. Fig. 22a. d Co-IP assays in dual crosslinked AAVS1 control, HDAC2/Neg+, HDAC2/SMAD3+, AAVS1/SMAD3+ BT67 cells (n = 3). e Kaplan–Meier survival curves for mice orthotopically xenografted with HDAC2-/SMAD3+ BT67 cells relative to the mice xenografted with HDAC2-/neg+ BT67 cells. (Log-rank (Mantel–Cox) method, **p < 0.0026, ***p < 0.0002, n = 8). - represents molecular weight markers (50, 37, and 25). Source data are provided in the source data file.
Fig. 7
Fig. 7. Specific inhibition of HDAC2 or SMAD3 impacts BTSC stemness.
a Western blot validation of CRISPR-cas9 mediated KO of SMAD3 and its effect on HDAC2, SOX2, OLIG2, SKI, NEDD4L, and BDNF protein levels in BTSCs relative to AAVS1 control cells. b Changes in global H3K27ac and H4K5ac following SMAD3 KO in BT67 cells (n = 3). c Co-IP assay in dual crosslinked AAVS1 control and SMAD3 KO BT67 cells (n = 3). d Sphere forming frequency measured following SMAD3 KO in BT67 cells relative to AAVS1 control cells. Significance was determined using unpaired two-tailed t-test, ***p < 0.001; Data represent mean ± upper and lower 95% confidence intervals, n = 3. e Kaplan–Meier survival curves for mice orthotopically xenografted with SMAD3 KO BT67 cells compared to AAVS1 control mice (Log-rank (Mantel–Cox) method, ****p < 0.0001, n = 10). f Cell viability for 9 BTSC lines and HFAs from three biological replicates following treatment with HDAC2 specific inhibitor Santacruzamate A (100–1000 nM) Data represent mean values ± SD, n = 3. g Acetylation levels of lysine residues of histones, H3 and H4, and crotonylation of H3 at lysine 18 in BT67 cells following treatment with Santacruzamate A (100 nM) and vehicle control for 72 h (n = 3). h, i Western blots showing changes in protein levels of SOX2 and OLIG2, neuronal fate-specific marker; BDNF, the TGF-β pathway-related proteins; total and phospho-SMAD3, SKI, and NEED4L and the cell cycle proteins; p53, p21 (h, i) and E2F1 (i) following 72 h treatment with Santacruzamate A (100 nM) and vehicle control (n = 3). - represents molecular weight markers (50, 37, 15, and 10). Source data are provided in the source data file.
Fig. 8
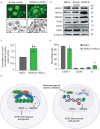
Fig. 8. HDAC2 Overexpression results in increased growth and self-renewal in normal NSCs.
a Overexpression (OE) of HDAC2 in hiPSCs derived SOX2+/nestin+ NSCs Scale bar: 100 μm. b Protein levels of stem cell and differentiation markers. c Cumulative cell counts 5 days after seeding cells at clonal density of (5–10 cells/μl) in neurosphere culture conditions. Significance was determined using unpaired two-tailed t-test, **p < 0.0048; data are represented as mean values ± SEM; n = 3. d An EdU analysis showing the changes in cell cycle progression in HDAC2+ NSCs compared to empty vector control cells. Significance was determined using unpaired two-tailed t-test, *p < 0.023, **p < 0.003; data are represented as mean values ± SEM; n = 3. Gating strategies are provided in Supp. Fig. 22a. e Schematic model representing HDAC2-mediated epigenetic modulation of the transcriptional activity and expression of SMAD3-SKI proteins critical for the maintenance of BTSC stemness and tumorigenic potentials. - represents molecular weight markers (50 and 37). The model figure was generated using Biorender. Source data are provided in the source data file.

References

    1. Lee P, et al. Mechanisms and clinical significance of histone deacetylase inhibitors: epigenetic glioblastoma therapy. Anticancer Res. 2015;35:615–625. - PMC - PubMed
    1. Liau B, et al. Adaptive chromatin remodeling drives glioblastoma stem cell plasticity and drug tolerance. Cell Stem Cell. 2017;20:233–246. - PMC - PubMed
    1. Liu F, et al. EGFR mutation promotes glioblastoma through epigenome and transcription factor network remodeling. Mol. Cell. 2015;60:307–318. - PMC - PubMed
    1. Macleod G, et al. Genome-wide CRISPR-Cas9 screens expose genetic vulnerabilities and mechanisms of temozolomide sensitivity in glioblastoma stem cells. Cell Rep. 2019;27:971–986. - PubMed
    1. Nguyen SA, et al. Novel MSH6 mutations in treatment-naive glioblastoma and anaplastic oligodendroglioma contribute to temozolomide resistance independently of MGMT promoter methylation. Clin. Cancer Res. 2014;20:4894–4903. - PubMed

Publication types