. 2023 Aug 19;3(1):113.
doi: 10.1038/s43856-023-00344-3.

Noninvasive and reliable automated detection of spreading depolarization in severe traumatic brain injury using scalp EEG

Affiliations

Noninvasive and reliable automated detection of spreading depolarization in severe traumatic brain injury using scalp EEG

Alireza Chamanzar et al. Commun Med (Lond). .

Abstract

Background: Spreading depolarizations (SDs) are a biomarker and a potentially treatable mechanism of worsening brain injury after traumatic brain injury (TBI). Noninvasive detection of SDs could transform critical care for brain injury patients but has remained elusive. Current methods to detect SDs are based on invasive intracranial recordings with limited spatial coverage. In this study, we establish the feasibility of automated SD detection through noninvasive scalp electroencephalography (EEG) for patients with severe TBI.

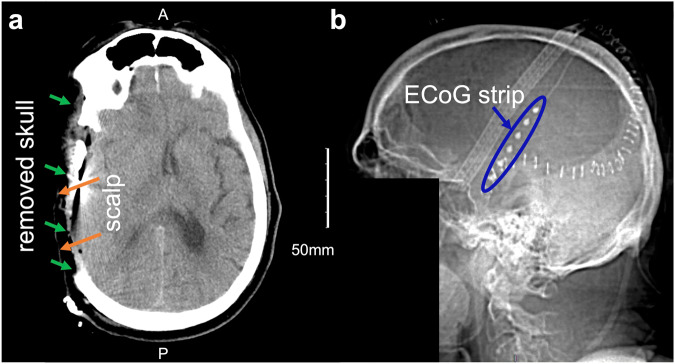
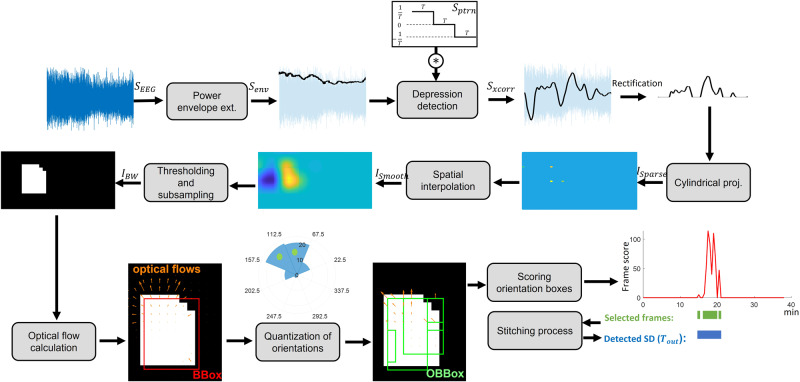
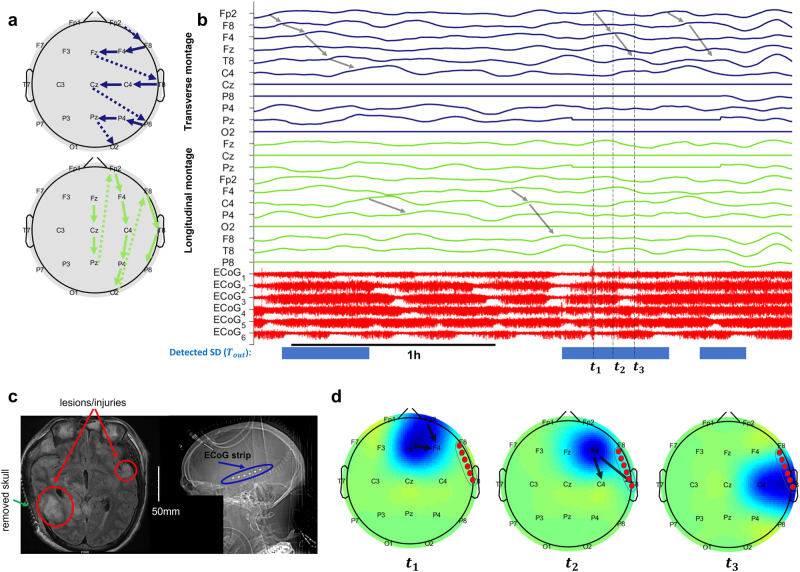
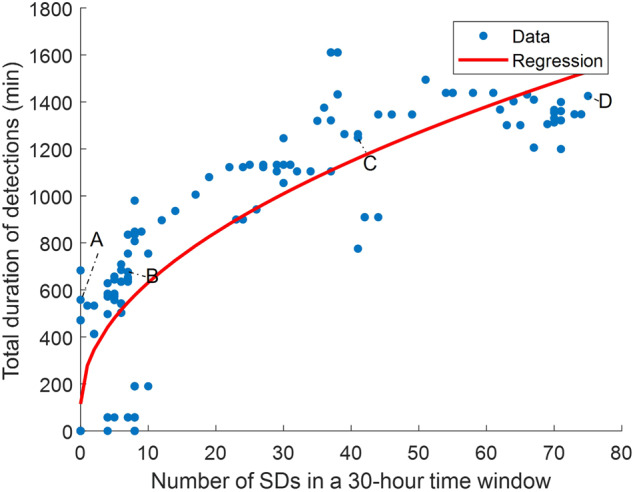
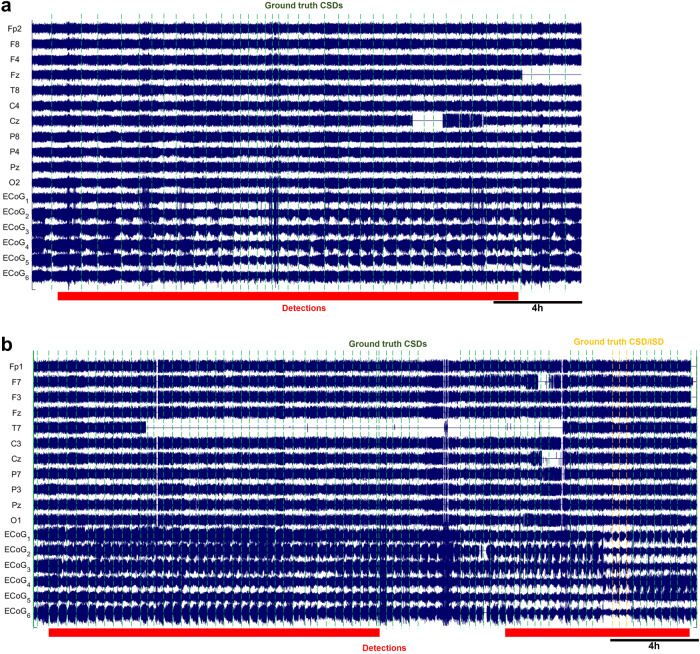
Methods: Building on our recent WAVEFRONT algorithm, we designed an automated SD detection method. This algorithm, with learnable parameters and improved velocity estimation, extracts and tracks propagating power depressions using low-density EEG. The dataset for testing our algorithm contains 700 total SDs in 12 severe TBI patients who underwent decompressive hemicraniectomy (DHC), labeled using ground-truth intracranial EEG recordings. We utilize simultaneously recorded, continuous, low-density (19 electrodes) scalp EEG signals, to quantify the detection accuracy of WAVEFRONT in terms of true positive rate (TPR), false positive rate (FPR), as well as the accuracy of estimating SD frequency.

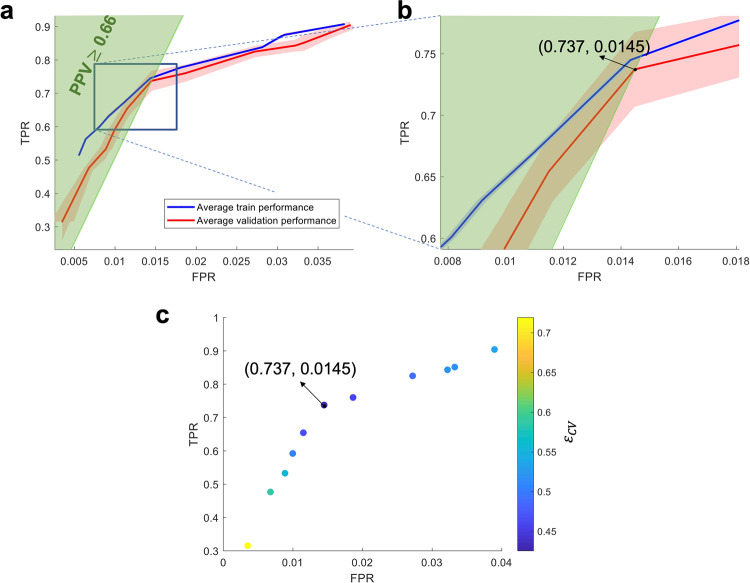
Results: WAVEFRONT achieves the best average validation accuracy using Delta band EEG: 74% TPR with less than 1.5% FPR. Further, preliminary evidence suggests WAVEFRONT can estimate how frequently SDs may occur.

Conclusions: We establish the feasibility, and quantify the performance, of noninvasive SD detection after severe TBI using an automated algorithm. The algorithm, WAVEFRONT, can also potentially be used for diagnosis, monitoring, and tailoring treatments for worsening brain injury. Extension of these results to patients with intact skulls requires further study.

Plain language summary

Physical injury to the brain, for example due to head trauma, may worsen over time, resulting in long-term disability or death. A spreading depolarization is a slowly spreading wave in the brain, which, if detected, can be used to predict worsening brain injuries. Current methods to detect spreading depolarizations require surgeries, which are risky and unlikely to be recommended to patients with mild brain injuries. In this work, we develop an automated monitoring technique for non-surgical, non-invasive detection of spreading depolarizations, called WAVEFRONT. We validated the performance of WAVEFRONT in 12 patients with severe brain injury. Our results demonstrate the feasibility of non-invasive detection of spreading depolarizations. Our approach can potentially help clinicians predict outcomes of brain injury patients, and tailor treatments accordingly.


Conflict of interest statement

The authors declare the following competing interests: the authors filed a provisional patent on the technology, assigned to Carnegie Mellon University. P.G. is co-founder of Precision Neuroscopics Inc., a medical device company that intends to license the resulting patent from Carnegie Mellon University, and A.C. has equity in this company. All other authors declare no competing interests.

Figures

Fig. 1
Fig. 1. CT scan of a severe TBI patient with right DHC.
Transverse (a) and right side (b) view of computed tomography (CT) scans of a severe traumatic brain injury (TBI) patient (patient 6, see Table 1) with right decompressive hemicraniectomy (DHC). The missing portion of the skull (marked with green arrows), the scalp layer on the DHC site (marked with orange arrows), and the strip of six electrocorticography (ECoG) electrodes are also marked. The facial region is stripped away to ensure the anonymity of the patient.
Fig. 2
Fig. 2. EEG baseline power in a patient with right DHC.
Electroencephalography (EEG) baseline power in ipsilateral (with missing skull) and contralateral (with intact skull) hemispheres in a patient (patient 4, see Table 1 for details) with right decompressive hemicraniectomy (DHC): a 11 ipsilateral EEG electrodes are marked with red dashed line, and eight contralateral electrodes are marked with blue dashed line and b 3 h of the EEG recording across ipsilateral (red traces) and contralateral (blue traces) electrodes. Most of the ipsilateral electrodes on top of the DHC region (with missing skull) had higher EEG baseline power (e.g., Fp2, F8, F4, T8, C4, and P8), in comparison with the contralateral electrodes on the regions with intact skull. The EEG signals were band-pass filtered in [0.5, 30] Hz and preprocessed (before amplitude outlier removal, see Supplementary Note 1 for more information). The signal at Cz had poor quality and was removed through the preprocessing steps.
Fig. 3
Fig. 3. Main steps of the WAVEFRONT algorithm.
The power envelope of the preprocessed electroencephalography (EEG) signals (SEEG) was extracted, and cross-correlated with a first-derivative kernel (SPtrn) to extract power depressions as large positive peaks in SXcorr, which were rectified and projected on a 2D plane through a cylindrical projection. The resulting image (ISparse) was then spatially interpolated, thresholded, and subsampled to obtain binary images (IBW), where the depression wavefronts were captured as white contiguous pixels. The movement of wavefronts in these binary images was estimated using optical flows. Dominant directions of propagation (marked bins in the orientation histogram) were found through quantization of orientations and scored based on the consistency and speed of propagation of wavefronts. Candidate frames were selected based on the calculated scores and stitched together for the final detection output (Tout).
Fig. 4
Fig. 4. WAVEFRONT performance evaluation using a cross-validation analysis.
a Receiver operating characteristic (ROC) curves of the average train (solid blue curve) and validation (solid red curve) performance of WAVEFRONT in the detection of spreading depolarization (SD) events, using noninvasive scalp electroencephalography (EEG) signals in the Delta frequency band. The shaded blue and red regions show the 95% confidence intervals for the average train and validation curves, respectively. The vertical axis indicates true positive rates (TPRs), and the horizontal axis shows false positive rates (FPRs). The green highlighted region indicates the positive predictive values of ≥0.66 (PPV), b Zoomed-in version of the ROC curves around the optimal validation operating point (TPR = 0.74 ± 0.03, and FPR = 0.0145 ± 7.57 × 10−4; in 95% confidence intervals), c Cross-validation error (ϵCV), color-coded across different points in the validation ROC curve, where the point with the minimum error (i.e., optimal operating point) is marked.
Fig. 5
Fig. 5. Visualization of a sample SD event in patient 4 with clustered SD events.
a transverse and longitudinal montages of ipsilateral electroencephalography (EEG) electrodes. These montages order the electrodes so the signals of anatomically neighboring electrodes are located next to each other in the temporal plots. b Time traces of SXcorr and electrocorticography (ECoG) signals, where three time-points of the selected spreading depolarization (SD) event are marked as t1, t2, and t3 with maximum depressions (peak in SXcorr) at (Fp2, Fz), F4, and (C4, T8) respectively. c Magnetic resonance imaging (MRI, on the left) and computed tomography (CT, on the right) scans of this patient, where the locations of lesions and injuries are shown, along with the right decompressive hemicraniectomy (DHC) region and the intracranial strip of ECoG electrodes. d Scalp topography of SD depressions at the three corresponding timepoints. The intracranial ECoG strip is located around the right frontotemporal lobe. The detected events (Tout = 1) using WAVEFRONT are marked with blue strips in (b), where the under-detection of WAVEFRONT is apparent, along with some missed detection intervals. A total of five SD events are detected in EEG; eight are marked in the ECoG signals. Some of the propagating depressions in (b) are marked with gray arrows across the SXcorr signals, which correspond to the SD events in this time window.
Fig. 6
Fig. 6. WAVEFRONT performance evaluation across different scalp EEG frequency bands.
a Receiver operating characteristic (ROC) curves of the average validation performance of WAVEFRONT in the detection of spreading depolarization (SD) events using noninvasive scalp electroencephalography (EEG) signals across different frequency ranges: [0.001, 0.01]Hz (near-DC, yellow curve), [0.5, 4]Hz (Delta, red curve), [4, 8]Hz (Theta, pink curve), [8, 12]Hz (Alpha, green curve), and [12, 30]Hz (Beta, cyan curve). The vertical axis indicates true positive rates (TPRs), and the horizontal axis shows false positive rates (FPRs). The black line indicates the positive predictive value of 0.50 (PPV), and the region above this line shows the operating points with PPV≥0.50, b Zoomed-in version of the ROC curves around the optimal validation operating points across different frequency bands. The best SD detection performance corresponds to the Delta band, followed by the Theta, Alpha, near-DC, and Beta bands.
Fig. 7
Fig. 7. Performance of WAVEFRONT in prediction of SD frequency.
Each blue dot shows the total duration of detected spreading depolarization (SD) events using WAVEFRONT in 30-hour time windows after pruning small, isolated detection events and stitching together the remaining detection events. The expected increased trend of total detection duration as a function of the number of SD events was observed, with piecewise flat parts around 22–37, and 54–75 SDs, which are the clustering detection side effects in these time intervals. A square root regression model (red curve) was fitted and used to quantify the prediction performance (R2 ≃ 0.71). Detected intervals in windows with a small (point A and B), medium (point C), and large (Point D) number of SDs are shown in Figs. 8 and 9.
Fig. 8
Fig. 8. Detected SD intervals in time windows with small number of SDs.
Detection intervals (marked with red strips on the bottom) along with the ground truth annotated spreading depolarizations (SDs, dashed vertical lines) in long time windows, where the preprocessed ipsilateral electroencephalography (EEG) signals and electrocorticography (ECoG) signals are shown. EEG electrodes were ordered using the transverse montage (see Fig. 5a). Signals were normalized by their standard deviations for the illustrative purposes: a a 26.6-hour time window, corresponding to point A in Fig. 7, with no SD event in patient 7. However, there are large false alarm detection intervals with a total duration of 558 min, which may be explained by the poor quality of the EEG recording in this time window. b a 30-hour time window with seven SDs (two cortical spreading depressions (CSDs) and seven single-channel CSDs (scCSDs)), which corresponds to point B in the regression figure, and recorded from patient 6. WAVEFRONT successfully detects the the isolated CSD event as well as the clustered SD events toward the end of the window, with a total detection duration of 676min.
Fig. 9
Fig. 9. Detected SD intervals in time windows with large number of SDs.
Detection intervals (marked with red strips on the bottom) along with the ground truth annotated spreading depolarizations (SDs, dashed vertical lines) in long time windows, where the preprocessed ipsilateral electroencephalography (EEG) signals and electrocorticography (ECoG) signals are shown. EEG electrodes were ordered using the transverse montage (see Fig. 5a). Signals were normalized by their standard deviations for the illustrative purposes: a A 24.84-hour time window with 41 highly clustered SDs (point C in Fig. 7) in patient 3. b A 30-hour time window with the largest number of SD events, 75 (point D in Fig. 7), in patient 12. WAVEFRONT detects long intervals in (a) and (b), with the total duration of 1248 min and 1425 min.

References

    1. Somjen, G. G.Ions in the brain: normal function, seizures, and stroke (Oxford University Press, 2004).
    1. Zandt B, ten Haken B, van Putten MJ, Dahlem MA. How does spreading depression spread? physiology and modeling. Rev. Neurosci. 2015;26:183–198. doi: 10.1515/revneuro-2014-0069. - DOI - PubMed
    1. Dreier JP, et al. Delayed ischaemic neurological deficits after subarachnoid haemorrhage are associated with clusters of spreading depolarizations. Brain. 2006;129:3224–3237. doi: 10.1093/brain/awl297. - DOI - PubMed
    1. Dreier JP. The role of spreading depression, spreading depolarization and spreading ischemia in neurological disease. Nat. Med. 2011;17:439–447. doi: 10.1038/nm.2333. - DOI - PubMed
    1. Lauritzen M, et al. Clinical relevance of cortical spreading depression in neurological disorders: migraine, malignant stroke, subarachnoid and intracranial hemorrhage, and traumatic brain injury. J. Cereb. Blood Flow Metab. 2011;31:17–35. doi: 10.1038/jcbfm.2010.191. - DOI - PMC - PubMed