. 2023 Aug 19;6(1):152.
doi: 10.1038/s41746-023-00901-z.

Predicting HPV association using deep learning and regular H&E stains allows granular stratification of oropharyngeal cancer patients

Affiliations

Predicting HPV association using deep learning and regular H&E stains allows granular stratification of oropharyngeal cancer patients

Sebastian Klein et al. NPJ Digit Med. .

Abstract

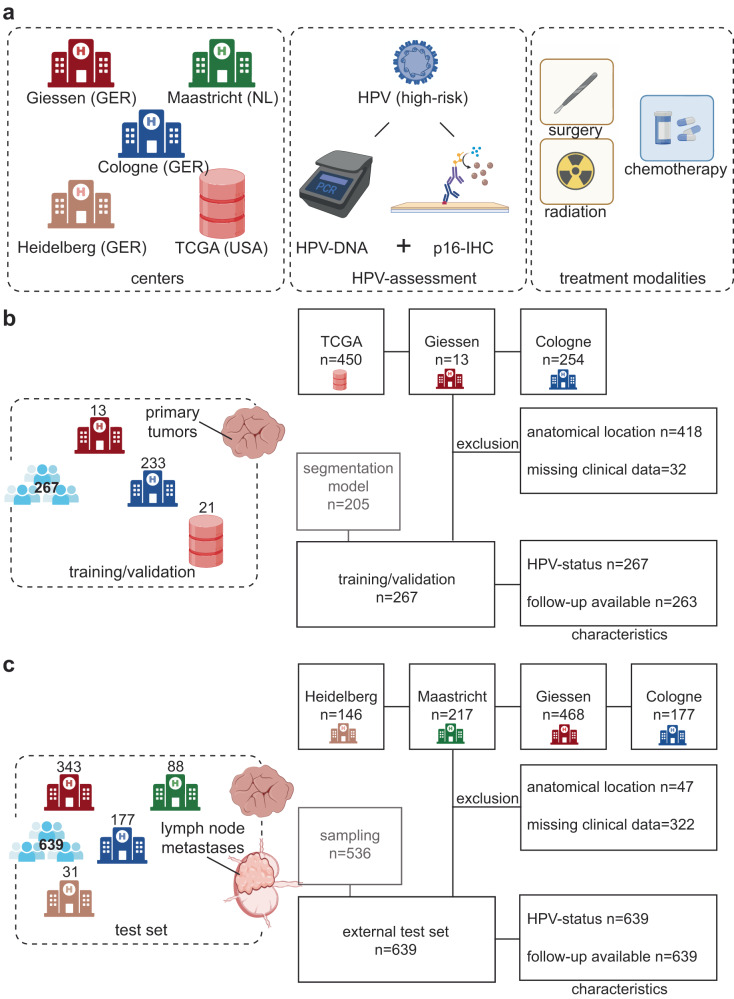
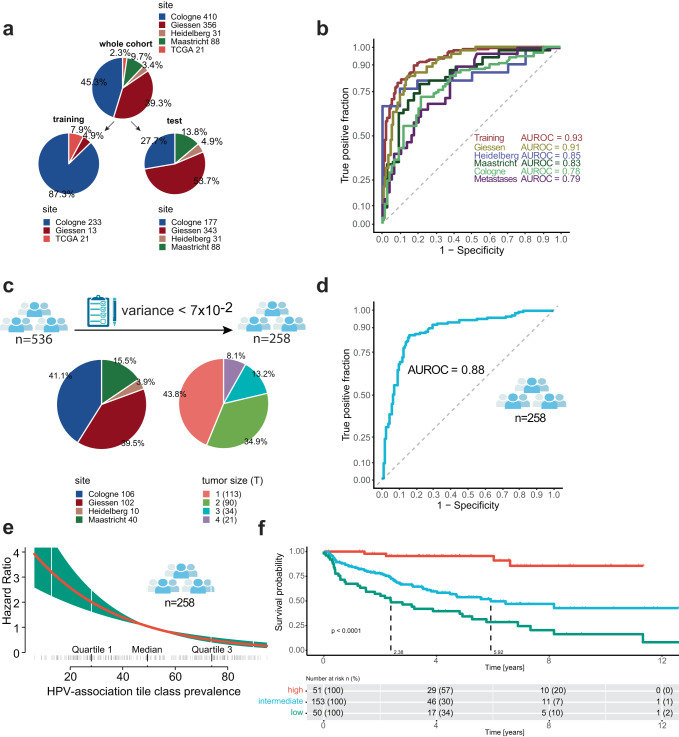
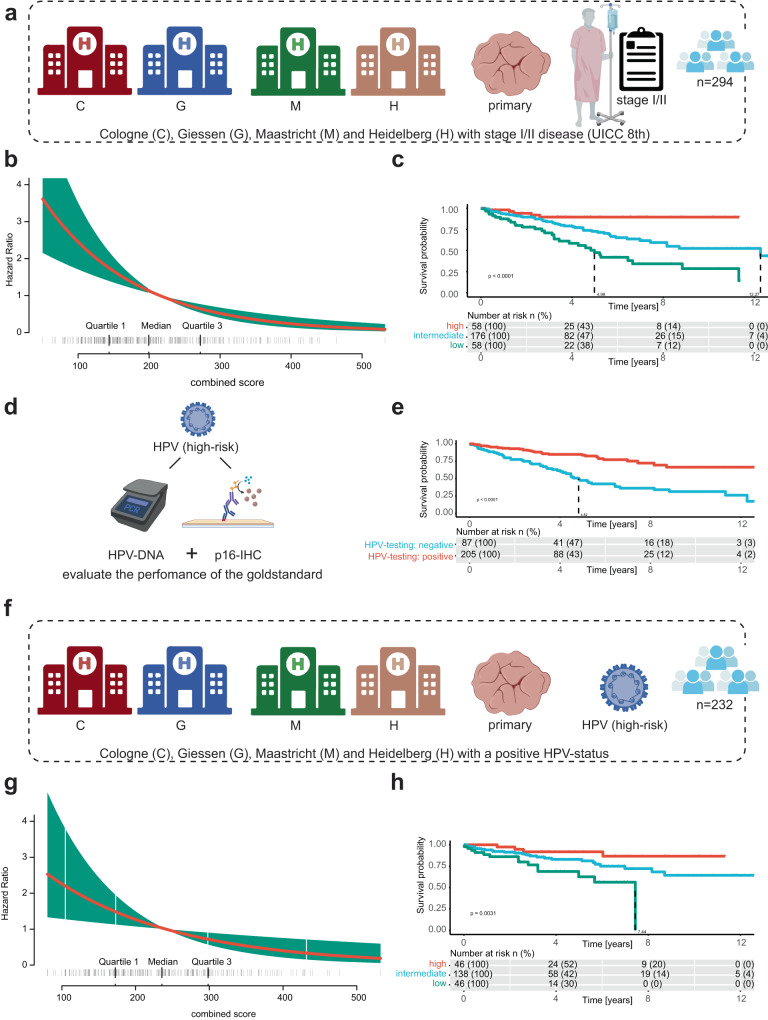
Human Papilloma Virus (HPV)-associated oropharyngeal squamous cell cancer (OPSCC) represents an OPSCC subgroup with an overall good prognosis with a rising incidence in Western countries. Multiple lines of evidence suggest that HPV-associated tumors are not a homogeneous tumor entity, underlining the need for accurate prognostic biomarkers. In this retrospective, multi-institutional study involving 906 patients from four centers and one database, we developed a deep learning algorithm (OPSCCnet), to analyze standard H&E stains for the calculation of a patient-level score associated with prognosis, comparing it to combined HPV-DNA and p16-status. When comparing OPSCCnet to HPV-status, the algorithm showed a good overall performance with a mean area under the receiver operator curve (AUROC) = 0.83 (95% CI = 0.77-0.9) for the test cohort (n = 639), which could be increased to AUROC = 0.88 by filtering cases using a fixed threshold on the variance of the probability of the HPV-positive class - a potential surrogate marker of HPV-heterogeneity. OPSCCnet could be used as a screening tool, outperforming gold standard HPV testing (OPSCCnet: five-year survival rate: 96% [95% CI = 90-100%]; HPV testing: five-year survival rate: 80% [95% CI = 71-90%]). This could be confirmed using a multivariate analysis of a three-tier threshold (OPSCCnet: high HR = 0.15 [95% CI = 0.05-0.44], intermediate HR = 0.58 [95% CI = 0.34-0.98] p = 0.043, Cox proportional hazards model, n = 211; HPV testing: HR = 0.29 [95% CI = 0.15-0.54] p < 0.001, Cox proportional hazards model, n = 211). Collectively, our findings indicate that by analyzing standard gigapixel hematoxylin and eosin (H&E) histological whole-slide images, OPSCCnet demonstrated superior performance over p16/HPV-DNA testing in various clinical scenarios, particularly in accurately stratifying these patients.


Conflict of interest statement

J.H. received consulting and lecture fees from BMS, also received research funding from CureVac. R.B. received consulting and lecture fees from AbbVie, Amgen, AstraZeneca, Bayer, BMS, Boehringer-Ingelheim, Illumina, Lilly, Merck-Serono, MSD, Novartis, Qiagen, Pfizer, Roche, Targos MP Inc. R.B. is Co-Founder and Scientific Advisor for Targos Mol. Pathology Inc and member of the Directory Board Gnothis Inc. H.C.R. received consulting and lecture fees from Novartis, Abbvie, AstraZeneca, Vertex and Merck. H.C.R. received research funding from AstraZeneca and Gilead Pharmaceuticals. HCR is a co-founder of CDL Therapeutics GmbH. The remaining authors declare no competing interests.

Figures

Fig. 1
Fig. 1. Study design and overall concept.
a Patients from Cologne (C, GER), Giessen (G, GER), Maastricht (M, NL), Heidelberg (H, GER) and TCGA (T, USA; database) were included in the study (n = 906). HPV association was defined as either dichotomous HPV-DNA and p16 IHC status if both markers were available or by p16/detection of high-risk HPV-DNA. All patients received standard treatment of care. b CONsolidated Standards Of Reporting Trials (CONSORT)-like flow chart representing the study population of the training/validation cohort of 267 patients. Cases that could not be identified as OPSCC or with missing information on HPV-status were excluded. There were four cases where follow-up data were not available in the training cohort, which were used for training the model for HPV association, but not for survival analysis. (c) CONSORT-like flow chart representing the study population of the external test set of 639 patients. . Both primary tumors and lymph node metastases were included in the test set.
Fig. 2
Fig. 2. Performance of the model to predict HPV association for six different patient populations.
a Pie charts for patient characteristics for the training cohort (left panel) and test cohort (right panel). The number besides the panel indicates the number of patients originating from each center. b Area under the receiver operator curve (AUROC) for six different patient populations. Cologne (n = 177), Giessen (n = 240), Maastricht (n = 88), Heidelberg (n = 31), and lymph node metastasis (n = 103) which originated from the Giessen site and were independent to the training cohort. c Overview of the study population after applying a threshold of cases with a variance below 7x10². d Area under the receiver operator curve (AUROC) for cases that were filtered by the threshold of variance. e Visualization of the Cox proportional hazards model for tile class prevalence of the HPV-positive class. The red line indicates the smoothened function, the vertical lines at the horizontal axis indicates individual patients with a given risk. The green bar indicates the error of the function. f Kaplan–Meier curve of n = 258 patients stratified for tile class prevalence of the HPV-positive class. A Cox proportional hazards model was used to compare survival curves.
Fig. 3
Fig. 3. Prognostic relevance of predicted HPV association.
a Hazard ratio plot of the predicted HPV association and overall survival for patients from the test cohort: Cologne (C; n = 177), Giessen (G; n = 240), Maastricht (M; n = 88) and Heidelberg (H; n = 31). b Corresponding Kaplan–Meier curve for the same population as depicted in A (n = 531). The cohort is divided into three separate groups by the combined score. A Cox proportional hazards model was used to compare survival curves. c Hazard ratio plot of the predicted HPV association and overall survival for patients from the training cohort: Cologne (C; n = 233), Giessen (G; n = 13), and TCGA (T; n = 21), with a total of n = 263 patients. d Corresponding Kaplan Meier curve for the same population as depicted in C (n = 263). The cohort is divided into three separate groups by the combined score. A Cox proportional hazards model was used to compare survival curves. e Hazard ratio plot of the predicted HPV association and overall survival for patients from the test cohort, exclusively containing lymph node metastatic samples: Giessen (G; n = 102). f Corresponding Kaplan–Meier curve for the same population as depicted in E (n = 102). The cohort is divided into three separate groups by the combined score. A Cox proportional hazards model was used to compare survival curves. g Histological image of three cases with corresponding classes of the combined score. The scale bars have a length of 0.052 mm.
Fig. 4
Fig. 4. Prognostic significance of the predicted HPV association for stage I/II patients compared to gold-standard.
a Patients with early-stage disease I/II (Union for International Cancer Control; UICC 8th) from different centers of the test cohort are included for the subsequent analysis. b Hazard ratio plot of the selected patients with stage I/II disease. c Kaplan–Meier curve for the survival benefit of stage I/II patients according to the combined score. A Cox proportional hazards model was used to compare survival curves. d Schematic, illustrating that for comparison HPV testing, with both HPV-DNA assessment and p16 status (dichotomous testing) was used. e Kaplan–Meier curve for regular HPV testing. A Cox proportional hazards model was used to compare survival curves. f Schematic illustration of the filtering criteria for the subsequent analysis. Cases from Cologne, Giessen, Maastricht, and Heidelberg that were tested as HPV-positive (n = 232). g Hazard ratio plot of the selected patients with stage a positive HPV-status (n = 232). h Kaplan–Meier curve for the combined score of patients tested as HPV-positive (n = 232). A Cox proportional hazards model was used to compare survival curves.

References

    1. Lechner M, Liu J, Masterson L, Fenton TR. HPV-associated oropharyngeal cancer: epidemiology, molecular biology and clinical management. Nat. Rev. Clin. Oncol. 2022;19:306–327. doi: 10.1038/s41571-022-00603-7. - DOI - PMC - PubMed
    1. Craig SG, et al. Recommendations for determining HPV status in patients with oropharyngeal cancers under TNM8 guidelines: a two-tier approach. Br J Cancer. 2019;120:827–833. doi: 10.1038/s41416-019-0414-9. - DOI - PMC - PubMed
    1. Rasmussen JH, et al. Risk profiling based on p16 and HPV DNA more accurately predicts location of disease relapse in patients with oropharyngeal squamous cell carcinoma. Ann. Oncol. 2019;30:629–636. doi: 10.1093/annonc/mdz010. - DOI - PubMed
    1. Wagner S, et al. Evaluation of p16INK4a expression as a single marker to select patients with HPV-driven oropharyngeal cancers for treatment de-escalation. Br J Cancer. 2020;123:1114–1122. doi: 10.1038/s41416-020-0964-x. - DOI - PMC - PubMed
    1. Hashida Y, et al. Prognostic significance of human papillomavirus 16 viral load level in patients with oropharyngeal cancer. Cancer Sci. 2021;112:4404–4417. doi: 10.1111/cas.15105. - DOI - PMC - PubMed