. 2023 Aug 19;3(1):84.
doi: 10.1038/s43705-023-00278-w.

Inter-comparison of marine microbiome sampling protocols

Affiliations

Inter-comparison of marine microbiome sampling protocols

Francisco Pascoal et al. ISME Commun. .

Abstract

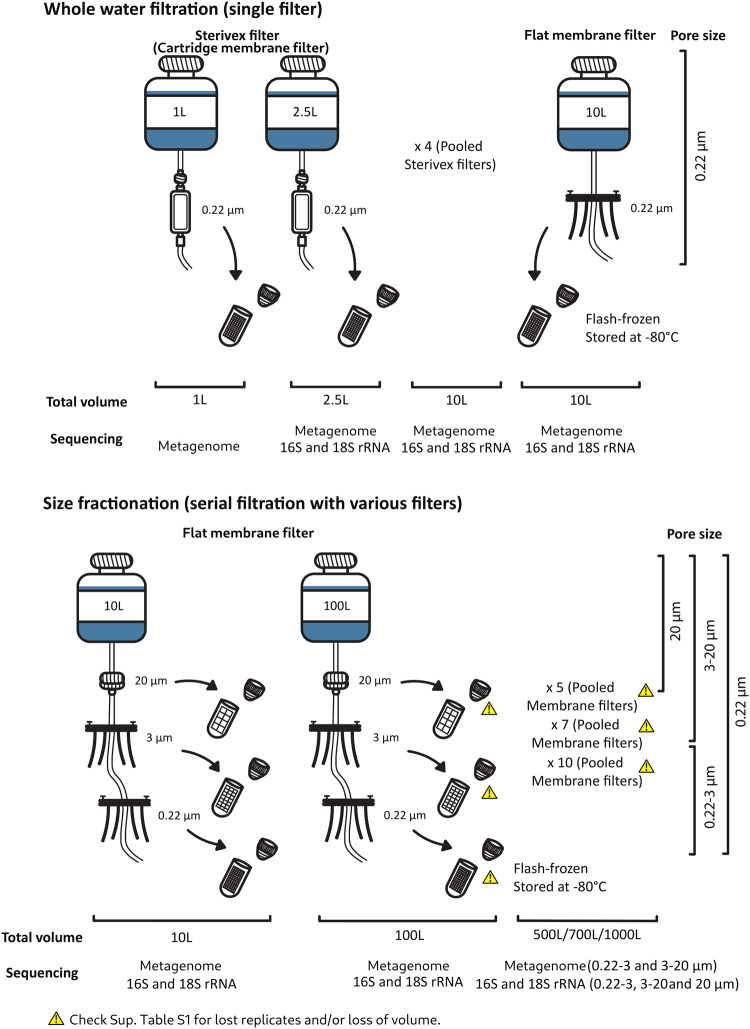
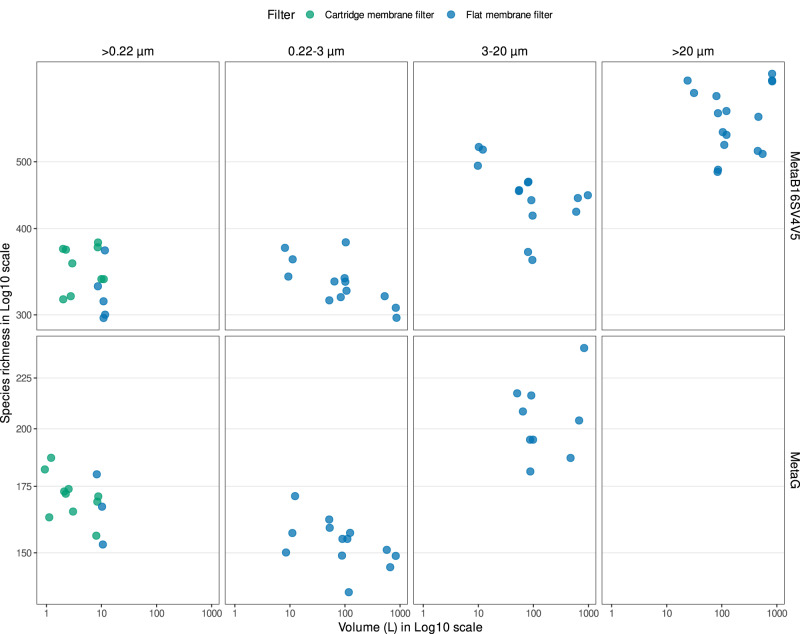
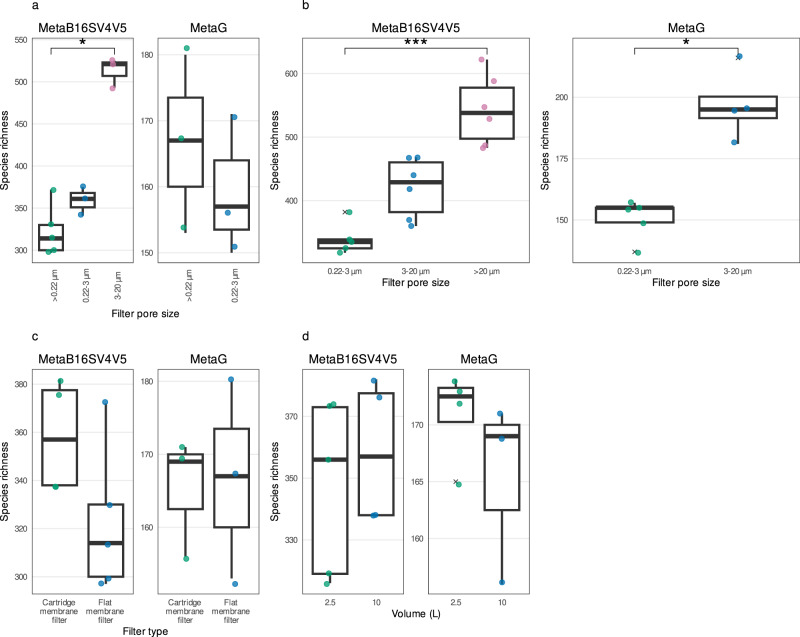
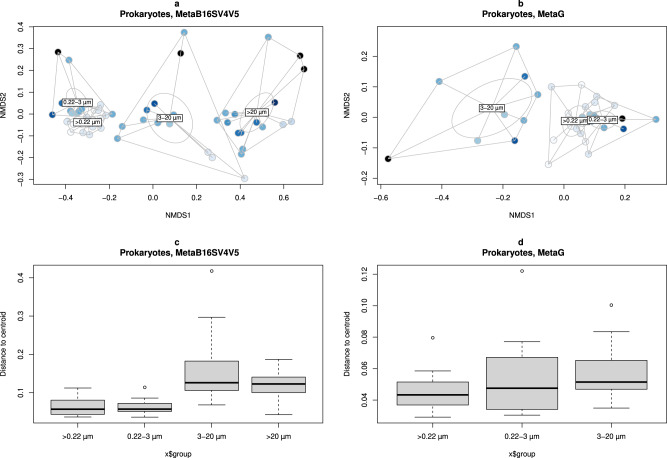
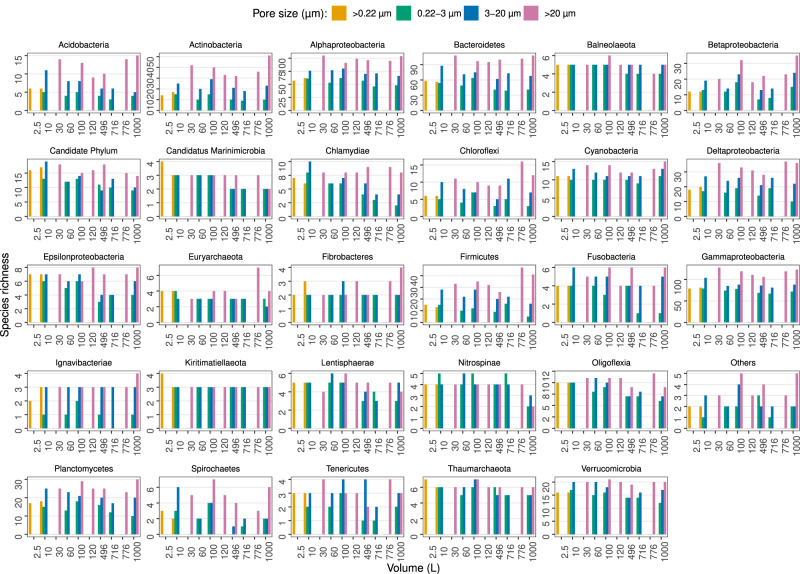
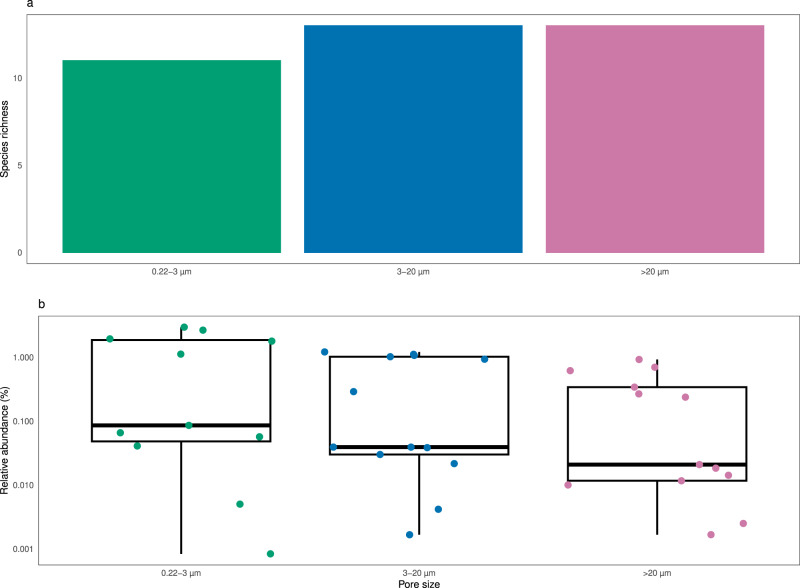
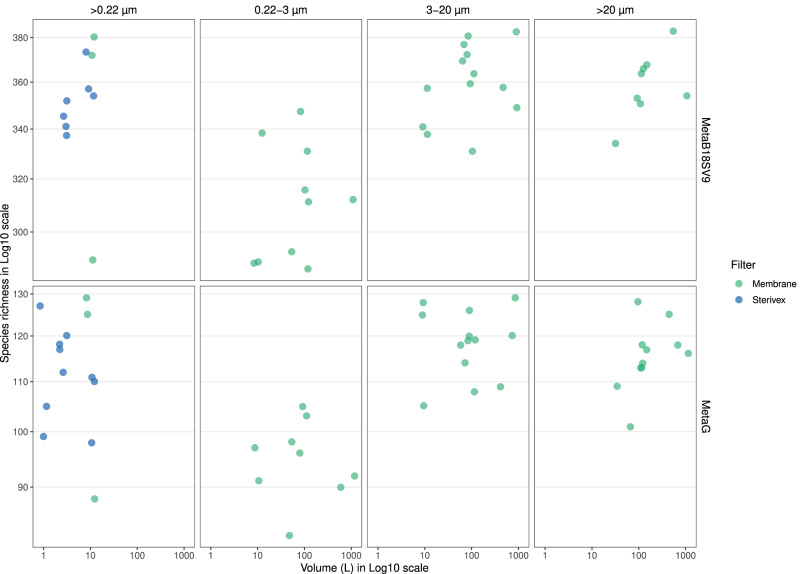
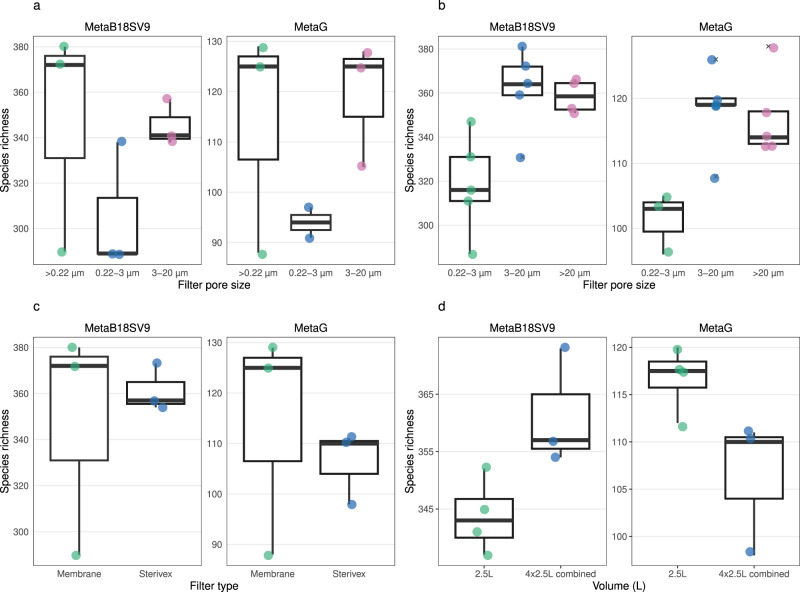
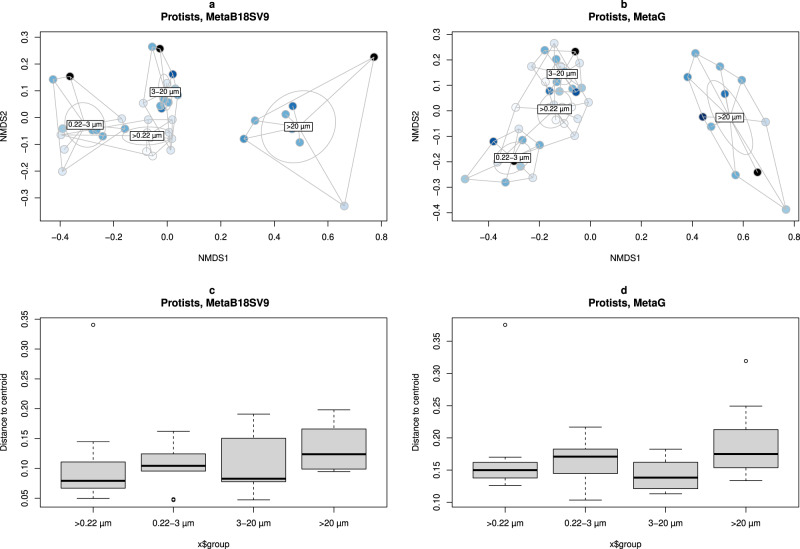
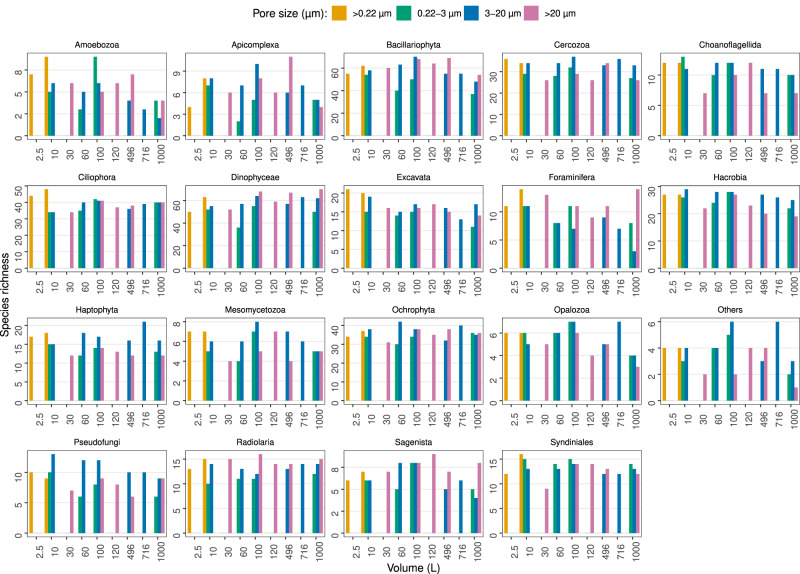
Research on marine microbial communities is growing, but studies are hard to compare because of variation in seawater sampling protocols. To help researchers in the inter-comparison of studies that use different seawater sampling methodologies, as well as to help them design future sampling campaigns, we developed the EuroMarine Open Science Exploration initiative (EMOSE). Within the EMOSE framework, we sampled thousands of liters of seawater from a single station in the NW Mediterranean Sea (Service d'Observation du Laboratoire Arago [SOLA], Banyuls-sur-Mer), during one single day. The resulting dataset includes multiple seawater processing approaches, encompassing different material-type kinds of filters (cartridge membrane and flat membrane), three different size fractionations (>0.22 µm, 0.22-3 µm, 3-20 µm and >20 µm), and a number of different seawater volumes ranging from 1 L up to 1000 L. We show that the volume of seawater that is filtered does not have a significant effect on prokaryotic and protist diversity, independently of the sequencing strategy. However, there was a clear difference in alpha and beta diversity between size fractions and between these and "whole water" (with no pre-fractionation). Overall, we recommend care when merging data from datasets that use filters of different pore size, but we consider that the type of filter and volume should not act as confounding variables for the tested sequencing strategies. To the best of our knowledge, this is the first time a publicly available dataset effectively allows for the clarification of the impact of marine microbiome methodological options across a wide range of protocols, including large-scale variations in sampled volume.


Conflict of interest statement

The authors declare no competing interests.

Figures

Fig. 1
Fig. 1. Schematic representation of sampling campaign.
An attempt was made to have at least three replicates of each step, however, some steps lost replicates and/or volume, those situations are highlighted with an attention sign in this figure. For more details on replicates, see Supplementary Table S1.
Fig. 2
Fig. 2. Overview of the prokaryotic species richness obtained.
The grid divides the possible sequencing strategies in rows (MetaB16SV4V5 or metagenome) and the utilization of whole water (>0.22 µm) or size fractions (0.22–3 µm, 3–20 µm and >20 µm) in columns. Color distinguishes between flat and cartridge membrane filters. Within each grid unit, the prokaryotic species richness is plotted against volume, which ranges from 2.5 L to 1000 L.
Fig. 3
Fig. 3. Detailed comparison of the prokaryotic species richness across methodological variables.
a Comparison for whole water (>0.22 µm), 0.22–3 µm and 3–20 µm size fractions for the same volume (10 L) and filter (flat membrane), for MetaB16SV4V5 (left) and metagenomes (right). Note that metagenomes didn’t include samples in 3–20 µm size fraction in (a). b Comparison for size fractions (0.22–3 µm, 3–20 µm and > 20 µm size fractions) for the same volume (100 L) and filter (flat membrane), for MetaB16SV4V5 (left) and metagenomes (right). Note that metagenomes didn’t include samples in >20 µm size fraction in (b). c Comparison for flat membrane vs cartridge membrane, for the same volume (10 L) and whole water (>0.22 µm), for MetaB16SV4V5 (left) and metagenomes (right). d Comparison between 2.5 L (single filter) and 10 L (four 2.5 L filters pooled together), using the same filter (cartridge membrane) and whole water (> 0.22 µm), for MetaB16SV4V5 (left) and metagenomes (right). All panels illustrate the species richness obtained for each sample (point). To help the reader compare the variables, we added boxplots on top of the points. Significance was determined using either Mann–Whitney test for two independent groups, or Kruskall–Wallis for more than two independent groups, followed by a post-hoc Dunn test, if needed. Significance was illustrated with the symbols: p > 0.05 (empty); p < 0.05 (*); p < 0.01 (**); and p < 0.001 (***).
Fig. 4
Fig. 4. Prokaryotic community composition overview.
MDS ordination of dissimilarity values (Bray–Curtis) for the prokaryotic community obtained in each sample. Samples were colored by volume and grouped by whole water (>0.22 µm), 0.22–3 µm, 3–20 µm and >20 µm size fractions. Division by (a) MetaB16SV4V5 and (b) metagenomes. Additionally, boxplots represent the distance to centroids of samples within each size fraction, divided by (c) MetaB16SV4V5 and (d) metagenomes. Note that metagenomes didn’t include the >20 µm size fraction. For details on missing replicates, we refer the reader to Supplementary Table S1.
Fig. 5
Fig. 5. Prokaryotic species richness per taxonomic group, from MetaB16SV4V5.
Each panel represents the species richness of a specific prokaryotic phyla or class for each volume (1–1000 L). Bar plots indicate species richness and are colored by pore size. The taxonomic group called “Others” includes all phyla that didn’t reach, at least, 100 taxonomic lineages across all samples, to avoid an excessive amount of uninformative, redundant panels. The taxonomic group called “Candidate Phylum” includes all phyla with candidate designation, except for candidate phyla Marinimicrobia.
Fig. 6
Fig. 6. Detailed analysis of candidate phyla Marinimicrobia, from MetaB16SV4V5.
a Number of candidate phyla Marinimicrobia taxonomic lineages and (b) relative abundance of the taxonomic lineages from (a). The values from (a) and (b) were compared for each size fraction (0.22–3 µm, 3–20 µm and > 20 µm) using the same volume (100 L) and filter (flat membrane).
Fig. 7
Fig. 7. Overview of protist species richness obtained.
The grid divides the possible sequencing strategies in rows (MetaB18SV9 or metagenome) and the utilization of whole water (>0.22 µm) or size fractions (0.22–3 µm, 3–20 µm and >20 µm) in columns. Color distinguishes between flat membrane and cartridge membrane filters. Within each grid unit, the protist species richness is plotted against volume. For details on missing replicates, we refer the reader to Supplementary Table S1.
Fig. 8
Fig. 8. Detailed comparison of the protist species richness across methodological variables.
a Comparison for whole water (>0.22 µm), 0.22–3 µm and 3–20 µm size fractions for the same volume (10 L) and filter (membrane), for MetaB18SV9 (left) and metagenomes (right). b Comparison for size fractions (0.22–3 µm, 3–20 µm and > 20 µm size fractions) for the same volume (100 L) and filter (membrane), for MetaB18SV9 (left) and metagenomes (right). c Comparison for flat membrane vs cartridge membrane, for the same volume (10 L) and whole water (>0.22 µm), for MetaB18SV9 (left) and metagenomes (right). d Comparison between 2.5 L (single filter) and 10 L (four 2.5 L filters pooled together), using the same filter (cartridge membrane) and whole water (> 0.22 µm), for MetaB18SV9 (left) and metagenomes (right). All panels illustrate the species richness obtained for each sample (point). To help the reader compare the variables, we added boxplots on top of the points. Significance was determined using either Mann–Whitney test for two independent groups, or Kruskall–Wallis for more than two independent groups, followed by a post-hoc Dunn test, if needed. Significance was illustrated with the symbols: p > 0.05 (empty); p < 0.05 (*); p < 0.01 (**); and p < 0.001 (***).
Fig. 9
Fig. 9. Protist community composition overview.
MDS ordination of dissimilarity values (Bray–Curtis) for the protist community obtained in each sample. Samples were colored by volume and grouped by whole water (>0.22 µm), 0.22–3 µm, 3–20 µm and >20 µm size fractions divided by (a) MetaB18SV9 and (b) metagenomes. Additionally, boxplots represent the distance to centroids of samples within each size fraction, divided by (c) MetaB16SV4V5 and (d) metagenomes.
Fig. 10
Fig. 10. Protist species richness per taxonomic group, from MetaB18SV9.
Each panel represents the species richness of a specific protist group for each volume (1–1000 L). Bar plots indicate species richness and are colored by pore size. Selected taxonomic groups follow a “fake rank” manually curated to highlight groups of interest, with the less representative groups merged into “Others” designation.

Similar articles

Cited by

  • Global marine microbial diversity and its potential in bioprospecting.
    Chen J, Jia Y, Sun Y, Liu K, Zhou C, Liu C, Li D, Liu G, Zhang C, Yang T, Huang L, Zhuang Y, Wang D, Xu D, Zhong Q, Guo Y, Li A, Seim I, Jiang L, Wang L, Lee SMY, Liu Y, Wang D, Zhang G, Liu S, Wei X, Yue Z, Zheng S, Shen X, Wang S, Qi C, Chen J, Ye C, Zhao F, Wang J, Fan J, Li B, Sun J, Jia X, Xia Z, Zhang H, Liu J, Zheng Y, Liu X, Wang J, Yang H, Kristiansen K, Xu X, Mock T, Li S, Zhang W, Fan G. Chen J, et al. Nature. 2024 Sep;633(8029):371-379. doi: 10.1038/s41586-024-07891-2. Epub 2024 Sep 4. Nature. 2024. PMID: 39232160 Free PMC article.
  • Definition of the microbial rare biosphere through unsupervised machine learning.
    Pascoal F, Branco P, Torgo L, Costa R, Magalhães C. Pascoal F, et al. Commun Biol. 2025 Apr 2;8(1):544. doi: 10.1038/s42003-025-07912-4. Commun Biol. 2025. PMID: 40175529 Free PMC article.

References

    1. Proctor LM, Creasy HH, Fettweis JM, Lloyd-Price J, Mahurkar A, Zhou W, et al. The Integrative Human Microbiome Project the integrative HMP (iHMP) research Network consortium. Nature. 2019;569:641–8. - PMC - PubMed
    1. Gevers D, Knight R, Petrosino JF, Huang K, McGuire AL, Birren BW, et al. The Human Microbiome project: a community resource for the healthy human microbiome. PLoS Biol. 2012;10:e1001377. - PMC - PubMed
    1. Huggett MJ, Apprill A. Coral microbiome database: Integration of sequences reveals high diversity and relatedness of coral-associated microbes. Environ Microbiol Rep. 2019;11:372–85. - PMC - PubMed
    1. Thomas T, Moitinho-Silva L, Lurgi M, Björk JR, Easson C, Astudillo-García C, et al. Diversity, structure and convergent evolution of the global sponge microbiome. Nat Commun. 2016;7:11870. - PMC - PubMed
    1. Moitinho-Silva L, Nielsen S, Amir A, Gonzalez A, Ackermann GL, Cerrano C, et al. The sponge microbiome project. Gigascience. 2017;6:1–13. - PMC - PubMed