

Reference ranges for body composition indices by dual energy X-ray absorptiometry from the Bone Mineral Density in Childhood Study Cohort
- PMID: 37598746
- PMCID: PMC10579045
- DOI: 10.1016/j.ajcnut.2023.08.006
Reference ranges for body composition indices by dual energy X-ray absorptiometry from the Bone Mineral Density in Childhood Study Cohort
Abstract
Background: Body composition assessment aids evaluation of energy stores and the impact of diseases and interventions on child growth. Current United States pediatric reference ranges from the National Health and Nutrition Examination Survey (NHANES) include 20% of children with obesity, body mass index of ≥95th percentile.
Objectives: This study aimed to develop dual energy X-ray absorptiometry (DXA) based reference ranges in a diverse cohort with low-obesity prevalence from the Bone Mineral Density in Childhood Study (BMDCS).
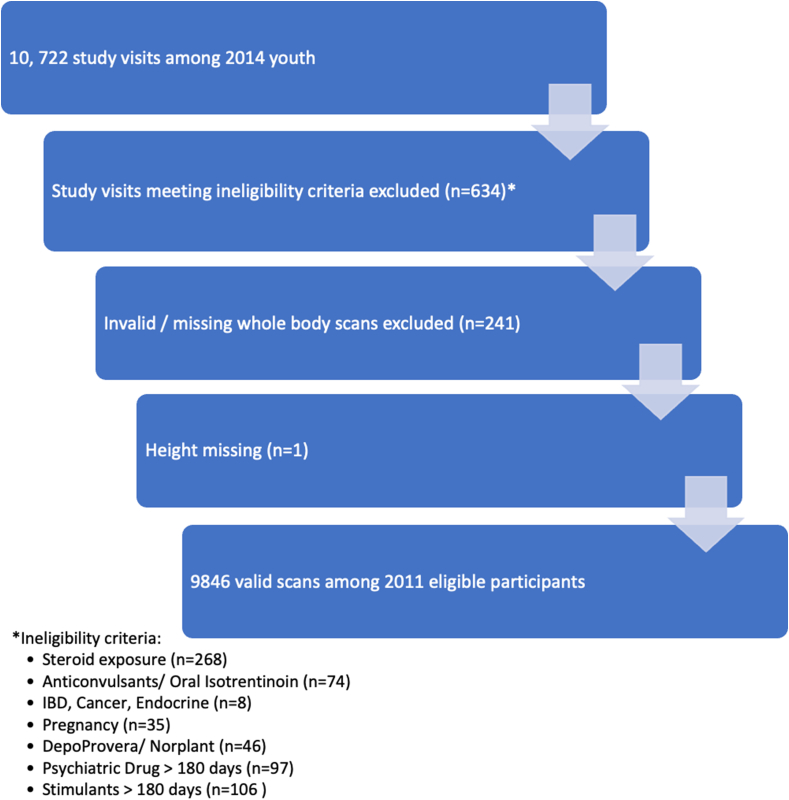
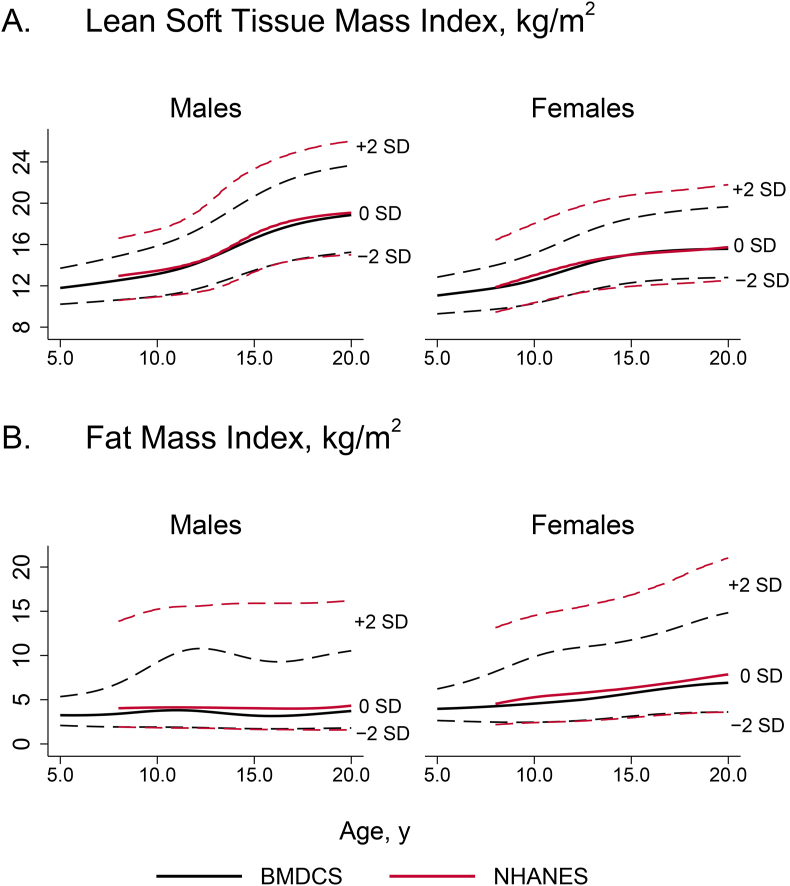
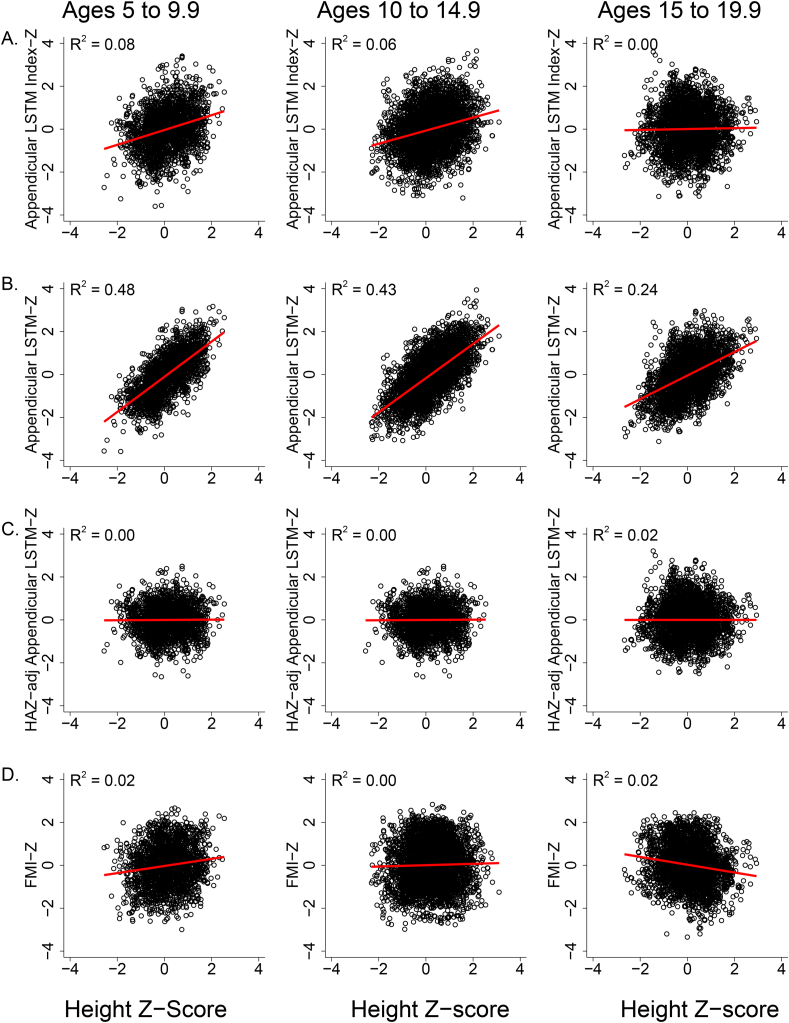
Methods: This is a secondary analysis of a longitudinal, prospective, observational cohort. Healthy children (height and BMI within 3rd to 97th percentiles, ages 5-19 y at enrollment), from 5 United States centers were measured annually for ≤7 visits. Whole body scans were acquired using Hologic scanners. A subsample underwent repeat measurements to determine precision. We generated reference ranges for appendicular and total lean soft tissue mass index (LSTM Index), fat mass index (FMI), and other body composition measures. Resulting curves were compared to NHANES and across subgroups. Sex and age-specific equations were developed to adjust body composition Z-scores for height Z score.
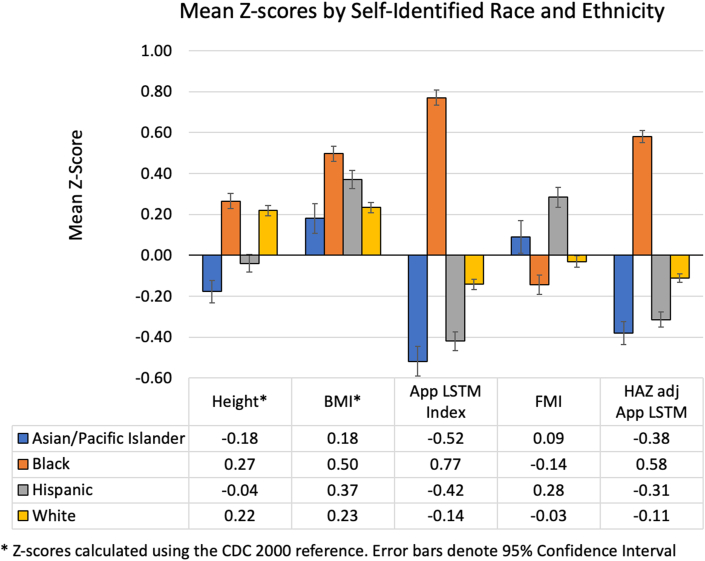
Results: We obtained 9846 scans of 2011 participants (51% female, 22% Black, 17% Hispanic, 48% White, 7% Asian/Pacific Islander, and 6% with obesity). Precision (percent coefficient of variation) ranged from 0.7% to 1.96%. Median and-2 standard deviation curves for BMDCS and NHANES were similar, but NHANES +2 standard deviation LSTM Index and FMI curves were distinctly greater than the respective BMDCS curves. Subgroup differences were more extreme for appendicular LSTM Index-Z (mean ± SD: Asian -0.52 ± 0.93 compared with Black 0.77 ± 0.87) than for FMI-Z (Hispanic 0.29 ± 0.98 compared with Black -0.14 ± 1.1) and were smaller for Z-scores adjusted for height Z-score.
Conclusions: These reference ranges add to sparse normative data regarding body composition in children and adolescents and are based on a cohort with an obesity prevalence similar to current BMI charts. Awareness of subgroup differences aids in interpreting results.
Keywords: DXA; fat mass index; lean soft tissue mass index; pediatric; reference.
Copyright © 2023 The Authors. Published by Elsevier Inc. All rights reserved.
Figures
References
-
- Zemel B. In: Human Growth and Development. Cameron N., Schell L., editors. Academic Press; Amsterdam: 2022. Body composition during growth and development; pp. 517–545.
-
- Purcell S.A., Kok D.E., Ketterl T., Garcia M.B., Joffe L., Brown J.C., et al. Pharmacokinetics of cancer therapeutics and energy balance: the role of diet intake, energy expenditure, and body composition. J. Natl. Cancer Inst. Monogr. 2023;2023(61):3–11. doi: 10.1093/jncimonographs/lgad010. - DOI - PMC - PubMed
-
- Thompson P.A., Rosner G.L., Matthay K.K., Moore T.B., Bomgaars L.R., Ellis K.J., et al. Impact of body composition on pharmacokinetics of doxorubicin in children: a Glaser Pediatric Research Network study. Cancer Chemother. Pharmacol. 2009;64(2):243–251. doi: 10.1007/s00280-008-0854-z. - DOI - PubMed
Publication types
MeSH terms
Grants and funding
LinkOut - more resources
Full Text Sources
Medical
