. 2023 Aug 20;21(1):559.
doi: 10.1186/s12967-023-04337-7.

Altered insulin secretion dynamics relate to oxidative stress and inflammasome activation in children with obesity and insulin resistance

Affiliations

Altered insulin secretion dynamics relate to oxidative stress and inflammasome activation in children with obesity and insulin resistance

Álvaro González-Domínguez et al. J Transl Med. .

Abstract

Background: Insulin resistance (IR) is considered the main driver of obesity related metabolic complications, and is related to oxidative stress and inflammation, which in turn promote each other. There is currently no specific definition of IR in children, rather, that for adult population is used by pediatric endocrinologists instead. Altered insulin secretion dynamics are associated with worse metabolic profiles and type 2 diabetes mellitus development, thus we aimed to test whether insulin response relates to oxidative stress and inflammation in children.

Methods: We conducted a case-control study, including 132 children classified as follows: 33 children without obesity (Lean); 42 with obesity but no IR according to the American Diabetes Association criteria for adults (OBIR-); 25 with obesity and IR and an early insulin response to an oral glucose tolerance test (OGTT) (EP-OBIR +); 32 with obesity, IR, and a late insulin peak (LP-OBIR +); and studied variables associated with lipid and carbohydrate metabolism, oxidative stress, inflammation and inflammasome activation.

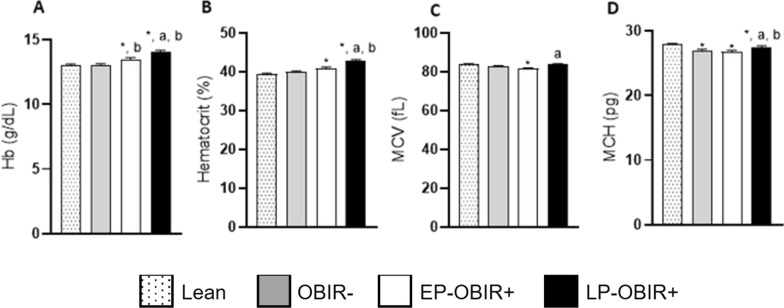
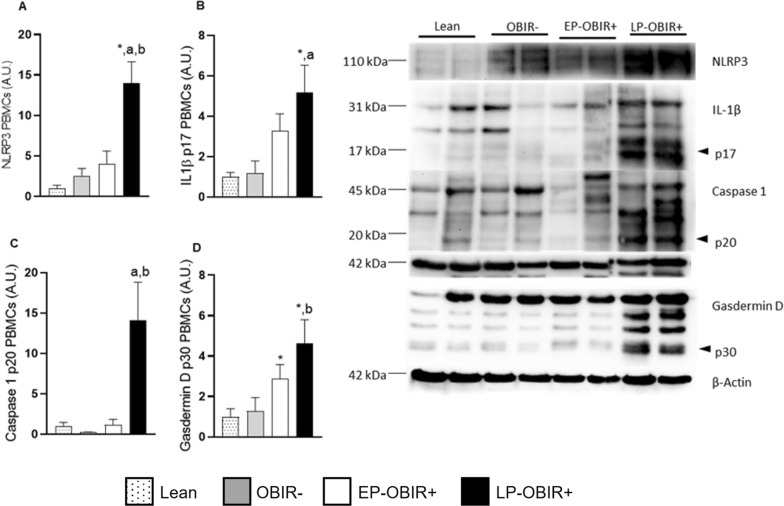
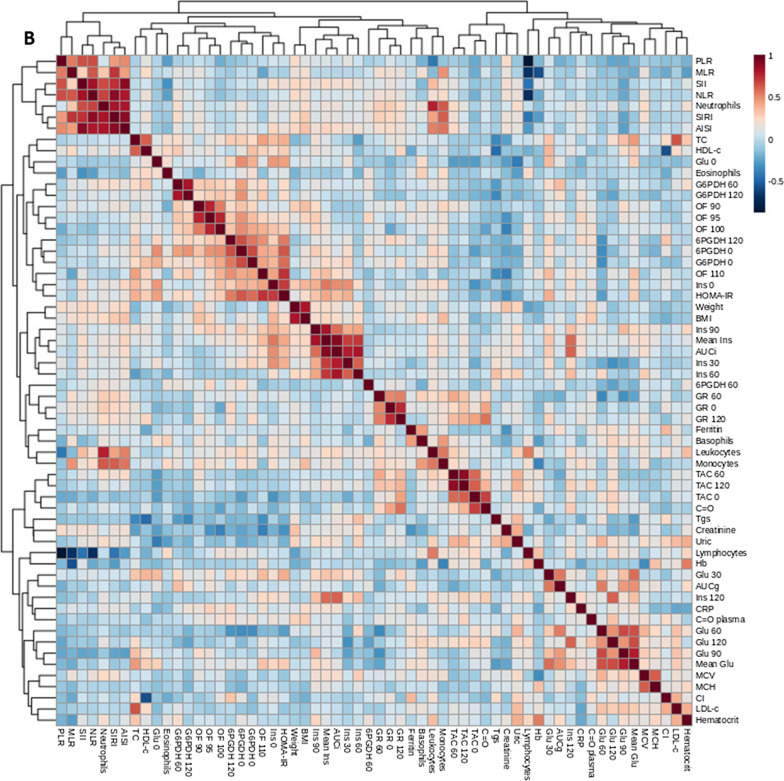
Results: The measured parameters of children with obesity, IR, and an early insulin response were similar to those of children with obesity but without IR. It was late responders who presented an impaired antioxidant system and elevated oxidative damage in erythrocytes and plasma, and inflammasome activation at their white blood cells, despite lower classical inflammation markers. Increased uric acid levels seems to be one of the underlying mechanisms for inflammasome activation.

Conclusions: It is insulin response to an OGTT that identifies children with obesity suffering oxidative stress and inflammasome activation more specifically. Uric acid could be mediating this pathological inflammatory response by activating NLRP3 in peripheral blood mononuclear cells.

Keywords: Childhood obesity; Inflammasome activation; Insulin resistance; Oral glucose tolerance test; Oxidative stress.


Conflict of interest statement

The authors declare no competing interests related with this work.

Figures

Fig. 1
Fig. 1
Levels of reactive oxygen species in erythrocytes in the study population. White bars with dots represent lean children (n = 15), grey bars represent OBIR- children (n = 10), grey bars with dots represent OBIR + children (n = 47), white bars represent EP-OBIR + children (n = 10), and black bars represent LP-OBIR + children (n = 26). A shows ROS levels in lean, OBIR- and OBIR+ groups of children. Representative histograms for lean, ObIR-, and ObIR + groups are represented in B, C and D, respectively (red represents negative control, and blue DCFDA labelled cells). E shows ROS levels in these same groups, when the ObIR + group is subdivided into early responders (white bars) and late responders (black bars). F and G are representative histograms for these early and late responders respectively. Values are means ± SEM. P < 0.05 was considered statistically significant. (*) shows significant differences relative to lean children and a shows significant differences relative to EP-OBIR + children. ObIR-, non-insulin resistant children with obesity; ObIR + , insulin resistant children with obesity; EP-OBIR + , early peak OBIR + children; LP-OBIR + , late peak OBIR + children; DCFDA, 2,7-dichlorofluorescein diacetate
Fig. 2
Fig. 2
Levels of oxidative damage present in erythrocytes and plasma of the study population. TBARS levels were measured in erythrocytes A and plasma D at baseline and along OGTT, and carbonyl group levels were measured at baseline in erythrocytes B and plasma E. Also, erythroid osmotic fragility C was quantified in every group. White bars with dots represent lean children (n = 17), grey bars represent OBIR- children (n = 13), white bars represent EP-OBIR + children (n = 13), and black bars represent LP-OBIR + children (n = 17). Values are means ± SEM. P < 0.05 was considered for statistical significance. (#) shows significant differences relative to 90 mM of NaCl, (*) shows significant differences relative to lean children, a shows significant differences relative to EP-OBIR + children, and b shows significant differences relative to OBIR- children. ObIR-, non-insulin resistant children with obesity; ObIR + , insulin resistant children with obesity; EP-OBIR + , early peak OBIR + children; LP-OBIR + , late peak OBIR + children; OGTT, oral glucose tolerance test; MDA, malondialdehyde; TBARS, thiobarbituric acid reacting substances; C = O, carbonyl groups
Fig. 3
Fig. 3
Antioxidant system-related enzyme activities in erythrocytes in the study population. TAC A, GR B, G6PDH C, and 6PGDH D activities were measured at baseline and along the OGTT. White bars with dots represent lean children (n = 20), grey bars represent OBIR- children (n = 13), white bars represent EP-OBIR + children (n = 10), and black bars represent LP-OBIR + children (n = 25). Values are means ± SEM. P < 0.05 was considered for statistical significance. (*) shows significant differences relative to lean children, a shows significant differences relative to EP-OBIR + children, b shows significant differences relative to OBIR- children, and (#) shows significant differences along the OGTT. ObIR-, non-insulin resistant children with obesity; ObIR + , insulin resistant children with obesity; EP-OBIR + , early peak OBIR + children; LP-OBIR + , late peak OBIR + children; NADP, nicotinamide-adenine dinucleotide phosphate; TAC, total antioxidant capacity; GR, glutathione reductase; G6PDH, glucose-6-phosphate dehydrogenase; 6PGDH, 6-phosphogluconate dehydrogenase; OGTT, oral glucose tolerance test
Fig. 4
Fig. 4
Erythrocyte characterization of the study population. Total hemoglobin content A, hematocrit B, mean corpuscular volume C, and mean corpuscular hemoglobin D were quantified in peripheral blood at baseline. White bars with dots represent lean children (n = 30), grey bars represent OBIR- children (n = 35), white bars represent EP-OBIR + children (n = 19), and black bars represent LP-OBIR + children (n = 32). Values are means ± SEM. P < 0.05 was considered for statistical significance. (*) shows significant differences relative to control children, a shows significant differences relative to EP-OBIR + children, and b shows significant differences relative to OBIR- children. ObIR-, non-insulin resistant children with obesity; ObIR + , insulin resistant children with obesity; EP-OBIR + , early peak OBIR + children; LP-OBIR + , late peak OBIR + children; Hb, hemoglobin; MCV, mean corpuscular volume; MCH, mean corpuscular hemoglobin
Fig. 5
Fig. 5
Inflammatory markers of the study population. Total leukocyte count A, total neutrophil count B, total lymphocyte count C, total monocyte count D, total platelet count E, systemic immune-inflammation index F, systemic inflammation response index G, aggregate index of systemic inflammation H, monocyte to lymphocyte ratio I, neutrophil to lymphocyte ratio J, plasmatic C-reactive protein K, plasmatic ferritin L, plasmatic creatinine M, and plasmatic uric acid N. White bars with dots represent lean children (n = 30), grey bars represent metabolically healthy children with obesity (n = 35), white bars represent the early responder group (n = 19), and black bars represent the late responder group (n = 32). Values are means ± SEM. P < 0.05 was considered for statistical significance. (*) shows significant differences relative to lean children, a shows significant differences relative to EP-OBIR + children, b shows significant differences relative to OBIR- children, and (#) shows significant differences along the OGTT. ObIR-, non-insulin resistant children with obesity; ObIR + , insulin resistant children with obesity; EP-OBIR + , early peak OBIR + children; LP-OBIR + , late peak OBIR + children; SII, systemic immune-inflammation index; SIRI, systemic inflammation response index; AISI, aggregate index of systemic inflammation; MLR, monocyte to lymphocyte ratio; NLR, neutrophil to lymphocyte ratio; A.U., arbitrary units; CRP, C-Reactive Protein
Fig. 6
Fig. 6
NLRP3 A, IL-1β B, caspase 1 C, and gasdermin D were quantified by western blotting in PBMCs of the study population. White bars with dots represent lean children (n = 8), grey bars represent OBIR- children (n = 8), white bars represent EP-OBIR + children (n = 12), and black bars represent LP-OBIR + children (n = 14). Values are means ± SEM. P < 0.05 was considered for statistical significance. The panel on the right are representative images of the western-blots performed for quantification. (*) shows significant differences relative to lean children, a shows significant differences relative to EP-OBIR + children, and b shows significant differences relative to OBIR- children. A.U., arbitrary units; NLRP3, NOD like receptor 3; IL-1β, interleukin 1β; PBMCs, peripheral blood mononuclear cells; ObIR-, non-insulin resistant children with obesity; ObIR + , insulin resistant children with obesity; EP-OBIR + , early peak OBIR + children; LP-OBIR + , late peak OBIR + children
Fig. 7
Fig. 7
NLRP3 A, IL-1β B, and caspase 1 C were quantified by western blotting in plasma of the study population. White bars with dots represent lean children (n = 8), grey bars represent OBIR- children (n = 8), white bars represent EP-OBIR + children (n = 12), and black bars represent LP-OBIR + children (n = 14). Values are means ± SEM. P < 0.05 was considered for statistical significance. The panel on the right are representative images of the western-blots performed for quantification. (*) shows significant differences relative to lean children, a shows significant differences relative to EP-OBIR + children, and b shows significant differences relative to OBIR- children. A.U., arbitrary units; NLRP3, NOD like receptor 3; IL-1β, interleukin 1β; PBMCs, peripheral blood mononuclear cells; ObIR-, non-insulin resistant children with obesity; ObIR + , insulin resistant children with obesity; EP-OBIR + , early peak OBIR + children; LP-OBIR + , late peak OBIR + children
Fig. 8
Fig. 8
Representation of Spearman’s correlations between anthropometric and biochemical variables in every group under study A and in in metabolically unhealthy children with obesity B. P < 0.05 was considered for statistical significance. CI, Castelli index; SII, systemic immune-inflammation index; SIRI, systemic inflammation response index; AISI, aggregate index of systemic inflammation; NLR, neutrophil to lymphocyte ratio; MLR, monocyte to lymphocyte ratio; Ins, insulin; Glu, glucose; 6PGDH, 6-phosphogluconate dehydrogenase; G6PDH, glucose-6-phosphate dehydrogenase; GR, glutathione reductase; TC, total cholesterol; Tgs, triglycerides; C = O, carbonyl groups; BMI, body mass index; TAC, total antioxidant capacity; CRP, C-reactive protein; Hb, hemoglobin; OF, osmotic fragility; MCV msupplean corpuscular volume; MCH, mean corpuscular hemoglobin; HOMA-IR, homeostasis model assessment of insulin resistance; AUCg, area under the curve of glucose; AUCi, area under the curve of insulin; HDL-C, high density lipoprotein cholesterol; LDL-C, low density lipoprotein cholesterol
Fig. 8
Fig. 8
Representation of Spearman’s correlations between anthropometric and biochemical variables in every group under study A and in in metabolically unhealthy children with obesity B. P < 0.05 was considered for statistical significance. CI, Castelli index; SII, systemic immune-inflammation index; SIRI, systemic inflammation response index; AISI, aggregate index of systemic inflammation; NLR, neutrophil to lymphocyte ratio; MLR, monocyte to lymphocyte ratio; Ins, insulin; Glu, glucose; 6PGDH, 6-phosphogluconate dehydrogenase; G6PDH, glucose-6-phosphate dehydrogenase; GR, glutathione reductase; TC, total cholesterol; Tgs, triglycerides; C = O, carbonyl groups; BMI, body mass index; TAC, total antioxidant capacity; CRP, C-reactive protein; Hb, hemoglobin; OF, osmotic fragility; MCV msupplean corpuscular volume; MCH, mean corpuscular hemoglobin; HOMA-IR, homeostasis model assessment of insulin resistance; AUCg, area under the curve of glucose; AUCi, area under the curve of insulin; HDL-C, high density lipoprotein cholesterol; LDL-C, low density lipoprotein cholesterol

Similar articles

Cited by

References

    1. Soriano JB, Rojas-Rueda D, Alonso J, Antó JM, Cardona PJ, Fernández E, et al. La carga de enfermedad en España: resultados del estudio de la carga global de las enfermedades 2016. Med Clin (Barc) 2018;151(5):171–190. - PubMed
    1. Di Cesare M, Sorić M, Bovet P, Miranda JJ, Bhutta Z, Stevens GA, et al. The epidemiological burden of obesity in childhood: a worldwide epidemic requiring urgent action. BMC Med. 2019;17(1):212. - PMC - PubMed
    1. Martos-Moreno GÁ, Gil-Campos M, Bueno G, Bahillo P, Bernal S, Feliu A, et al. Obesity associated metabolic impairment is evident at early ages: Spanish collaborative study. Nutr Hosp. 2014;30(4):787–793. - PubMed
    1. Gerich JE. Is reduced first-phase insulin release the earliest detectable abnormality in individuals destined to develop type 2 diabetes? Diabetes. 2002;51(suppl_1):S117–21. - PubMed
    1. Sun Y, Han J, Lin Z, Song L, Wang C, Jia W. Delayed insulin secretion response during an OGTT is associated with an increased risk for incidence of diabetes in NGT subjects. J Diabetes Complicat. 2016;30(8):1537–43. - PubMed

Publication types