. 2024 Jan;20(1):94-113.
doi: 10.1080/15548627.2023.2249750. Epub 2023 Aug 27.

Disrupted endoplasmic reticulum-mediated autophagosomal biogenesis in a Drosophila model of C9-ALS-FTD

Affiliations

Disrupted endoplasmic reticulum-mediated autophagosomal biogenesis in a Drosophila model of C9-ALS-FTD

Hyun Sung et al. Autophagy. 2024 Jan.

Abstract

3R: UAS construct expressing 3 G4C2 repeats (used as control); 3WJ: three-way junction; 12R: UAS construct expressing leader sequence and 12 G4C2 repeats; 30R: UAS construct expressing 30 G4C2 repeats; 36R: UAS construct expressing 36 G4C2 repeats; 44R: UAS construct expressing leader sequence and 44 G4C2 repeats; ALS: amyotrophic lateral sclerosis; Atg: autophagy related; atl: atlastin; C9-ALS-FTD: ALS or FTD caused by hexanuleotide repeat expansion in C9orf72; ER: endoplasmic reticulum; FTD: frontotemporal dementia; HRE: GGGGCC hexanucleotide repeat expansion; HSP: hereditary spastic paraplegia; Lamp1: lysosomal associated membrane protein 1; MT: microtubule; NMJ: neuromuscular junction; Rab: Ras-associated binding GTPase; RAN: repeat associated non-AUG (RAN) translation; RO-36: UAS construct expression "RNA-only" version of 36 G4C2 repeats in which stop codons in all six reading frames are inserted.; Rtnl1: Reticulon-like 1; SN: segmental nerve; TFEB/Mitf: transcription factor EB/microphthalmia associated transcription factor (Drosophila ortholog of TFEB); TrpA1: transient receptor potential cation channel A1; VAPB: VAMP associated protein B and C; VNC: ventral nerve cord (spinal cord in Drosophila larvae).

Keywords: Autophagy; C9-ALS-FTD; Drosophila; axonal transport; endoplasmic reticulum (ER) dynamics; motor neuron.


Conflict of interest statement

No potential conflict of interest was reported by the authors.

Figures
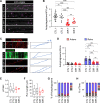
Figure 1.
Figure 1.
Expression of 30 G4C2 repeats (30 R) reduces motor axon autophagosomes without altering motility. (A) autophagosomes, labeled with mCherry (mCh)-tagged Atg8a, are imaged within motor axons of the third-instar larval segmental nerve. In control 1 (CTL 1), UAS-mCh-Atg8a is driven by VGlut-GAL4. In control 2 (CTL 2), mCherry-Atg8a is co-expressed with mito-GFP to control for GAL4/UAS dilution. Two independent UAS-(G4C2)30 transgenic lines are used (30 R 1 on chromosome 3 and 30 R 2 on chromosome 2). White dashed lines denote boundaries of segmental nerves. Scale bar: 10 µm. (B) quantification of autophagosomal density in motor axon. Number of animals in total; n = 25 (CTL 1), n = 12 (CTL 2), n = 25 (30 R 1) and n = 14 (30 R 2). (C) representative kymographs of autophagosome axonal transport in motor axons from the indicated genotypes. Blue angle brackets indicate retrograde transport of autophagosomes. Scale bars: 1 min (vertical) and 10 µm (horizontal). Axonal transport of autophagosomes is analyzed by measuring: flux (D), the number of autophagosomes moving through axon cross-section per minute, velocity (E), run length (F), and percentage of autophagosomes that are moving (G) in the retrograde direction (R), anterograde direction (A), or stationary (S). (H) retrograde moving autophagosomes are individually analyzed by measuring duty cycle, the percentage of time spent moving in retrograde direction (R), anterograde direction (A), or stationary (S). Number of animals in total; n = 10 (CTL 1), n = 9 (CTL 2), n = 16 (30 R 1) and n = 6 (30 R 2). Error bars indicate mean ± SEM. Significance is determined by one-way ANOVA with Bonferroni’s multiple comparisons test (B, D, E and F), and by Chi-Square test with a post-hoc analysis (G and H), respectively. *p < 0.05, ***p < 0.001, ****p < 0.0001, and ns = not significant.
Figure 2.
Figure 2.
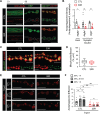
Autophagosome formation is inhibited in synaptic boutons in Drosophila models of C9-ALS-FTD. (A) representative images of autophagosomes in motor axons (i) and synaptic boutons (ii) from the indicated genotypes. Autophagic vesicles and preautophagosomal structures are visualized by Atg8a+ and Atg9+ signals respectively. anti-DsRed antibody immunostaining is used to amplify mCherry-Atg8a and anti-GFP is used to amplify Atg9-GFP. White dashed lines denote (i) motor axons and (ii) motor synaptic terminal boutons. Scale bars: 10 µm. (B) density of autophagosomes is quantified from motor axons and synaptic boutons. Number of animals in total; n = 15 (CTL) and n = 22 (30 R) for autophagic vesicle (Atg8a+) analysis, and n = 8 (CTL) and n = 9 (30 R) for preautophagosomal structure (Atg9+) analysis. (C) representative images of mitochondria in synaptic boutons from the indicated genotypes. Scale bars: 10 µm. (D) density of mitochondria is quantified by measuring mitochondrial area from motor synaptic boutons. Number of animals in total; n = 32 (CTL) and n = 27 (30 R). (E) representative synaptic boutons of the indicated genotypes without (20°C) or with (29°C) TrpA1 activation. Laval motor neurons are excited through activation of calcium permeable ion channel, TrpA1, by incubation at 29°C for either 30 min or 1 h. Synaptic terminal bouton is indicated by white angle bracket. Scale bars: 10 µm. (F) number of autophagosomes is quantified for autophagosomal density in a single terminal bouton. Number of animals in total; n = 14 (CTL in 20°C, 1 h), n = 5 (CTL in 29°C, 30 min), n = 17 (CTL in 29°C, 1 h), n = 12 (30 R in 20°C, 1 h), n = 4 (CTL in 29°C, 30 min) and n = 7 (30 R in 29°C, 1 h). Error bars indicate mean ± SEM. Significance is determined by unpaired two-tailed t-test (B and D), and by one-way ANOVA with Bonferroni’s multiple comparisons test (F). *p < 0.05, **p < 0.01, ***p < 0.001, and ns = not significant.
Figure 3.
Figure 3.
Autophagosomal maturation occurs normally in motor axons expressing 30 G4C2 repeats (30 R). (A) representative time-lapse images of axonal transport of amphisomes and autolysosomes in fly motor neurons. White angle brackets denote retrograde moving organelles that are visualized by co-expressing either mCherry-Atg8a with Rab7-GFP for amphisomes or mCherry-Atg8a with GFP-Lamp1 for autolysosomes. White dashed lines denote segmental nerves. Scale bars: 10 µm. Axonal transport of organelles is analyzed by measuring velocity (B) and run length (C). (D) quantitative ratio of organelle to autophagosome in motor axons. Number of animals in total; n = 22 (CTL for Atg8+ and Rab7+), n = 13 (CTL for Atg8a+ and Lamp1+), n = 13 (30 R for Atg8a+ and Rab7+) and n = 12 (30 R for Atg8a+ and Lamp1+). Error bars indicate mean ± SEM. Significance is determined by unpaired two-tailed t-test (B, C and D). ns = not significant.
Figure 4.
Figure 4.
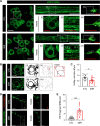
Expression of 30 G4C2 repeats (30 R) disrupts ER morphology throughout Drosophila larval motor neurons. (A) representative images of ER in motor neuronal soma (i and iv), axon (ii and v) and synaptic terminal (iii and vi) from the indicated genotypes. sfGFP-HDEL is used for imaging ER network. White angle brackets denote ER knots (iv), and ER discontinuity and fragmentation (v and vi). Scale bars: 10 µm (white) and 5 µm (red). (B) analysis of ER morphology and network in motor neuron cell bodies from the indicated genotypes. Images are binarized (i and iii) to acquire skeleton (ii and iv) of the ER network. Inset shows the skeleton of the ER network and three-way junctions (3WJs) between tubules (red circles). Scale bars: 5 µm. (C) in motor neuron cell bodies, ER network is quantified by measuring number of 3WJs per ER tubule length. Number of animals in total; n = 16 (CTL) and n = 19 (30 R). (D) representative images of ER and autophagosomes at the neuromuscular junction from indicated genotypes. White angle brackets denote terminal boutons. Scale bars: 10 µm and 5 µm (insets). (E) in motor synapses, ER structure is analyzed by measuring number of ER fragments per bouton. Number of animals in total; n = 14 (CTL) and n = 15 (30 R). Error bars indicate mean ± SEM. Significance is determined by unpaired two-tailed t-test (C and E). **p < 0.01 and ****p < 0.0001.
Figure 5.
Figure 5.
Expression of 30 G4C2 repeats (30 R) disrupts ER morphology specific to Drosophila motor neurons. (A) representative images of autophagosomes and ER in motor neuronal soma from the adult VNC. White angle bracket denotes ER knot and insets show the skeleton of the ER network from the indicated genotypes. Scale bars: 5 µm (white) and 1 µm (red). (B) density of autophagosomes is quantified from adult motor neuron cell bodies. Number of animals in total; n = 8 (CTL) and n = 17 (30 R). (C) in adult motor neuron cell bodies, ER network is quantified by measuring number of 3WJs per ER tubule length. Number of animals in total; n = 8 (CTL) and n = 17 (30 R). (D) representative images of ER in larval fat bodies and muscle cells from the indicated genotypes. Insets show the periodic structure of larval sarcoplasmic reticulum at horizontal (anteroposterior, i and iii) and vertical (lateral, ii and iv) axes. Scale bars: 10 µm. (E) signal intensity profiles of the sfGFP-HDEL are denoted from the dashed arrow lines in (D). The representative periodic distance of sarcoplasmic reticulum is indicated; 4.33 µm and 1.43 µm from control (i and ii) and 4.31 µm and 1.44 µm from 30 R (iii and iv) animals. Error bars indicate mean ± SEM. Significance is determined by unpaired two-tailed t-test (B and C). ****p < 0.0001.
Figure 6.
Figure 6.
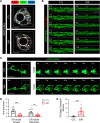
Expression of 30 G4C2 repeats (30 R) impairs ER dynamics in Drosophila motor neurons. (A) temporal color code of neuronal ER dynamics from the indicated genotypes. ER in motor neuronal soma was captured at 1 sec time intervals for 1 min. Single frames of pseudo-colored images were extracted from the time-lapse images for ER dynamics analysis; merged image of single ER network at indicated timepoint, t = 1 sec (red), t = 30 sec (green) and t = 60 sec (blue). With this representation, white ER tubules are static, whereas colored ER tubules are dynamic during the 1 min imaging. Reconstructed images are generated by Imaris 9.0.1 from the sections of 14.85 µm width (x) with 14.85 µm height (y). Scale bars: 5 µm. (B) axonal ER dynamic events from indicated genotypes. An example of ER tubule growth (red angle brackets), ER tubule retraction (blue angle brackets) and ER discontinuity (yellow angle brackets) are indicated. Axonal transport of autophagosomes (white angle brackets) is co-visualized with dynamic ER. Reconstructed images are generated by Imaris 9.0.1 from the sections of 25.27 µm width (x) with 9.95 µm height (y). Scale bars: 5 µm. (C) dynamics of neuronal ER in motor synaptic terminal from the indicated genotypes. An example of ER tubule growth (red angle brackets), ER tubule retraction (blue angle brackets) and ER fragmentation (yellow angle brackets) are indicated. Scale bars: 5 µm. Terminal ER dynamics is quantified by measuring number of events for ER tubule growth and retraction (D) and by measuring number of static ER particle per single bouton (E). Number of animals in total; n = 14 (CTL) and n = 15 (30 R). Error bars indicate mean ± SEM. Significance is determined by unpaired two-tailed t-test (D and E). ***p < 0.001 and ****p < 0.0001.
Figure 7.
Figure 7.
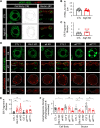
Expression of mutant ER membrane proteins inhibits autophagy in Drosophila motor neurons. (A) representative images of motor neuron ER in cell bodies (CB) and synaptic terminal boutons (BT) from the indicated genotypes. UAS-luciferase RNAi is used for control. Scale bars: 5 µm. ER morphology is analyzed by quantification of 3WJs in CB (B) and by quantification of ER fragments in BT (C). Number of animals in total; n = 11 (CTL) and n = 15 (Atg5 KD) for ER analysis in CB, and n = 7 (CTL) and n = 7 (Atg5 KD) for ER analysis in BT. (D) representative images of motor neuron ER and autophagosomes in cell bodies (CB) and synaptic terminal boutons (BT) from the indicated genotypes. UAS-luciferase RNAi is used for RNAi control (CTL 1), and UAS-lacZ is used for UAS overexpression control (CTL 2). White dashed lines denote motor neuron cell body and motor synaptic terminal. Scale bars: 5 µm. (E) in motor synapses, ER morphology is analyzed by quantifying the number of ER fragments in BT. Number of animals in total; n = 11 (CTL 1), n = 9 (Rtnl1 KD), n = 9 (atl KD), n = 10 (CTL 2), n = 8 (atlR192Q), and n = 6 (atlR214C). (F) density of autophagosomes is quantified from motor neuron CBs and BTs. Number of animals in total for CB/BT quantification; n = 16/7 (CTL 1), n = 11/7 (Rtnl1 KD), n = 14/9 (atl KD), n = 11/9 (CTL 2), n = 9/7 (atlR192Q), and n = 12/8 (atlR214C). Error bars indicate mean ± SEM. Significance is determined by unpaired two-tailed t-test (B and C), and by one-way ANOVA with Bonferroni’s multiple comparisons test (E and F). *p < 0.05, **p < 0.01 and ***p < 0.001.
Figure 8.
Figure 8.
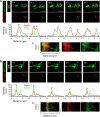
Developing autophagosomes co-migrate with ER at Drosophila terminal boutons. Time series of developing autophagomes with ER dynamics in terminal bouton of the distal motor axon. Two representative images are shown from the indicated genotypes, from control (A) and 30 R (B) animals. White angle brackets denote autophagosomal biogenesis events that co-localize and co-migrate with the ER tubule. Signal intensity profiles of line scans between mCherry-Atg8a and the sfGFP-HDEL are denoted from the dashed arrow lines, and black angle brackets denote the peak of Atg8a+ signals corresponding to white angle brackets on the images. Kymographs are generated from the corresponding dashed arrow lines on the images to display dynamics of ER and terminal autophagosomes de novo, from control (A, (i)) and 30 R (B, (ii)). Scale bars: 5 µm (horizontal) and 10 sec (vertical).
Figure 9.
Figure 9.
Schematic model for autophagosome biogenesis from dynamic ER tubules in healthy synapses and dysfunction in C9-ALS-FTD motor neurons. ER network is continuously distributed throughout the cytosol within motor neurons, including cell body, axon and presynaptic terminals. In healthy neurons, the ER is highly dynamic, with tubular extensions and retractions. Developing autophagosomes primarily form in distal axons from dynamic ER tubules in presynaptic terminals. In C9-ALS-FTD neurons, the ER is rigid, forming membrane “knots”, tubule discontinuity, and fragmentation. This disrupted ER dynamics in C9-ALS-FTD neurons impairs formation of autophagosomes at synaptic boutons without impeding autophagosome maturation or retrograde transport. These defects in organelle dynamics eventually cause a reduction of autophagic vesicles in neuronal cell body (Cunningham KM et al., Elife 2020). ER; endoplasmic reticulum, AP; autophagosome, MT; microtubule.

Similar articles

Cited by

References

    1. Damme M, Suntio T, Saftig P, et al. Autophagy in neuronal cells: general principles and physiological and pathological functions. Acta Neuropathol. 2015. Mar;129(3):337–362. doi: 10.1007/s00401-014-1361-4 - DOI - PubMed
    1. Maday S. Mechanisms of neuronal homeostasis: autophagy in the axon. Brain Res. 2016. Oct 15;1649(Pt B):143–150. - PMC - PubMed
    1. Stavoe AKH, Holzbaur ELF. Autophagy in neurons. Annu Rev Cell Dev Biol. 2019. Oct 6;35(1):477–500. - PMC - PubMed
    1. Stavoe AKH, Holzbaur ELF. Axonal autophagy: mini-review for autophagy in the CNS. Neurosci Lett. 2019. Apr 1;697:17–23. doi: 10.1016/j.neulet.2018.03.025. - DOI - PMC - PubMed
    1. Komatsu M, Waguri S, Chiba T, et al. Loss of autophagy in the central nervous system causes neurodegeneration in mice. Nature. 2006. Jun 15;441(7095):880–884. - PubMed

Publication types

MeSH terms

Substances

LinkOut - more resources