. 2023 Jul 25;26(8):107471.
doi: 10.1016/j.isci.2023.107471. eCollection 2023 Aug 18.

Protein supplementation changes gut microbial diversity and derived metabolites in subjects with type 2 diabetes

Affiliations

Protein supplementation changes gut microbial diversity and derived metabolites in subjects with type 2 diabetes

Ilias Attaye et al. iScience. .

Abstract

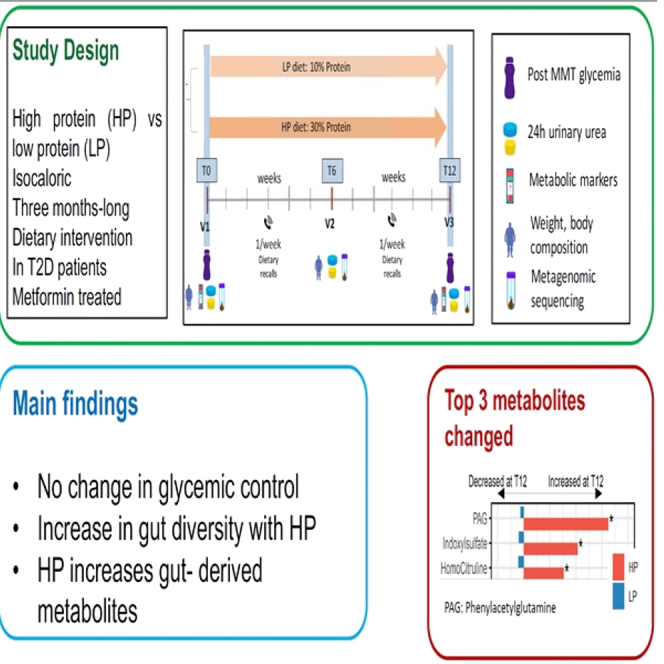
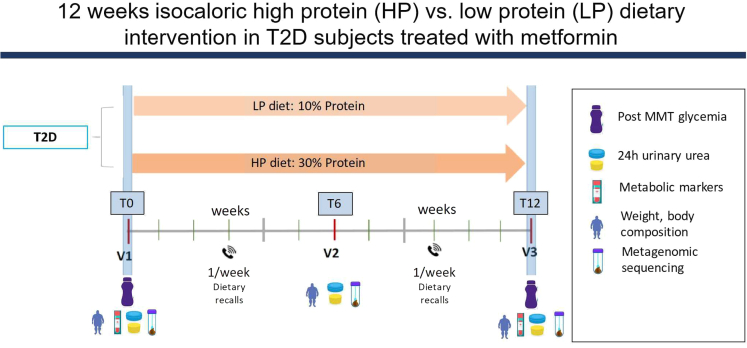
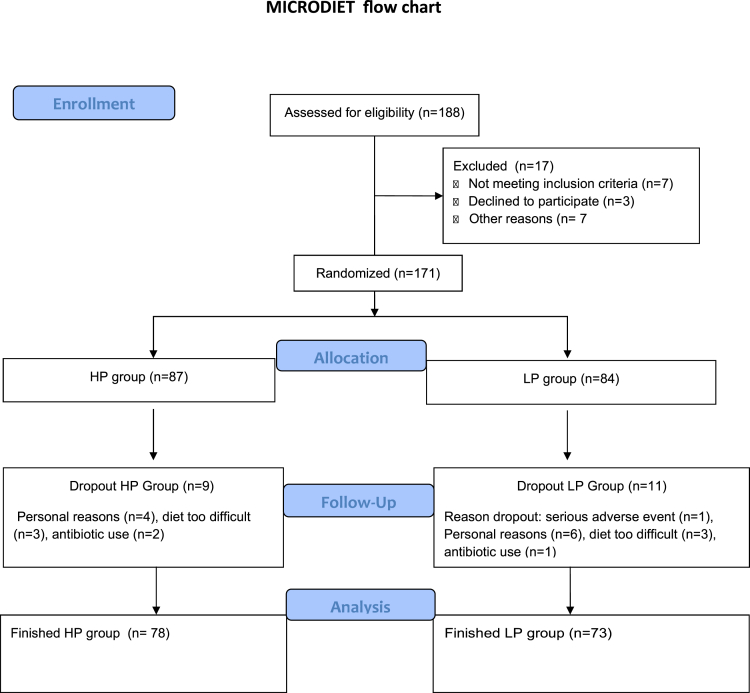
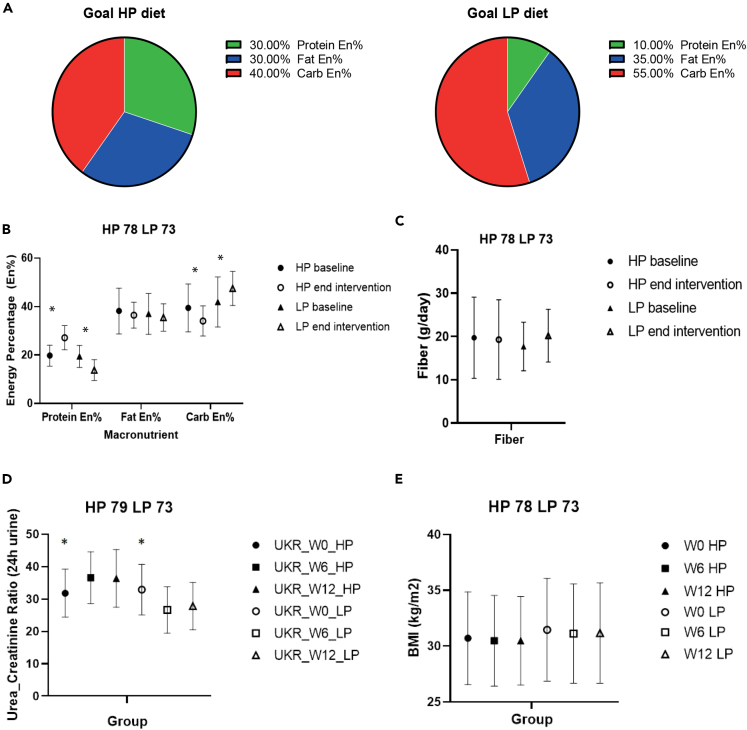
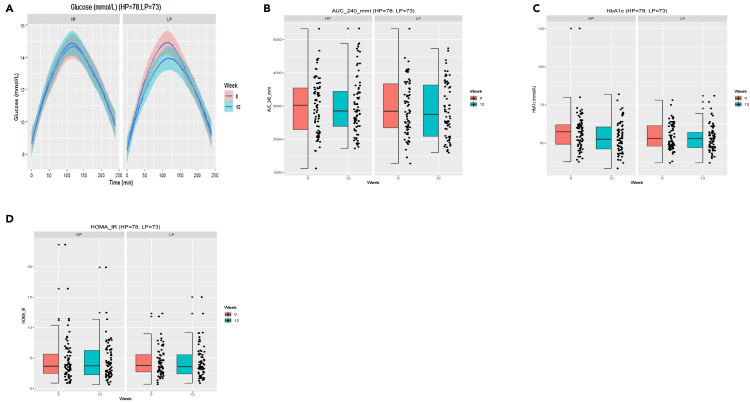
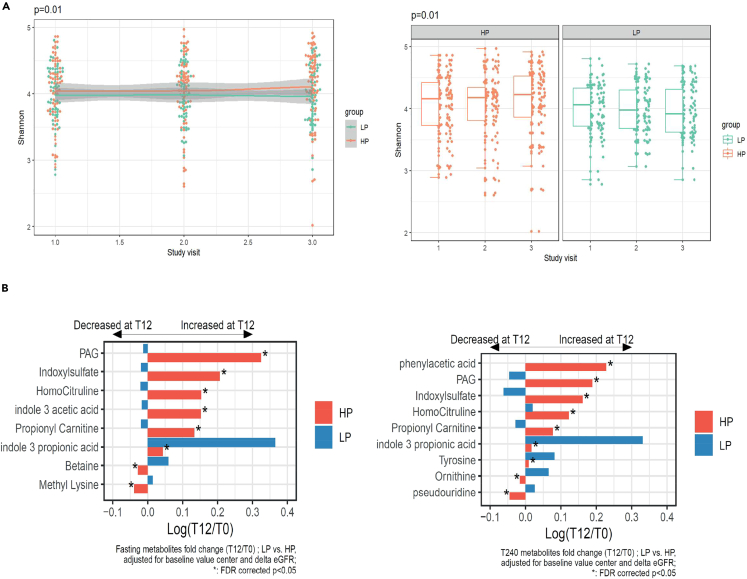
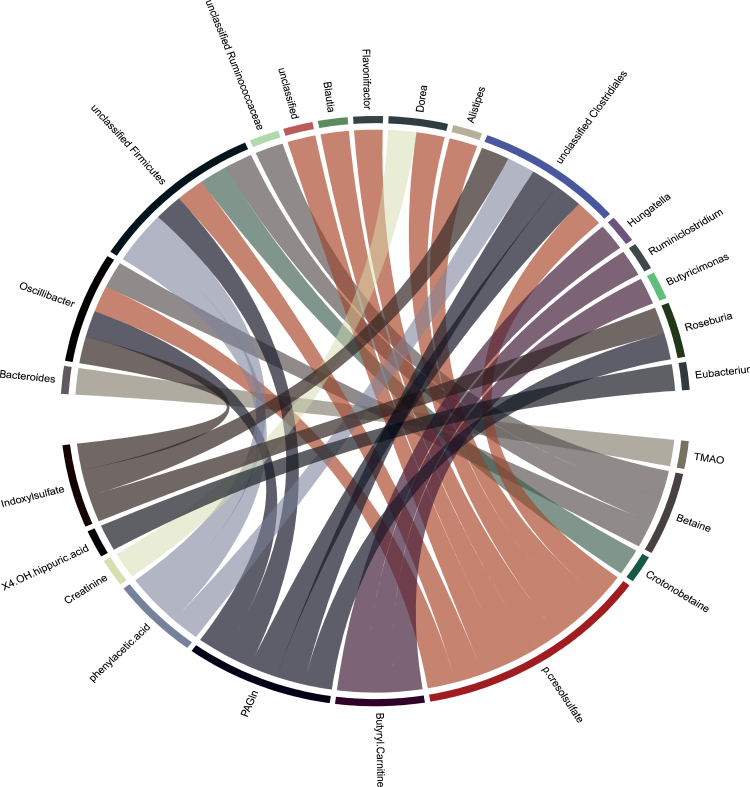
High-protein diets are promoted for individuals with type 2 diabetes (T2D). However, effects of dietary protein interventions on (gut-derived) metabolites in T2D remains understudied. We therefore performed a multi-center, randomized-controlled, isocaloric protein intervention with 151 participants following either 12-week high-protein (HP; 30Energy %, N = 78) vs. low-protein (LP; 10 Energy%, N = 73) diet. Primary objectives were dietary effects on glycemic control which were determined via glycemic excursions, continuous glucose monitors and HbA1c. Secondary objectives were impact of diet on gut microbiota composition and -derived metabolites which were determined by shotgun-metagenomics and mass spectrometry. Analyses were performed using delta changes adjusting for center, baseline, and kidney function when appropriate. This study found that a short-term 12-week isocaloric protein modulation does not affect glycemic parameters or weight in metformin-treated T2D. However, the HP diet slightly worsened kidney function, increased alpha-diversity, and production of potentially harmful microbiota-dependent metabolites, which may affect host metabolism upon prolonged exposure.

Keywords: Dietary supplement; Health sciences; Human metabolism; Microbiome.


Conflict of interest statement

M.N. is in the SAB of Caelus health; however, this is not relevant for the current paper. S.L.H. reports being named as co-inventor on pending and issued patents held by the Cleveland Clinic relating to cardiovascular diagnostics and therapeutics, being a paid consultant formerly for Procter & Gamble in the past, and currently with Zehna Therapeutics, and both receiving research funds from Procter & Gamble, Zehna Therapeutics, and Roche Diagnostics, and being eligible to receive royalty payments for inventions or discoveries related to cardiovascular diagnostics or therapeutics from Procter & Gamble, Zehna Therapeutics, and Cleveland HeartLab, a wholly owned subsidiary of Quest Diagnostics.

Figures

None
Graphical abstract
Figure 1
Figure 1
Study design MICRODIET trial Subjects were randomized to follow either a high protein (HP) or low protein (LP) diet for 12 weeks. Study visits were performed at week 0 (baseline), week 6, and week 12 (end of intervention). A mixed-meal test (MMT) was performed at week 0 and week 12 and plasma for metabolomics was also obtained. Dietary adherence was observed through weekly contact with a dietician and the use of weekly food diaries. Before each study visit subjects collected 24-h urine and as well as 24-h fresh feces.
Figure 2
Figure 2
CONSORT flowchart inclusion MIRCODIET Trial.
Figure 3
Figure 3
Overview dietary adherence and BMI throughout the study period (A) Shows the target diet composition in the high protein (HP) and low protein (LP) group. (B) Self-reported macronutrient consumption at baseline and end of the study period. Significant differences in protein energy percentage (En%) and carbohydrate intake between baseline and end of intervention period in HP and LP group. The effect of the intervention (HP vs. LP) on changes from baseline (delta between week 12 and week 0) was analyzed in a linear regression model adjusting for baseline values and center. (C) Fiber intake between HP and LP group throughout the intervention (ns). (D) 24-h urine urea/creatinine ratios. In the HP group statistical significant increase between week 0 and week 6 and week 0 and week 1, no statistical significance between week 6–week 12. In the LP group statistical significant decrease between week 0 and week 6 and week 0 and week 12, no statistical significance between week 6–week 12. Data were analyzed using a linear-mixed effects model with post-hoc Dunn’s correction. (E) BMI (body-mass index) between HP and LP group throughout the intervention (ns). All data are presented as mean ± SD. A p < 0.05 was considered statistically significant (indicated with an ∗).
Figure 4
Figure 4
Effect of dietary intervention on glycemic parameters (A) Glucose excursions following a mixed-meal test (MMT) at week 0 and week 12 for 240 min. Data are represented as mean ± SD, no significant changes between the HP or LP group. (B) Area under the curve (AUC) of MMT test performed at baseline and week 12 (ns). (C) No significant effect of dietary intervention on HbA1c between week 0 and week 12. (D) No significant changes in Homeostatic Model Assessment for Insulin Resistance (HOMA-IR) due to the dietary intervention at baseline and week 12. The effect of the intervention (HP vs. LP) on changes from baseline (delta between week 12 and week 0) was analyzed in a linear regression model adjusting for baseline values and center.
Figure 5
Figure 5
Effect of dietary intervention an alpha diversity (A) Effect of dietary intervention an alpha diversity (Shannon index). A high protein diet increased Shannon index (p = 0.01). (B) Fasting plasma metabolite levels and post-prandial metabolite levels 240 minutes after a mixed meal test. A high protein diet induces several changes in plasma metabolome both fasting (left panel) and 240 min post MMT (right panel). Metabolite fold changes were analyzed after log transformation in a linear model correcting for baseline value, center and delta estimated glomerular filtration rate (eGFR) . All analyses were corrected for false discovery rate (FDR). PAG: Phenylacetylglutamine.
Figure 6
Figure 6
Associations between individual taxa and plasma metabolite levels Displayed are only significant associations using linear mixed effect models and false discovery rate (FDR) correction.

References

    1. Guo F., Moellering D.R., Garvey W.T. The progression of cardiometabolic disease: Validation of a new cardiometabolic disease staging system applicable to obesity. Obesity. 2014;22:110–118. doi: 10.1002/oby.20585. - DOI - PMC - PubMed
    1. Khan M.A.B., Hashim M.J., King J.K., Govender R.D., Mustafa H., Al Kaabi J. Epidemiology of Type 2 diabetes - Global burden of disease and forecasted trends. J. Epidemiol. Glob. Health. 2020;10:107–111. doi: 10.2991/JEGH.K.191028.001. - DOI - PMC - PubMed
    1. Guariguata L., Whiting D.R., Hambleton I., Beagley J., Linnenkamp U., Shaw J.E. Global estimates of diabetes prevalence for 2013 and projections for 2035. Diabetes Res. Clin. Pract. 2014;103:137–149. doi: 10.1016/j.diabres.2013.11.002. - DOI - PubMed
    1. Roth G.A., Mensah G.A., Johnson C.O., Addolorato G., Ammirati E., Baddour L.M., Barengo N.C., Beaton A.Z., Benjamin E.J., Benziger C.P., et al. Global Burden of Cardiovascular Diseases and Risk Factors, 1990–2019. J. Am. Coll. Cardiol. 2020;76:2982–3021. doi: 10.1016/j.jacc.2020.11.010. - DOI - PMC - PubMed
    1. Galicia-Garcia U., Benito-Vicente A., Jebari S., Larrea-Sebal A., Siddiqi H., Uribe K.B., Ostolaza H., Martín C. Pathophysiology of type 2 diabetes mellitus. Int. J. Mol. Sci. 2020;21:6275–6334. doi: 10.3390/ijms21176275. - DOI - PMC - PubMed