. 2023 Aug 3:17:1106573.
doi: 10.3389/fnins.2023.1106573. eCollection 2023.

Environmental carcinogens disproportionally mutate genes implicated in neurodevelopmental disorders

Affiliations

Environmental carcinogens disproportionally mutate genes implicated in neurodevelopmental disorders

Brennan H Baker et al. Front Neurosci. .

Abstract

Introduction: De novo mutations contribute to a large proportion of sporadic psychiatric and developmental disorders, yet the potential role of environmental carcinogens as drivers of causal de novo mutations in neurodevelopmental disorders is poorly studied.

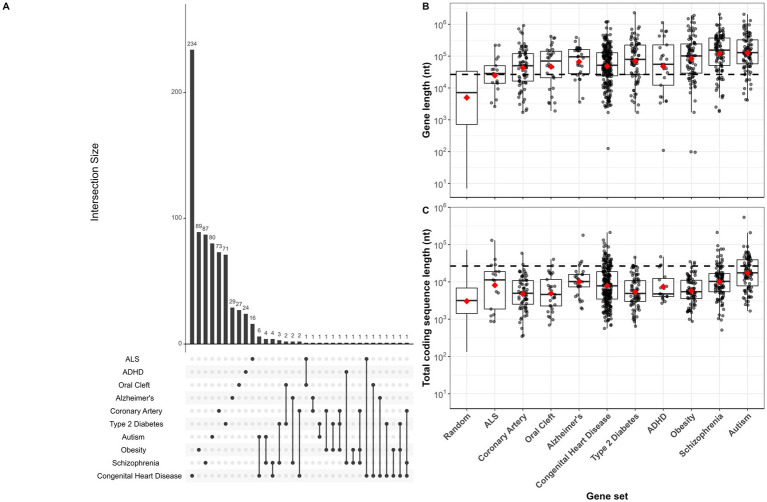
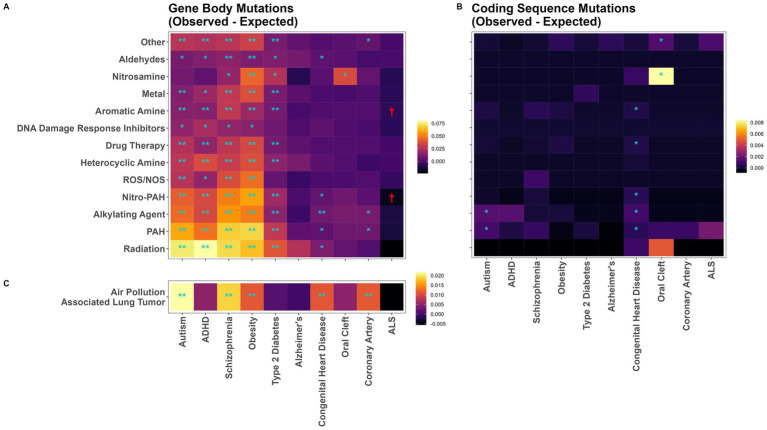
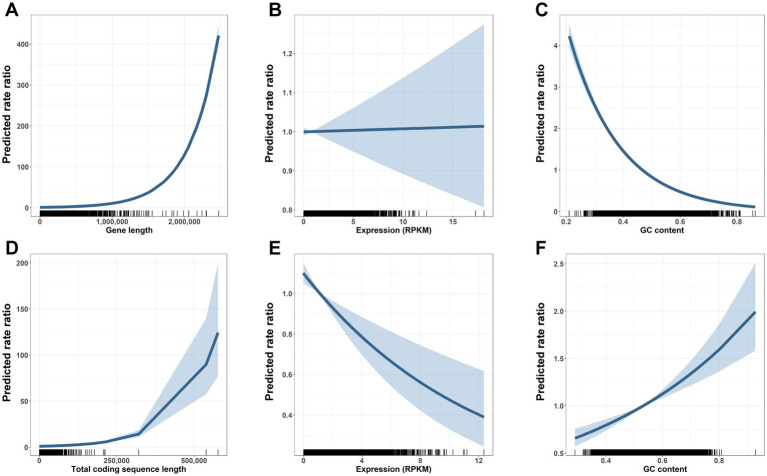
Methods: To explore environmental mutation vulnerability of disease-associated gene sets, we analyzed publicly available whole genome sequencing datasets of mutations in human induced pluripotent stem cell clonal lines exposed to 12 classes of environmental carcinogens, and human lung cancers from individuals living in highly polluted regions. We compared observed rates of exposure-induced mutations in disease-related gene sets with the expected rates of mutations based on control genes randomly sampled from the genome using exact binomial tests. To explore the role of sequence characteristics in mutation vulnerability, we modeled the effects of sequence length, gene expression, and percent GC content on mutation rates of entire genes and gene coding sequences using multivariate Quasi-Poisson regressions.

Results: We demonstrate that several mutagens, including radiation and polycyclic aromatic hydrocarbons, disproportionately mutate genes related to neurodevelopmental disorders including autism spectrum disorders, schizophrenia, and attention deficit hyperactivity disorder. Other disease genes including amyotrophic lateral sclerosis, Alzheimer's disease, congenital heart disease, orofacial clefts, and coronary artery disease were generally not mutated more than expected. Longer sequence length was more strongly associated with elevated mutations in entire genes compared with mutations in coding sequences. Increased expression was associated with decreased coding sequence mutation rate, but not with the mutability of entire genes. Increased GC content was associated with increased coding sequence mutation rates but decreased mutation rates in entire genes.

Discussion: Our findings support the possibility that neurodevelopmental disorder genetic etiology is partially driven by a contribution of environment-induced germ line and somatic mutations.

Keywords: autism; carcinogen; de novo mutation; mutagenesis; neurodevelopmental disorders; somatic mutation.


Conflict of interest statement

The authors declare that the research was conducted in the absence of any commercial or financial relationships that could be construed as a potential conflict of interest.

Figures

Figure 1
Figure 1
(A) Gene set intersection plot. Horizontal bars depict gene set sizes. Gene sets included in each intersection are indicated by a single or connected dot(s), and sizes of the intersections are indicated by vertical bars. For single, unconnected dots, vertical bars indicate the number of genes exclusive to that set. For example, among 253 Congenital Heart Disease genes, 6 overlapped with Autism genes, while 234 had no overlap with other gene sets. Intersections with zero overlap not shown. (B,C) Sequence length boxplots with median and 1.5 interquartile range (IQR) whiskers shown for each disease implicated gene set for entire genes (B) and coding sequence (C). Red diamonds indicate mean sequence length for each set indicated on x-axis, and dashed black line across entire plot indicates mean gene length of randomly mutated genes (modeled by randomly sampling (i.e., mutating) 100,000 nucleotides from all genes or all CDS in the human genome). Gene and CDS boxplots also shown for all 300,000 randomly sampled sequences (1,000 sets of 300 genes or CDS).
Figure 2
Figure 2
Thousand sets of genes were randomly sampled for each gene set size ranging from 10 to 300 in intervals of 10. For each random gene set size, the number of mutations in subclones treated with the radiation class of chemicals was determined. Mean mutations per subclone and mutations per gene per subclone were plotted against the random set size.
Figure 3
Figure 3
Mutation vulnerability of disease associated genes to various carcinogens. Heatmaps of observed minus expected mutations in disease gene sets for (A) mutations in gene body sequence following chemical treatment in iPSC, (B) mutations in coding sequences following chemical treatment in iPSC, and (C) mutations in 14 human lung cancers from individuals living in highly polluted regions. Significant levels from exact binomial tests. Higher mutation rates: *p < 0.05; **Bonferroni-adjusted p < 0.05. Lower mutation rates: p < 0.05.
Figure 4
Figure 4
Gene length and other determinants of mutation vulnerability across gene bodies and coding sequences. Gene body Quasi-Poisson model results (A–C) depict centered rate ratios (lines) and 95% confidence intervals (shaded regions) at each value of x (i.e., panel A shows the predicted mutation rate ratio of a gene with gene length indicated on the x-axis versus a gene with length, expression, and GC content set to the mean). Distribution of gene characteristics shown along the x axis, with one mark per observation. Longer gene length is associated with higher mutation frequencies across carcinogen treated cells (A). Expression is not associated with altered mutation risk across gene bodies (B). Higher GC content is associated with decreased mutation risk across gene bodies (C). Coding sequence (CDS) Quasi-Poisson model results (D–F) depict centered rate ratios (lines) and 95% confidence intervals (shaded regions) at each value of x. Distribution of CDS characteristics shown along the x axis, with one mark per observation. Longer coding sequence is associated with a modestly increased risk of mutation (D). Higher gene expression is associated with reduced CDS mutations (E). In contrast to the gene body, higher GC content is associated with increased risk of CDS mutation (F).
Figure 5
Figure 5
Nucleotide content of 7-mers centered on each gene body (A) or coding sequence (B) mutation among all single base substitutions identified by Kucab et al. (2019), and for 50,000 7-mers randomly sampled from the human genome (C).
Figure 6
Figure 6
Nucleotide content of 7-mers centered on each gene body (A) or coding sequence (B) mutation among all single base substitutions identified by Kucab et al. (2019), stratified by chemical class.
Figure 7
Figure 7
COSMIC single base substitution signatures for de novo mutations in individuals living with autism spectrum disorders (ASD) and their family members as controls (ASD–; Feliciano et al., 2018), schizophrenia (Fromer et al., 2014), and intellectual disability (De Ligt et al., 2012).
Figure 8
Figure 8
Average DNA damage enrichment following polycyclic aromatic hydrocarbon (PAH) treatment of GM12878 cells across each gene body (A,B) or coding sequence (C,D) in each of 10 disease-related gene sets. Enrichment values indicate the number of tXR-seq counts per gene/coding sequence, controlling for sequence length. Boxplots show median and interquartile range (IQR) with 1.5 IQR whiskers. Gene sets are ordered left–right within each panel from highest to lowest mean enrichment (red diamonds). Data come from two samples of treated cells from Li et al. (2017).

Similar articles

Cited by

References

    1. Abrahams B. S., Arking D. E., Campbell D. B., Mefford H. C., Morrow E. M., Weiss L. A., et al. . (2013). SFARI gene 2.0: a community-driven knowledgebase for the autism spectrum disorders (ASDs). Mol. Autism. 4:36. doi: 10.1186/2040-2392-4-36, PMID: - DOI - PMC - PubMed
    1. Association T.A. (2019). Genetics [online]. Washington, DC: The ALS Association.
    1. Bailey M. H., Tokheim C., Porta-Pardo E., Sengupta S., Bertrand D., Weerasinghe A., et al. . (2018). Comprehensive characterization of cancer driver genes and mutations. Cell 173, 371–385. e318. doi: 10.1016/j.cell.2018.02.060 - DOI - PMC - PubMed
    1. Beaty T. H., Marazita M. L., Leslie E. J. J. F. (2016). Genetic factors influencing risk to orofacial clefts: today’s challenges and tomorrow’s opportunities. F1000Res:5: 2800. doi: 10.12688/f1000research.9503.1 - DOI - PMC - PubMed
    1. Bellinger D. C. (2012). A strategy for comparing the contributions of environmental chemicals and other risk factors to neurodevelopment of children. Environ. Health Perspect. 120, 501–507. doi: 10.1289/ehp.1104170, PMID: - DOI - PMC - PubMed