. 2023 Aug 3:17:1195388.
doi: 10.3389/fnins.2023.1195388. eCollection 2023.

Flexible structure learning under uncertainty

Affiliations

Flexible structure learning under uncertainty

Rui Wang et al. Front Neurosci. .

Abstract

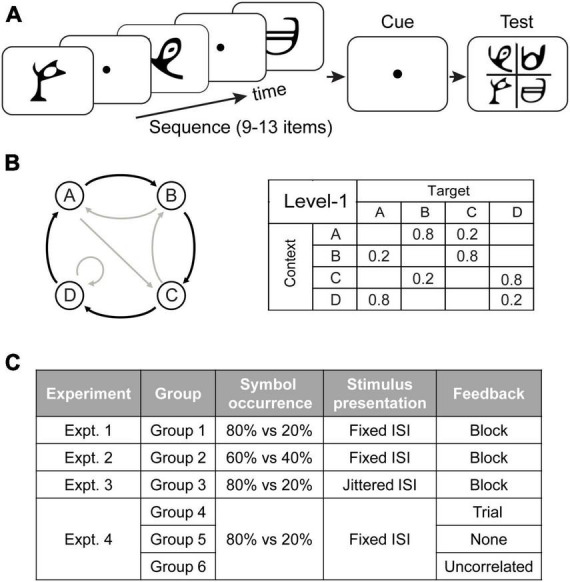
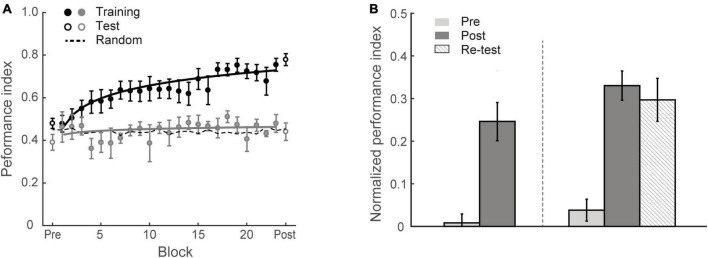
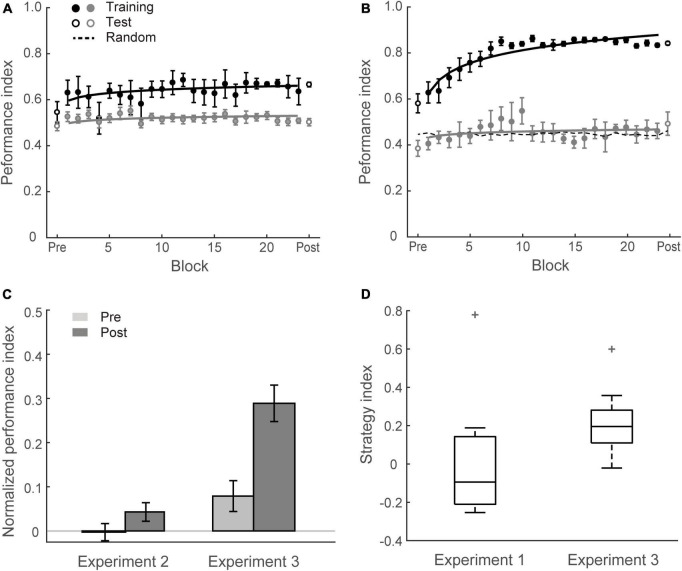
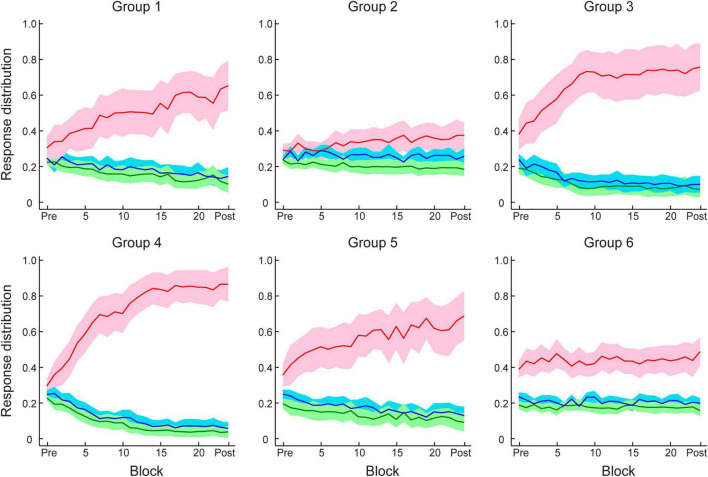
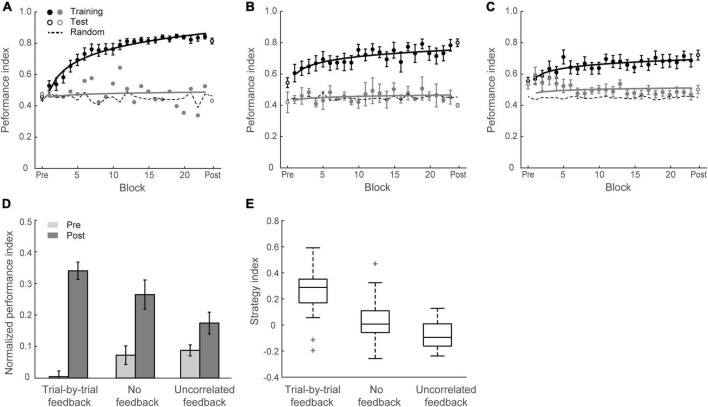
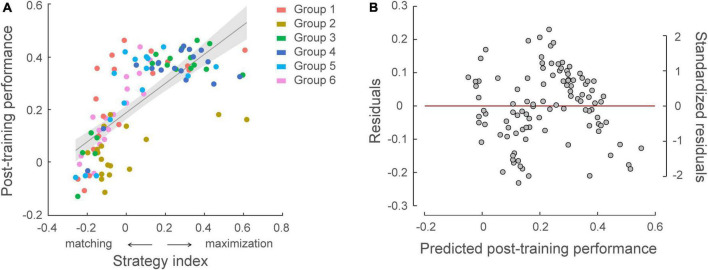
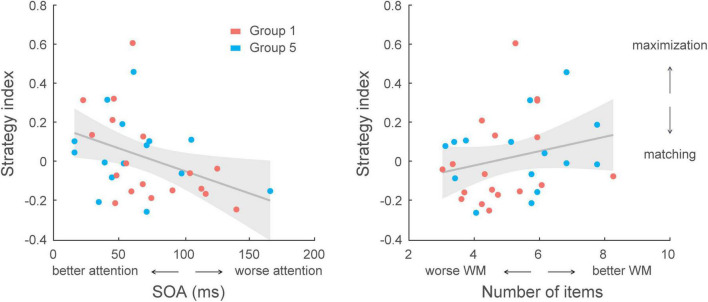
Experience is known to facilitate our ability to interpret sequences of events and make predictions about the future by extracting temporal regularities in our environments. Here, we ask whether uncertainty in dynamic environments affects our ability to learn predictive structures. We exposed participants to sequences of symbols determined by first-order Markov models and asked them to indicate which symbol they expected to follow each sequence. We introduced uncertainty in this prediction task by manipulating the: (a) probability of symbol co-occurrence, (b) stimulus presentation rate. Further, we manipulated feedback, as it is known to play a key role in resolving uncertainty. Our results demonstrate that increasing the similarity in the probabilities of symbol co-occurrence impaired performance on the prediction task. In contrast, increasing uncertainty in stimulus presentation rate by introducing temporal jitter resulted in participants adopting a strategy closer to probability maximization than matching and improving in the prediction tasks. Next, we show that feedback plays a key role in learning predictive statistics. Trial-by-trial feedback yielded stronger improvement than block feedback or no feedback; that is, participants adopted a strategy closer to probability maximization and showed stronger improvement when trained with trial-by-trial feedback. Further, correlating individual strategy with learning performance showed better performance in structure learning for observers who adopted a strategy closer to maximization. Our results indicate that executive cognitive functions (i.e., selective attention) may account for this individual variability in strategy and structure learning ability. Taken together, our results provide evidence for flexible structure learning; individuals adapt their decision strategy closer to probability maximization, reducing uncertainty in temporal sequences and improving their ability to learn predictive statistics in variable environments.

Keywords: decision strategy; perceptual decisions; structure learning; uncertainty; vision.


Conflict of interest statement

The authors declare that the research was conducted in the absence of any commercial or financial relationships that could be construed as a potential conflict of interest.

Figures

FIGURE 1
FIGURE 1
Trial and experimental design. (A) A total of 9 to 13 symbols were presented one at a time in a continuous stream followed by a cue and the test display. (B) Sequence design. For the first-order Markov model (Level1), a diagram indicates states (circles) and transitional probabilities (black arrow: high probability, e.g., 80%; gray arrow: low probability, e.g., 20%). Transitional probabilities are shown in a four-by-four conditional probability matrix, with rows indicating temporal contexts and columns indicating the corresponding targets. (C) Experimental design. In Experiment 1 (Group 1), a sequence of symbols with context-conditional probability of 80% vs. 20% were presented one after another with a fixed ISI. Block feedback (i.e., score in the form of performance index) was provided during training. In Experiment 2 (Group 2), the symbol transitional probability was modified to 60% vs. 40%. In Experiment 3 (Group 3), visual stimuli appeared in a stream separated by jittered ISI. In Experiment 4, we manipulated feedback: Group 4 was trained with trial-by-trial feedback based on the symbol expected by the pre-defined sequences, Group 5 was not provided with any feedback, and Group 6 was trained with random feedback which was uncorrelated to the participants’ responses.
FIGURE 2
FIGURE 2
Experiment 1. (A) Behavioral performance. Performance index is shown across training (solid circles) blocks, pre-training test and post-training test (open circles). Data are fitted separately for participants who improved during training (learners, black symbols, N = 13) and those who did not improve (weaker learners, gray symbols, N = 5). Random guess baseline is indicated by dotted lines. (B) Normalized PI for test sessions. Data are shown for all participants in Group 1 (N = 18, left panel) and those who completed re-test session (N = 10, right panel). Performance is shown before (gray bars), immediately after (black bars) and 4 weeks after training (dotted bars). Error bars indicate standard error of the mean.
FIGURE 3
FIGURE 3
Experiment 2 and Experiment 3. (A) Mean Performance index across test and training blocks for Group 2 (Experiment 2). Data are fitted separately for participants who improved during training (learners, black symbols, N = 5) and those who did not improve (weak learners, gray symbols, N = 13). (B) Mean Performance index across test and training blocks for Group 3 (Experiment 3). Data are fitted separately for participants who improved during training (black symbols, N = 13) and those who did not improve (gray symbols, N = 5). (C) Normalized PI pre- and post-training for Group 2 and Group 3. Data are shown for all participants. Error bars indicate standard error of the mean. (D) Box plots of strategy index show individual variability for learners in Group 3 and Group 1 (Experiment 1). The upper and lower error bars display the minimum and maximum data values, and the central boxes represent the interquartile range (25th–75th percentiles). The thick line in the central boxes represents the median. Crosses denote outliers.
FIGURE 4
FIGURE 4
Participant response distributions for conditional probabilities of context–target contingencies across test and training blocks in Experiment 1–4. Red and blue lines indicate the conditional probabilities derived from participant responses of the frequent (e.g., 80%) and infrequent (e.g., 20%) symbols, respectively, for the given contexts. Green lines indicate the averaged probability of responding to one of the two symbols that were not allowed as next symbols for the given contexts. Solid lines indicate mean across participants and shading indicates 95% CI.
FIGURE 5
FIGURE 5
Experiment 4. (A) Mean Performance index across blocks for Group 4 (trial-by-trial feedback). Data are fitted separately for participants who improved during training (learners, black symbols, N = 17) and one participant who did not improve (weak learners, gray symbols). (B) Mean Performance index across blocks for Group 5 (no feedback). Data are fitted separately for participants who improved during training (N = 12) and those who did not improve (N = 3). (C) Mean Performance index across blocks for Group 6 (uncorrelated feedback). Data are fitted separately for participants who improved during training (N = 10) and those who did not improve (N = 8). (D) Normalized PI for test sessions in Groups 4, 5, and 6. Data are shown for all participants. Error bars indicate standard error of the mean. (E) Box plots of strategy index show individual variability per group.
FIGURE 6
FIGURE 6
Relating individual decision strategy to learning performance across participants in all groups (N = 105). (A) Significant correlations of individual decision strategy and post-training performance, that is normalized performance index after training [r = 0.717, CI = (0.62, 0.80)]. A skipped Pearson correlation analysis using the Robust correlation toolbox (Pernet et al., 2012) replicated this significant positive correlation following exclusion of five bivariate outliers [r = 0.790, CI = (0.72, 0.85)]. Strategy-index values close to zero indicate a strategy closer to matching, while higher positive values indicate a strategy closer to maximization. The color of the dots indicates participant group. (B) Residual plot of multiple regression analysis with group membership adjusted. Residuals were plotted against the post-training performance predicted from the multiple regression model, validating the assumptions of linearity and homoscedasticity.
FIGURE 7
FIGURE 7
Correlating cognitive skills with decision strategy across participants in Group 1 and Group 5 (N = 33). Left, correlation of selective attention scores with strategy index. A lower score (SOA: stimulus onset asynchrony; i.e., shorter display duration) indicates better performance in the selective attention task that relates to decision strategy closer to maximization [r = –0.394, CI = (–0.59, –0.20)]. Right, correlation of working memory (WM) scores with strategy index. A higher score (larger number of items in the display) indicates better performance in the working memory task. However, no significant correlation was found between working memory capacity and decision strategy [r = 0.246, CI = (0.01, 0.49)].

Similar articles

Cited by

References

    1. Acerbi L., Vijayakumar S., Wolpert D. M. (2014). On the origins of suboptimality in human probabilistic inference. PLoS Comput. Biol. 10:e1003661. 10.1371/journal.pcbi.1003661 - DOI - PMC - PubMed
    1. Ambrus G. G., Vékony T., Janacsek K., Trimborn A. B. C., Kovács G., Nemeth D. (2020). When less is more: Enhanced statistical learning of non-adjacent dependencies after disruption of bilateral DLPFC. J. Mem. Lang. 114:104144. 10.1016/j.jml.2020.104144 - DOI
    1. Arciuli J. (2017). The multi-component nature of statistical learning. Philos. Trans. R. Soc. Lond. B Biol. Sci. 372:20160058. 10.1098/rstb.2016.0058 - DOI - PMC - PubMed
    1. Aslin R. N., Newport E. L. (2012). Statistical learning from acquiring specific items to forming general rules. Curr. Direct. Psychol. Sci. 21 170–176. 10.1177/0963721412436806 - DOI - PMC - PubMed
    1. Awh E., Vogel E. K., Oh S. H. (2006). Interactions between attention and working memory. Neuroscience 139 201–208. 10.1016/j.neuroscience.2005.08.023 - DOI - PubMed

LinkOut - more resources