. 2023 Aug 2:14:1181370.
doi: 10.3389/fimmu.2023.1181370. eCollection 2023.

The signature of cuproptosis-related immune genes predicts the tumor microenvironment and prognosis of prostate adenocarcinoma

Affiliations

The signature of cuproptosis-related immune genes predicts the tumor microenvironment and prognosis of prostate adenocarcinoma

Kai Yao et al. Front Immunol. .

Abstract

Background: Cuproptosis plays a crucial role in cancer, and different subtypes of cuproptosis have different immune profiles in prostate adenocarcinoma (PRAD). This study aimed to investigate immune genes associated with cuproptosis and develop a risk model to predict prognostic characteristics and chemotherapy/immunotherapy responses of patients with PRAD.

Methods: The CIBERSORT algorithm was used to evaluate the immune and stromal scores of patients with PRAD in The Cancer Genome Atlas (TCGA) cohort. Validation of differentially expressed genes DLAT and DLD in benign and malignant tissues by immunohistochemistry, and the immune-related genes of DLAT and DLD were further screened. Univariable Cox regression were performed to select key genes. Least absolute shrinkage and selection operator (LASSO)-Cox regression analyse was used to develop a risk model based on the selected genes. The model was validated in the TCGA, Memorial Sloan-Kettering Cancer Center (MSKCC) and Gene Expression Omnibus (GEO) datasets, as well as in this study unit cohort. The genes were examined via functional enrichment analysis, and the tumor immune features, tumor mutation features and copy number variations (CNVs) of patients with different risk scores were analysed. The response of patients to multiple chemotherapeutic/targeted drugs was assessed using the pRRophetic algorithm, and immunotherapy was inferred by the Tumor Immune Dysfunction and Exclusion (TIDE) and immunophenoscore (IPS).

Results: Cuproptosis-related immune risk scores (CRIRSs) were developed based on PRLR, DES and LECT2. High CRIRSs indicated poor overall survival (OS), disease-free survival (DFS) in the TCGA-PRAD, MSKCC and GEO datasets and higher T stage and Gleason scores in TCGA-PRAD. Similarly, in the sample collected by the study unit, patients with high CRIRS had higher T-stage and Gleason scores. Additionally, higher CRIRSs were negatively correlated with the abundance of activated B cells, activated CD8+ T cells and other stromal or immune cells. The expression of some immune checkpoints was negatively correlated with CRIRSs. Tumor mutational burden (TMB), mutant-allele tumor heterogeneity (MATH) and copy number variation (CNV) scores were all higher in the high-CRIRS group. Multiple chemotherapeutic/targeted drugs and immunotherapy had better responsiveness in the low-CRIRS group.

Conclusion: Overall, lower CRIRS indicated better response to treatment strategies and better prognostic outcomes.

Keywords: LECT2; PrlR; cuproptosis; des; prostate cancer.


Conflict of interest statement

The authors declare that the research was conducted in the absence of any commercial or financial relationships that could be construed as a potential conflict of interest.

Figures

Figure 1
Figure 1
Venn diagram of the CR-IRGs screening process.
Figure 2
Figure 2
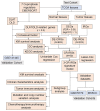
Flow chart of the analysis process.
Figure 3
Figure 3
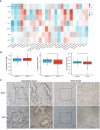
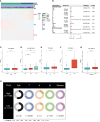
Classification of patients with PRAD in TCGA cohort according to the expression of DLAT and DLD. (A) Association of cuproptosis-related genes with the results of CIBERSORT. (B) Comparison of the expression of PDHB, DLAT and DLD between normal and PRAD tissues. (C) The protein levels of DLAT and DLD in prostate hyperplasia and prostate cancer clinical tissues were examined by immunohistochemistry. * P < 0.05, ** P < 0.01, *** P < 0.001.
Figure 4
Figure 4
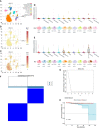
The expression of DLAT and DLD in immune cells in the GSE141445 dataset. (A) UMAP diagram of 13 samples. (B, C) UMAP distribution diagram showed the relative expression of DLAT and DLD in each cell. (D, E) Violin diagram showed the relative expression of DLAT and DLD in 8 types of cells. (F, G) Consensus matrix heat map defining two clusters (k = 2) and their correlation area. (H) Kaplan–Meier curves of overall survival in the two clusters.
Figure 5
Figure 5
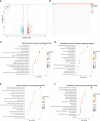
Identification of DLAT and DLD-related immune genes in TCGA-PRAD cohort. (A) Volcano plot of cuproptosis-related DEGs between normal and tumor tissues in TCGA-PRAD cohort. (B) Heatmap plot of immune-related DEGs between normal and tumor tissues in TCGA-PRAD cohort. (C) Top 20 terms for GO analysis of cuproptosis genes DLAT and DLD-related DEGs. (D) Top 20 pathways for KEGG analysis of cuproptosis genes DLAT and DLD-related DEGs. (E) Top 20 terms for GO analysis of immune-related DEGs. (F) Top 20 pathways for KEGG analysis of immune-related DEGs.
Figure 6
Figure 6
Construction and validation of a cuproptosis-related-IRG-based prognostic signature in TCGA-PRAD cohort. (A, B) DE-IRGs screened using a LASSO–Cox regression model. (C) Coefficients of three selected genes PRLR, LECT2, DES. (D-J) Construction of TCGA-PRAD training cohort. (D) Distribution and cut-off values of CRIRSs of TCGA training cohort. (E) OS of two CRIRS groups of TCGA-PRAD cohort. (F) ROC curves demonstrating the prognostic value of the CRIRS model in predicting 1-, 3- and 5-year OS in TCGA. (G) Calibration curves for CRIRS model of TCGA-PRAD cohort. y-axis: actual OS; x-axis: nomogram-predicted OS. (H) DFS of two CRIRS groups of TCGA-PRAD cohort. (I) ROC curves demonstrating the prognostic value of the CRIRS model in predicting 1-, 3- and 5-year DFS in TCGA. (J) Calibration curves for CRIRS model of TCGA-PRAD cohort. y-axis: actual DFS; x-axis: nomogram-predicted DFS. (K-N) Construction of MSKCC validation cohort. (K) Distribution and cut-off values of CRIRSs of MSKCC validation cohort. (L) DFS of two CRIRS groups of MSKCC cohort. (M) ROC curves demonstrating the prognostic value of the CRIRS model in predicting 1-, 3- and 5-year DFS in MSKCC. (N) Calibration curves for CRIRS model of MSKCC cohort. y-axis: actual DFS; x-axis: nomogram-predicted DFS. (O-R) Construction of GSE70770 validation cohort. (O) Distribution and cut-off values of CRIRSs of GSE70770 validation cohort. (P) DFS of two CRIRS groups of GSE70770 cohort. (Q) ROC curves demonstrating the prognostic value of the CRIRS model in predicting 1-, 3- and 5-year DFS in GSE70770. (R) Calibration curves for CRIRS model of GSE70770 cohort. y-axis: actual DFS; x-axis: nomogram-predicted DFS.
Figure 7
Figure 7
Correlation between CRIRS model and clinical characteristics based on TCGA-PRAD cohort. (A) Differences in clinicopathological features and expression levels of PRLR, LECT2 and DES between the low- and high-CRIRS groups. (B) Results of univariable and multivariable Cox regression analyses for predicting OS. Differences in CRIRS levels by age (C), T stage (D), N stage (E), M stage (F), and Gleason score (G) grouping. (H) Clinical characteristics of the high- and low-CRIRS groups.
Figure 8
Figure 8
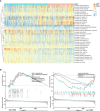
Enrichment analysis in the two CRIRS groups. (A) Analysis of multiple HALLMARK pathways via GSVA in the two CRIRS groups. (B) Immune-related pathways for GSEA enrichment analysis in two CRIRS groups.
Figure 9
Figure 9
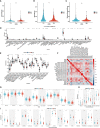
Comparison of immune activity in the two CRIRS groups. (A-C) Immune, stromal and microenvironment scores in the two CRIRS subtypes. (D) Different infiltration levels of 64 immune and stromal cells in the two CRIRS groups analysed using the xCell algorithm. (E) ssGSEA showed differences in the infiltration of immune cells between the two CRIRS groups. (F) Heatmap demonstrating correlation between seven key steps in the tumor immune cycle and CRIRSs. Differential expression of different types of immunomodulatory molecules MHC (G), immunoinhibitors (H) and immunostimulators (I) in the two CRIRS groups. * P < 0.05, ** P < 0.01, *** P < 0.001, **** P < 0.0001.
Figure 10
Figure 10
Genetic characteristics in the two CRIRS groups. (A) The distribution of TMB scores in the two CRIRS groups. (B) The distribution of MATH scores in the two CRIRS groups. (C, D) Waterfall plot of mutations in the top 20 genes in the low-CRIRS group top and high-CRIRS group bottom. (E) Forest plots demonstrating the frequency of 54 mutations that differed significantly between the two CRIRS groups. Higher mutation frequencies were found in the high-CRIRS group. (F) Heatmap demonstrating the commonality of mutations in the top 25 genes in PRAD. * P < 0.05, ***P < 0.001.
Figure 11
Figure 11
Genomic mutation profiles in the two CRIRS groups. (A, B) Box plot demonstrating the amplitudes of all chromosome amplifications/deletions in the two CRIRS groups. (C) Focal amplification/deletion of different chromosomal regions in the two CRIRS groups. (D) CNVs in the two CRIRS groups, including the logistic scores and mutation frequencies corresponding to different CNVs. ****P < 0.0001.
Figure 12
Figure 12
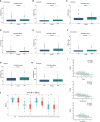
Assessment of chemotherapy and immunotherapy responses in the two CRIRS groups. (A–H) The response of patients to eight common chemotherapeutic drugs in the high- and low-CRIRS groups. (I–J) Immunotherapy response prediction in the two CRIRS groups. ***P < 0.001, ****P < 0.0001.

Similar articles

Cited by

References

    1. Nguyen-Nielsen M, Borre M. Diagnostic and therapeutic strategies for prostate cancer. Semin Nucl Med (2016) 46(6):484–90. doi: 10.1053/j.semnuclmed.2016.07.002 - DOI - PubMed
    1. Gandaglia G, Leni R, Bray F, Fleshner N, Freedland SJ, Kibel A, et al. Epidemiology and prevention of prostate cancer. Eur Urol Oncol (2021) 4(6):877–92. doi: 10.1016/j.euo.2021.09.006 - DOI - PubMed
    1. Kimura T, Egawa S. Epidemiology of prostate cancer in Asian countries. Int J Urol (2018) 25(6):524–31. doi: 10.1111/iju.13593 - DOI - PubMed
    1. Siegel RL, Miller KD, Jemal A. Cancer statistics, 2017. CA Cancer J Clin (2017) 67(1):7–30. doi: 10.3322/caac.21387 - DOI - PubMed
    1. Lalonde E, Ishkanian AS, Sykes J, Fraser M, Ross-Adams H, Erho N, et al. Tumour genomic and microenvironmental heterogeneity for integrated prediction of 5-year biochemical recurrence of prostate cancer: a retrospective cohort study. Lancet Oncol (2014) 15(13):1521–32. doi: 10.1016/S1470-2045(14)71021-6 - DOI - PubMed

Publication types

Substances