. 2023 Aug 2:14:1230267.
doi: 10.3389/fimmu.2023.1230267. eCollection 2023.

A novel necroptosis-related long noncoding RNA model for predicting clinical features, immune characteristics, and therapeutic response in clear cell renal cell carcinoma

Affiliations

A novel necroptosis-related long noncoding RNA model for predicting clinical features, immune characteristics, and therapeutic response in clear cell renal cell carcinoma

Lei Zhang et al. Front Immunol. .

Abstract

Background: Necroptosis is an immune-related cell death pathway involved in the regulation of the tumor microenvironment (TME). Here, we aimed to explore the role of necroptosis in clear cell renal cell carcinoma (ccRCC) and construct a necroptosis-related lncRNA (NRL) model to assess its potential association with clinical characteristics and immune status.

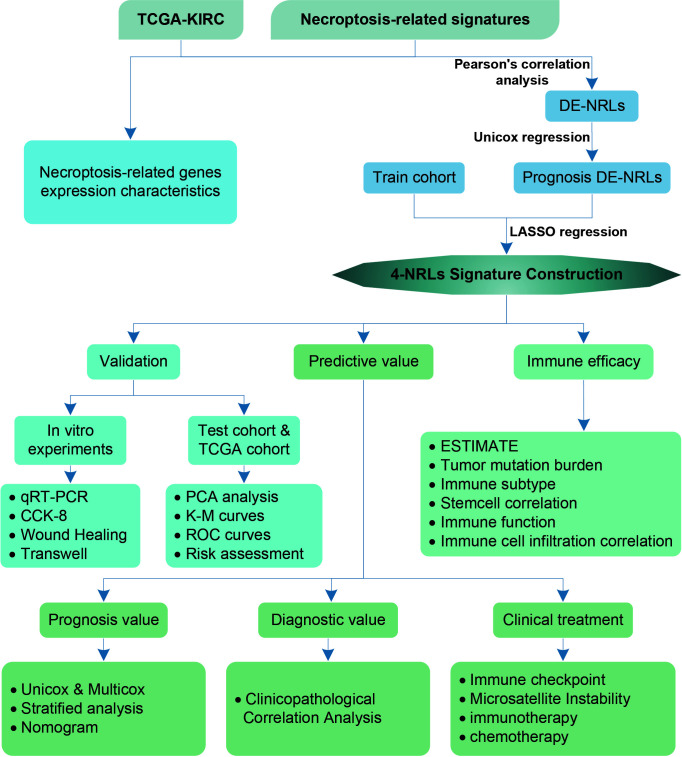
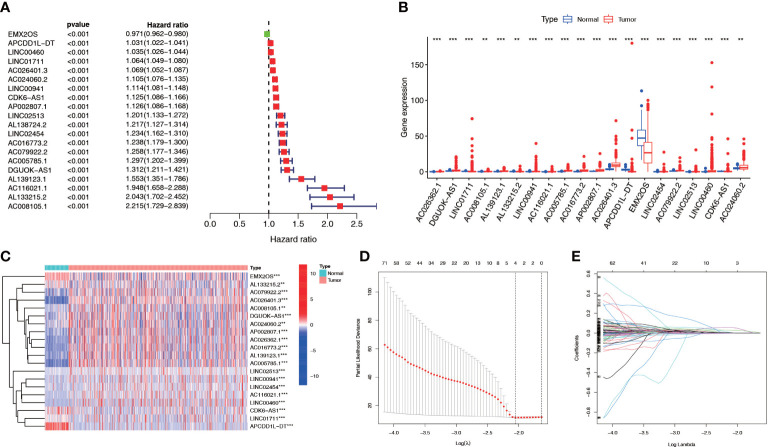
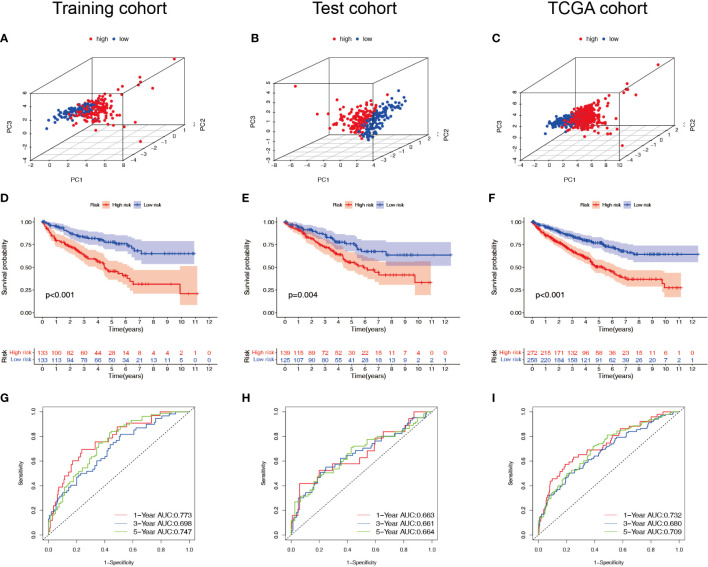
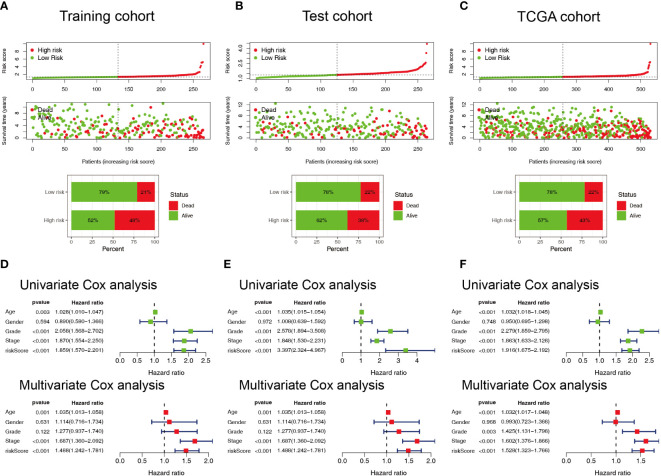
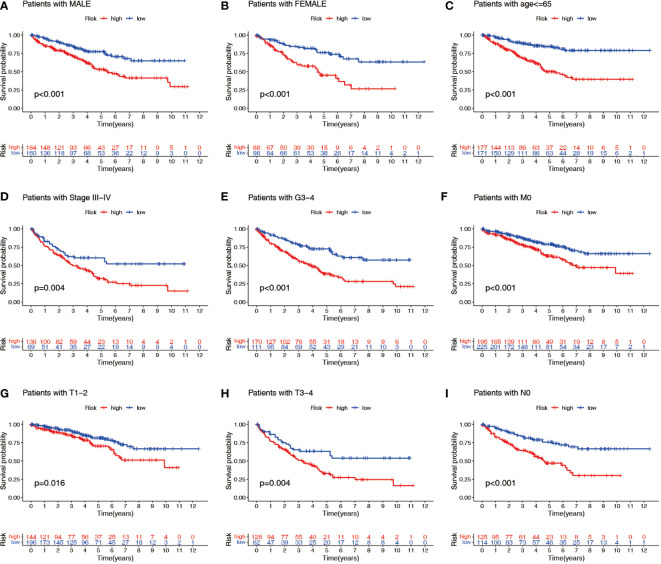
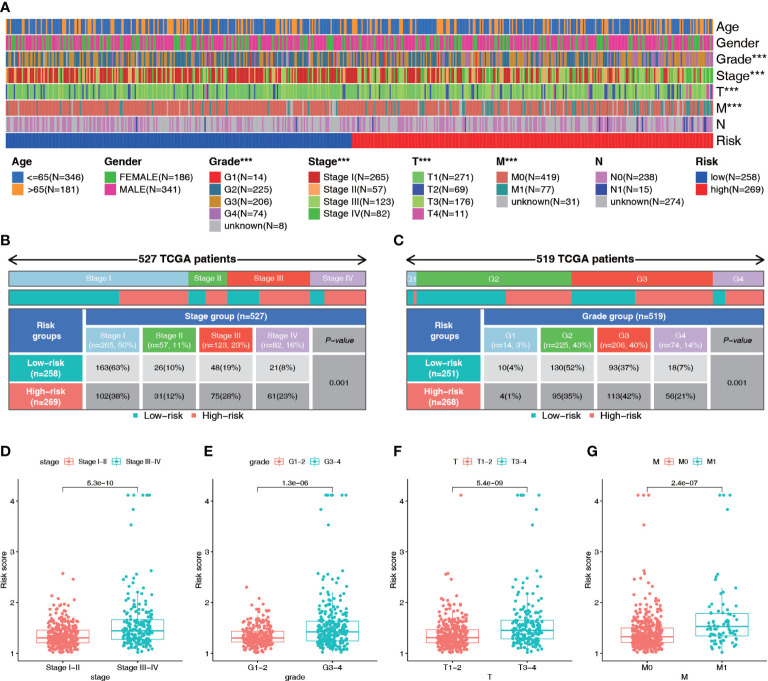
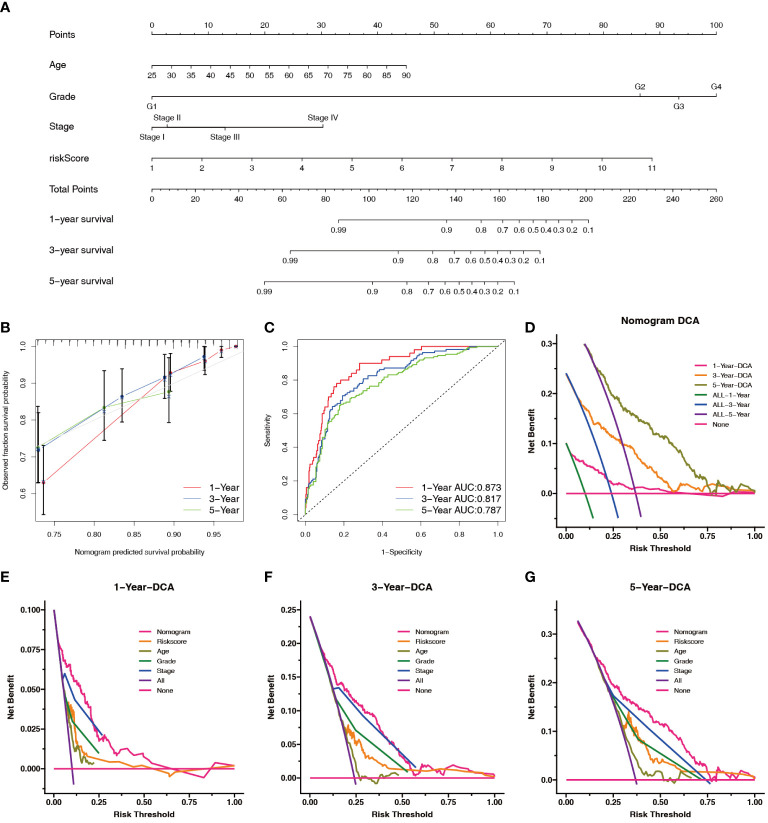
Methods: Gene expression profiles and clinical data for ccRCC patients were obtained from the Cancer Genome Atlas (TCGA). Pearson's correlation, univariate Cox, and least absolute shrinkage and selection operator analyses were used to develop an NRL model. Kaplan-Meier (K-M) and receiver operating characteristic (ROC) curve analyses were used to determine the prognostic value of the NRL model. The clinical information was used to assess the diagnostic value of the NRL model. The TME, immune function, immune cell infiltration, and immune checkpoints associated with the NRL model risk score were studied using the ESTIMATE, GSEA, ssGSEA, and CIBERSORT algorithms. The immunophenoscore (IPS) and half-maximal inhibitory concentration (IC50) were used to compare the efficacies of immunotherapy and chemotherapy based on the NRL model. Finally, in vitro assays were performed to confirm the biological roles of NRLs.

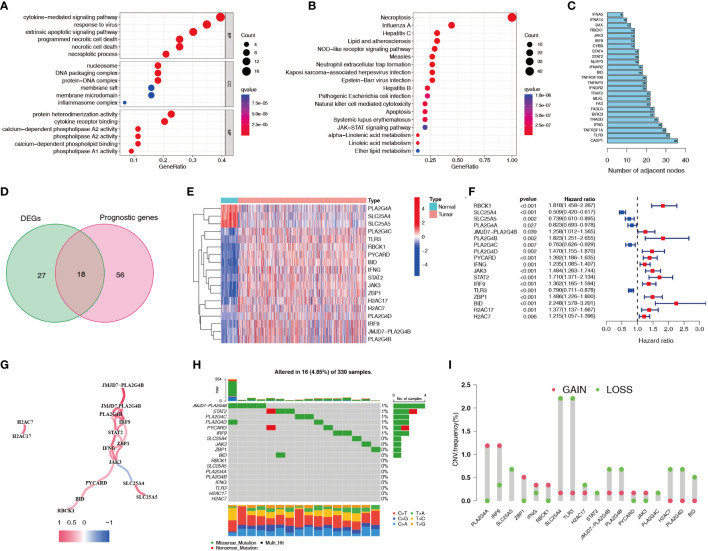
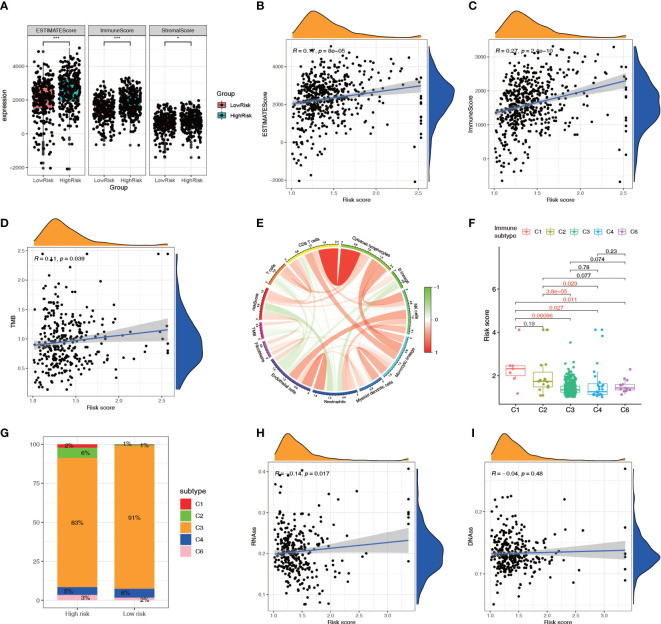
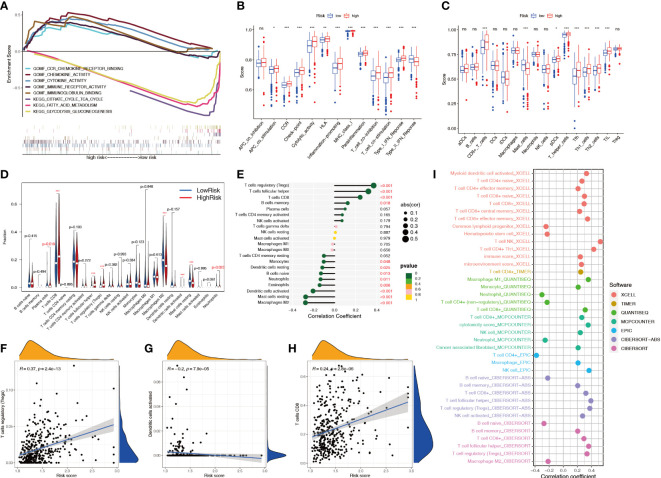
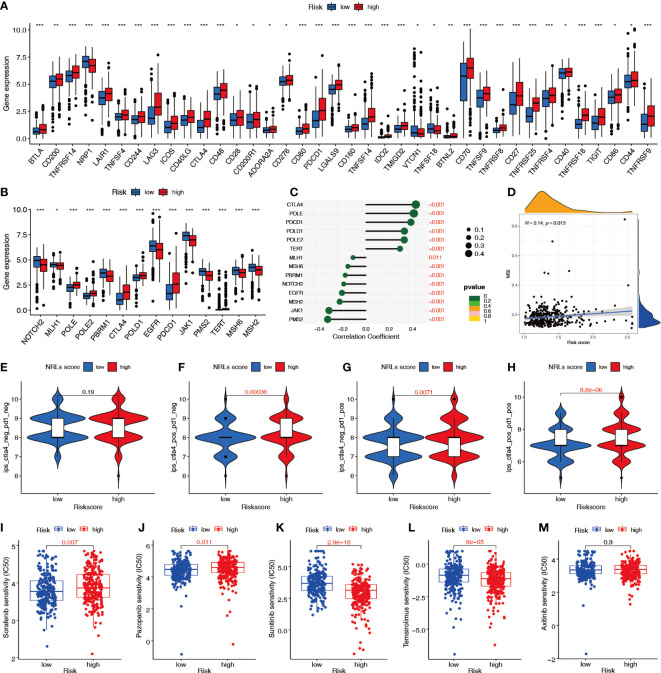
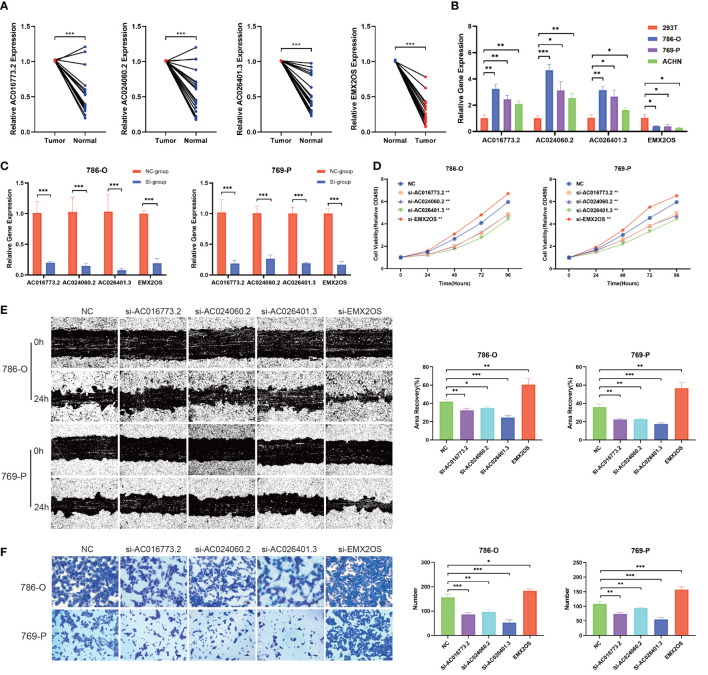
Results: A total of 18 necroptosis-related genes and 285 NRLs in ccRCC were identified. A four-NRL model was constructed and showed good performance in the diagnosis and prognosis of ccRCC patients. The ESTIMATE scores, tumor mutation burden, and tumor stemness indices were significantly correlated with NRL model risk score. Immune functions such as chemokine receptors and immune receptor activity showed differences between different risk groups. The infiltration of immunosuppressive cells such as Tregs was higher in high-risk patients than in low-risk patients. High-risk patients were more sensitive to immunotherapy and some chemotherapy drugs, such as sunitinib and temsirolimus. Finally, the expression of NRLs included in the model was verified, and knocking down these NRLs in tumor cells affected cell proliferation, migration, and invasion.

Conclusion: Necroptosis plays an important role in the progression of ccRCC. The NRL model we constructed can be used to predict the clinical characteristics and immune features of ccRCC patients.

Keywords: ccRCC; immune checkpoint inhibitors; immunotherapy; lncRNA; necroptosis; prognosis; tumor microenvironment.


Conflict of interest statement

The authors declare that the research was conducted in the absence of any commercial or financial relationships that could be construed as a potential conflict of interest.

Figures

Figure 1
Figure 1
Flowchart of the study analysis.
Figure 2
Figure 2
Expression characteristics of necroptosis-related genes for ccRCC patients in the TCGA dataset. (A, B) GO and KEGG functional enrichment analyses of genes related to necroptosis. (C) Protein interaction analysis of necroptosis-related genes. Numbers represent the number of adjacent nodes. (D) Venn diagram of necroptosis-related differentially expressed genes and prognostic genes. (E, F) Differential expression heatmap and prognostic forest plot of key necroptosis-related genes. (G) Co-expression analysis of key necroptosis-related genes. Red indicates a positive correlation and blue indicates a negative correlation. (H) SNPs in key necroptosis-related genes. Different colors represent different types of mutations. The numbers on the left side of the upper bar graph represent tumor mutation burden, and the percentages on the right represent mutation frequency. (I) Frequency of copy number variations (amplifications and deletions) in key necroptosis-related genes. TCGA, The Cancer Genome Atlas; GO, Gene Ontology; KEGG, Kyoto Encyclopedia of Genes and Genomes; SNP, single nucleotide polymorphism.
Figure 3
Figure 3
NRL screening and model construction. (A-C) Single factor Cox regression and differential analyses of some necroptosis lncRNAs. (D, E) LASSO regression analysis of the NRL model. **, P< 0.01; ***, P< 0.001. NRL: necroptosis-related long noncoding RNA; lncRNA: long noncoding RNA; LASSO, least absolute shrinkage and selection operator.
Figure 4
Figure 4
Survival analysis of the NRL model. (A–C) PCA plots of high- and low-risk patients in the training, test, and TCGA cohorts. (D–F) Overall survival of high- and low-risk patients in the training, test, and TCGA cohorts. (G–I) ROC curves for high- and low-risk patients in the training, test, and TCGA cohorts. NRL, necroptosis-related long noncoding RNA; PCA, principal component analysis; TCGA, The Cancer Genome Atlas; ROC, receiver operating characteristic.
Figure 5
Figure 5
Evaluation of the predictive ability of the NRL model. (A–C) Scatter plot of the risk score and survival status in the training, test, and TCGA cohorts. (D–F) Forest plots of univariate and multivariate Cox analyses results for the training, test, and TCGA cohorts. NRL, necroptosis-related long noncoding RNA; TCGA, The Cancer Genome Atlas.
Figure 6
Figure 6
Stratified prognostic power assessment. K-M survival analysis between patients in the high- and low-risk groups in different clinical groups. Gender (A, B), age (C), stage (D), grade (E), M stage (F), T stage (G, H) and N stage (I). K-M, Kaplan–Meier; M, metastasis; T, tumor; N, node.
Figure 7
Figure 7
Diagnostic value of the NRL model. (A–C) Correlation analysis of risk score and clinical parameters (Stage and grade). (D–G) Differences in risk scores among patients with different clinical traits (Stage, grade, T stage and M stage). ***, P< 0.001. NRL, necroptosis-related long noncoding RNA.
Figure 8
Figure 8
Construction and evaluation of the nomogram. (A) Prognostic nomograms were constructed based on the NRL model and clinical traits to predict the 1-, 3-, and 5-year OS in patients with renal cell carcinoma. (B) The 1-, 3-, and 5-year nomogram calibration curves. The 45-degree line represents the ideal prediction. (C) ROC curve analysis of the nomogram. (D–G) DCA showed clinical benefit at 1, 3, and 5 years. NRL, necroptosis-related long noncoding RNA; OS, overall survival; ROC, receiver operating characteristic; DCA, decision curve analysis.
Figure 9
Figure 9
Relationship between the NRL model risk score and tumor microenvironment. (A–C) Relationship between the ESTIMATE score and risk score. (D, E) Correlation analysis of TMB with the risk score and immune cell infiltration. (F, G) Correlation analysis between immune subtypes and the risk score. (H, I) Correlation analysis between the tumor stemness index and risk score. *, P< 0.05; ***, P< 0.001. NRL, necroptosis-related long noncoding RNA; ESTIMATE, Estimation of STromal and Immune cells in MAlignant Tumor tissues using Expression data; TMB, tumor mutation burden.
Figure 10
Figure 10
Relationship between the NRL model risk score and immune cell infiltration. (A) GSEA in different risk groups. (B, C) ssGSEA immune marker difference analysis in different risk groups. (D) Differences in CIBERSORT immune cell infiltration levels in different risk groups. (E-H) Correlation analysis between the risk score and the CIBERSORT immune cell infiltration level. (I) Correlation analysis between risk score and immune cell infiltration level using various algorithms. *, P< 0.05; **, P< 0.01; ***, P< 0.001; ns, no significance. NRL, necroptosis-related long noncoding RNA; GSEA, gene set enrichment analysis; ssGSEA, single-sample gene set enrichment analysis; CIBERSORT, Cell-type Identification By Estimating Relative Subsets Of RNA Transcripts.
Figure 11
Figure 11
Predictive value of the NRL model risk score in clinical treatment. (A) Differences in immune checkpoint molecule expression between risk groups. (B, C) Relationship between the risk score and immunosuppressive treatment-related gene expression. (D) Correlation between the risk score and MSI. (E–H) IPSs were different in different risk groups. (I–M) Differences in sensitivity to targeted chemotherapy drugs among different risk groups (IC50). *, P< 0.05; **, P< 0.01; ***, P< 0.001. MSI, microsatellite instability; IPS, immunophenoscore; IC50, half-maximal inhibitory concentration.
Figure 12
Figure 12
Validation of biological functions of hub lncRNAs in ccRCC. (A) Relative levels of the hub lncRNAs in 20 pairs of clinical tissue samples (N=20). (B) Relative levels of hub lncRNAs in ccRCC cells. (C) Evaluation of the siRNA transfection efficiency. (D) CCK8 assays were used to assess cell proliferation after transfection. (E) Wound healing assays were used to assess cell migration after transfection. (F) Transwell assays were used to assess cell invasion after transfection. *, P< 0.05; **, P< 0.01; ***, P< 0.001. lncRNA, long noncoding RNA; ccRCC, clear cell renal cell carcinoma; CCK8, Cell Counting Kit-8; 786-O, 769-P, two types of renal cancer cell lines.

Similar articles

Cited by

References

    1. Hsieh JJ, Purdue MP, Signoretti S, Swanton C, Albiges L, Schmidinger M, et al. . Renal cell carcinoma. Nat Rev Dis Primers (2017) 3:17009. doi: 10.1038/nrdp.2017.9 - DOI - PMC - PubMed
    1. Siegel RL, Miller KD, Wagle NS, Jemal A. Cancer statistics, 2023. CA Cancer J Clin (2023) 73(1):17–48. doi: 10.3322/caac.21763 - DOI - PubMed
    1. Weinstock M, McDermott D. Targeting pd-1/Pd-L1 in the treatment of metastatic renal cell carcinoma. Ther Adv Urol (2015) 7(6):365–77. doi: 10.1177/1756287215597647 - DOI - PMC - PubMed
    1. Kasherman L, Siu DHW, Woodford R, Harris CA. Angiogenesis inhibitors and immunomodulation in renal cell cancers: the past, present, and future. Cancers (Basel) (2022) 14(6):1406. doi: 10.3390/cancers14061406 - DOI - PMC - PubMed
    1. Vandenabeele P, Galluzzi L, Vanden Berghe T, Kroemer G. Molecular mechanisms of necroptosis: an ordered cellular explosion. Nat Rev Mol Cell Biol (2010) 11(10):700–14. doi: 10.1038/nrm2970 - DOI - PubMed

Publication types

MeSH terms

Substances