. 2023 Aug 2:14:1217077.
doi: 10.3389/fimmu.2023.1217077. eCollection 2023.

Transcriptional and proteomic analysis of the innate immune response to microbial stimuli in a model invertebrate chordate

Affiliations

Transcriptional and proteomic analysis of the innate immune response to microbial stimuli in a model invertebrate chordate

Assunta Liberti et al. Front Immunol. .

Abstract

Inflammatory response triggered by innate immunity can act to protect against microorganisms that behave as pathogens, with the aim to restore the homeostatic state between host and beneficial microbes. As a filter-feeder organism, the ascidian Ciona robusta is continuously exposed to external microbes that may be harmful under some conditions. In this work, we used transcriptional and proteomic approaches to investigate the inflammatory response induced by stimuli of bacterial (lipopolysaccharide -LPS- and diacylated lipopeptide - Pam2CSK4) and fungal (zymosan) origin, in Ciona juveniles at stage 4 of metamorphosis. We focused on receptors, co-interactors, transcription factors and cytokines belonging to the TLR and Dectin-1 pathways and on immune factors identified by homology approach (i.e. immunoglobulin (Ig) or C-type lectin domain containing molecules). While LPS did not induce a significant response in juvenile ascidians, Pam2CSK4 and zymosan exposure triggered the activation of specific inflammatory mechanisms. In particular, Pam2CSK4-induced inflammation was characterized by modulation of TLR and Dectin-1 pathway molecules, including receptors, transcription factors, and cytokines, while immune response to zymosan primarily involved C-type lectin receptors, co-interactors, Ig-containing molecules, and cytokines. A targeted proteomic analysis enabled to confirm transcriptional data, also highlighting a temporal delay between transcriptional induction and protein level changes. Finally, a protein-protein interaction network of Ciona immune molecules was rendered to provide a wide visualization and analysis platform of innate immunity. The in vivo inflammatory model described here reveals interconnections of innate immune pathways in specific responses to selected microbial stimuli. It also represents the starting point for studying ontogeny and regulation of inflammatory disorders in different physiological conditions.

Keywords: Ciona robusta; inflammatory response; innate immunity; marine invertebrates; microbial stimuli; protein-protein interactome; proteomic analysis; transcriptional analysis.


Conflict of interest statement

The authors declare that the research was conducted in the absence of any commercial or financial relationships that could be construed as a potential conflict of interest.

Figures

Figure 1
Figure 1
Experimental setup and effect on morphology of .C. robusta juveniles after 24 hours from the treatment. (A) Scheme of C. robusta juveniles’ treatment with different microbial stimuli, concentrations and duration, followed by quantification of immune molecules through gene expression (RT-qPCR technique) and protein level (LC-MRM/MC technique). (B) On the left, schematic representation of C. robusta juveniles at stage 4 showing the main anatomical features observed at this metamorphic stage. On the right, after 24 hours juveniles (exposed for 4 hours to diverse concentration of microbial stimuli) appear morphologically normal. Scale bar, 100 μm.
Figure 2
Figure 2
Effect of 10 μg/ml LPS treatment on gene expression. C. robusta juveniles at stage 4 of metamorphosis treated with 10 μg/ml LPS show significant changes in gene expression of TLR2 and TYRO3, detected by RT-qPCR, after 30 min treatment. Truncated violin plots represent the distribution and the density of numerical data of gene expression reported as fold changes (2-ΔΔCt) of mRNA Relative Quantification (mRNA RQ) compared to the corresponding control samples (no treated juveniles), that are reported as dotted black line. The black lines in each violin plots indicate the median of data set (n = 6, biological replicates). Statistical methods: paired samples t-test, significance indicated by black asterisk. (*p. value < 0.05).
Figure 3
Figure 3
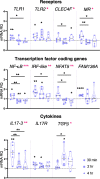
Effect of 1 μg/ml Pam2CSK4 treatment on gene expression. C. robusta juveniles at stage 4 of metamorphosis, treated with Pam2CSK4 at the concentration of 1 μg/ml, show significant changes in gene expression of TLR1, TLR2, CLEC4F, MR, NF-κB, IRF-like, NFAT5, FAM136A, IL17-3, IL17R and TGFβ, detected by RT-qPCR, after 30 min, 2 hr and 4 hr of treatment. Truncated violin plots represent the distribution and the density of numerical data of gene expression reported as fold changes (2-ΔΔCt) of mRNA Relative Quantification (mRNA RQ) compared to the corresponding control samples of juveniles (not treated) and reported as dotted black line. The black lines in violin plots indicate the median of data set (n = 6, biological replicates). Graphics shows also significant expression changes between two different time points of the treatment, indicated by horizontal black lines. Statistical methods: paired samples t-test, significance indicated by black asterisks; one-way ANOVA test, significance indicated by magenta asterisks. (*p. value < 0.05, **p. value < 0.01, ***p. value < 0.001, and ****p. value < 0.0001).
Figure 4
Figure 4
Effect of 10 μg/ml Pam2CSK4 treatment on gene expression. C. robusta juveniles at stage 4 of metamorphosis, treated with Pam2CSK4 at the concentration of 10 μg/ml, show significant changes in gene expression, detected by RT-qPCR, of TLR1, TLR2, CLEC4M, CLEC4F, IL17-1, IL17-3, TGFβ, MIF, mamA, C3 and C3aR, after 30 min, 2 hr and 4 hr. Truncated violin plots represent the distribution and the density of numerical data of gene expression reported as fold changes (2-ΔΔCt) of mRNA Relative Quantification (mRNA RQ) compared to the corresponding control samples of juveniles (not treated) and reported as dotted black line. The black lines in each violin plots indicate the median of data set (n = 6, biological replicates). Graphics shows also significant expression changes between two different treatment time points, indicated by black lines. Statistical methods: paired samples t-test, significance indicated by black asterisks; one-way ANOVA test, significance indicated by magenta asterisks. (*p. value < 0.05, **p. value < 0.01, ***p. value < 0.001 and ****p. value < 0.0001).
Figure 5
Figure 5
Effect of 10 μg/ml zymosan treatment on gene expression. C. robusta juveniles at stage 4 of metamorphosis, treated with zymosan at the concentration of 10 μg/ml, show significant changes in gene expression, detected by RT-qPCR, of CLEC4M, MR, FN, FN-like, SYK, IRF-like, NFAT5, IL17-2 and C3 after 30 min, 2 hr and 4 hr. Truncated violin plots represent the distribution and the density of numerical data of gene expression reported as fold changes (2-ΔΔCt) of mRNA Relative Quantification (mRNA RQ) compared to the corresponding control samples of juveniles (not treated) and reported as dotted black line. The black lines in each violin plots indicate the median of data set (n = 5, biological replicates). Graphics shows also significant expression changes between two different treatment time points, indicated by horizontal black lines. Statistical methods: paired samples t-test, significance indicated by black asterisks; one-way ANOVA test, significance indicated by magenta asterisks. (*p. value < 0.05, **p. value < 0.01).
Figure 6
Figure 6
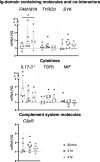
Effect of 100 μg/ml zymosan treatment on gene expression. C. robusta juveniles at stage 4 of metamorphosis, treated with zymosan at the concentration of 100 μg/ml, show significant changes in gene expression, detected by RT-qPCR, of FAM187A, TYRO3, SYK, IL17-3, TGFβ, MIF and C3aR after 30 min, 2 hr and 4 hr. Truncated violin plots represent the distribution and the density of numerical data of gene expression reported as fold changes (2-ΔΔCt) of mRNA Relative Quantification (mRNA RQ) compared to the corresponding control samples of juveniles (not treated) and reported as dotted black line. The black lines in each violin plots indicate the median of data set (n = 6, biological replicates). Graphics shows also significant expression changes between two different time points of the treatment, indicated by horizontal black lines. Statistical methods: paired samples t-test, significance indicated by black asterisks; one-way ANOVA test, significance indicated by magenta asterisks. (*p. value < 0.05).
Figure 7
Figure 7
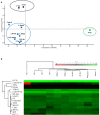
Targeted proteomic analysis of C. robusta juveniles expose to 10 μg/ml LPS, 1 μg/ml Pam2CSK4 and 100 μg/ml zymosan. (A) PCA analysis, clustering overall protein level variations at each time point of animals treated with microbial stimuli, shows similar protein level among control, LPS treated-, 2 hr and 4 hr zymosan treated-, and 30 min Pam2CSK4 treated- samples. 4 hr zymosan treated- and 2 hr Pam2CSK4 treated- samples have protein levels that cluster together and differs from control samples; whereas 4 hr Pam2CSK4 treated samples have protein level that highly differ from all the other treatment conditions. (B) Heatmap shows both hierarchical clustering of the treatment conditions and protein levels of the analyzed immune molecules, extracted from C. robusta juveniles expose to 10 μg/ml LPS, 1 μg/ml Pam2CSK4 and 100 μg/ml zymosan for 30 min, 2 hr and 4 hr and detected through LC-MRM/MS method. “P” and “Z” indicate Pam2CSK4 and zymosan treatments, respectively.
Figure 8
Figure 8
Protein-protein interaction network of Ciona robusta immune molecules. Protein-protein interaction map constructed with the STRING database and modified with Cytoscape, reveals the interaction between C. robusta immune molecules investigated through gene expression. Here, these molecules are indicated with an oval filled with light red color and those that are still not connected in the map are reported below. GO enrichment analysis is also indicated, highlighting in the color-legend some of the Biological Processes, related with immunological features, in which the molecules present in the map are involved.
Figure 9
Figure 9
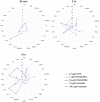
Summary of gene expression modulation at 30 min, 2 hr and 4 hr treatment. Radar plots show a summary of the genes that are (significantly) modulated at each time point treatment (30 min, 2 hr and 4 hr) by 10 μg/ml LPS, 1 and 10 μg/ml Pam2CSK4 and 10 and 100 μg/ml zymosan. 10 μg/ml LPS modulated just 2 genes at 30 min treatment. 1 μg/ml Pam2CSK4 modulate a higher number of genes at 30 min (7 genes) and 2 hr (4 genes) respect to 4 hr (3 genes) treatment. On the contrary, 10 μg/ml Pam2CSK4 has a major effect at late time points, 2 hr (5 genes) and 4 hr (11 genes), respect to the 30 min (2 genes) treatment. zymosan treatment, at both concentrations used, has an effect at the late time points, 2 hr (10 μg/ml, 2 genes; 100 μg/ml, 4 genes) and 4 hr (10 μg/ml, 9 genes; 100μg/ml, 3 genes) respect to the 30 min treatment (10 μg/ml, 1 genes; 100μg/ml, 2 genes).

References

    1. Satoh N. The ascidian tadpole larva: comparative molecular development and genomics. Nat Rev Genet (2003) 4(4):285–95. doi: 10.1038/nrg1042 - DOI - PubMed
    1. Christiaen L, Wagner E, Shi W, Levine M. Isolation of individual cells and tissues from electroporated sea squirt (Ciona) embryos by fluorescence-activated cell sorting (FACS). Cold Spring Harb Protoc (2009) 2009(12):pdb prot5349. doi: 10.1101/pdb.prot5349 - DOI - PubMed
    1. Davidson B. Ciona intestinalis as a model for cardiac development. Semin Cell Dev Biol (2007) 18(1):16–26. doi: 10.1016/j.semcdb.2006.12.007 - DOI - PMC - PubMed
    1. Lemaire P, Smith WC, Nishida H. Ascidians and the plasticity of the chordate developmental program. Curr Biol (2008) 18(14):R620–31. doi: 10.1016/j.cub.2008.05.039 - DOI - PMC - PubMed
    1. Satoh N, Levine M. Surfing with the tunicates into the post-genome era. Genes Dev (2005) 19(20):2407–11. doi: 10.1101/gad.1365805 - DOI - PMC - PubMed

Publication types