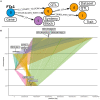
. 2023 Aug 3:6:1191122.
doi: 10.3389/frai.2023.1191122. eCollection 2023.

Development of a knowledge graph framework to ease and empower translational approaches in plant research: a use-case on grain legumes

Affiliations

Development of a knowledge graph framework to ease and empower translational approaches in plant research: a use-case on grain legumes

Baptiste Imbert et al. Front Artif Intell. .

Abstract

While the continuing decline in genotyping and sequencing costs has largely benefited plant research, some key species for meeting the challenges of agriculture remain mostly understudied. As a result, heterogeneous datasets for different traits are available for a significant number of these species. As gene structures and functions are to some extent conserved through evolution, comparative genomics can be used to transfer available knowledge from one species to another. However, such a translational research approach is complex due to the multiplicity of data sources and the non-harmonized description of the data. Here, we provide two pipelines, referred to as structural and functional pipelines, to create a framework for a NoSQL graph-database (Neo4j) to integrate and query heterogeneous data from multiple species. We call this framework Orthology-driven knowledge base framework for translational research (Ortho_KB). The structural pipeline builds bridges across species based on orthology. The functional pipeline integrates biological information, including QTL, and RNA-sequencing datasets, and uses the backbone from the structural pipeline to connect orthologs in the database. Queries can be written using the Neo4j Cypher language and can, for instance, lead to identify genes controlling a common trait across species. To explore the possibilities offered by such a framework, we populated Ortho_KB to obtain OrthoLegKB, an instance dedicated to legumes. The proposed model was evaluated by studying the conservation of a flowering-promoting gene. Through a series of queries, we have demonstrated that our knowledge graph base provides an intuitive and powerful platform to support research and development programmes.

Keywords: OrthoLegKB; Ortho_KB; comparative omics; gene expression; graph database; ontology; orthology; quantitative genetics.


Conflict of interest statement

The authors declare that the research was conducted in the absence of any commercial or financial relationships that could be construed as a potential conflict of interest.

Figures
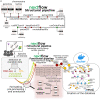
Figure 1
Figure 1
Schematic representation of the pipelines used to build Ortho_KB, a NoSQL graph database framework for translational research. (A) The structural pipeline computing homology between genes and synteny across chromosomal regions from selected annotated genomes. All processes included in the pipeline, except those producing the mandatory final outputs, are represented by dark red circles. Processes producing the mandatory final outputs are represented by green circles. (B) General overview of the steps leading to the construction of an instance of Ortho_KB. Datasets that can be managed include RNA-seq data, QTL and functional annotations. As an example, we develop the treatment of an RNA-seq dataset from public or private origin. Alongside a regular extraction of counts, metadata of the samples must be annotated using ontologies to describe in particular the tissue of origin (Plant Ontology) and the experimental conditions to which the sample was subjected to (Plant Experimental Conditions Ontology). The functional pipeline will process inputed files and in this case the annotated metadata file will produce “Sample” and “Condition” nodes in the graph. This last node will also be connected by relationships to “Resource” nodes corresponding to the ontologies, thereby conserving the metadata information in the Neo4j graph database. The graph database is included in a Docker container, as shown on the right-hand side of the schema.
Figure 2
Figure 2
Overview of the Ortho_KB translational database model. In the graph model, colored circles represent the 29 core node types, which are entities with labels and properties. “Gene”, “RNA”, and “Protein” and related genomic nodes are shown in blue, “Homology” and “Synteny” and related nodes in mauve, ontology term nodes in yellow, the RNA-seq nodes in dark red, functional annotation nodes in light green, taxonomic nodes in light gray, and QTL-related nodes in orange. The category of each node is described by the associated labels, which are contained in elongated boxes near the nodes, and the properties correspond to the lists of elements placed below the labels. Nodes are connected to each other by relationships, represented by arrows, which can also store information as properties.
Figure 3
Figure 3
UpSet plot highlighting the number of orthogroups within and between legume species included in OrthoLegKB. The structural pipeline of Ortho_KB was used to identify the orthogroups. The bar plot shows the number of orthogroups for each possible set of species. The dots indicate the species associated with each bar.
Figure 4
Figure 4
Illustration of the query used to search for putative orthologs of MtFTa1 in OrthoLegKB. Putative orthologs in pea (psat), lentil (lcul), faba bean (vfab) and mung bean (vrad; top panel) were queried in Cypher (middle panel), and several properties were returned in CSV format (bottom panel). Genes belonging to the same orthogroup as MtFTa1 were selected and their positions on the respective chromosomes were returned. Note that relationships' names were not displayed in the query section to keep it concise but were specified when running the query. The number of records returned in the output table and the average response time of the query are shown in light gray below the table.
Figure 5
Figure 5
Macro- and micro-synteny of the chromosomal regions harboring FTa1 or its orthologs in M. truncatula, P. sativum, L. culinaris and V. faba. (A) Macro-synteny at the chromosome level. FTa1 and its orthologs are represented by gray dots on syntenic chromosome sections depicted as lines. Synteny between chromosomes is represented by ribbons. The positions of the two orthologs from P. sativum are shown even though they do not belong to any syntenic block in the database. (B) Micro-synteny of the FTa1 loci. Genes are represented with arrows indicating the orientation of the open reading frames. Ribbons connect orthologous gene pairs. The IDs of FTa1 orthologous genes are in orange and ribbons connecting them are filled in dark green. Since the four species have high genome size heterogeneity and variable intergenic sizes, intergenic regions were removed from the plot. Some gene names are not displayed due to space limitations. However, the gene sizes remain proportional.
Figure 6
Figure 6
Extraction of protein domain annotations of FTa1 and its orthologs using OrthoLegKB. “FunctionalAnnotation” nodes containing protein domain annotations (top panel) were queried in Cypher (middle panel), for which several properties were returned in CSV format (bottom panel). The nodes of protein domain annotations are connected to “Protein” nodes. Therefore, proteins corresponding to FTa1 and its orthologous genes were selected, and their annotations from PANTHER were retrieved. Note that some relationships' names were not displayed in the query section to keep it concise but were specified when running the query. The number of records returned in the output table and the average response time of the query are shown in light gray below the table.
Figure 7
Figure 7
Identification of colocalising QTL with syntenic blocks hosting MtFTa1 and its orthologs. (A) Illustration of the subgraph of OrthoLegKB queried to highlight QTL located near FTa1 genes. “QTL” nodes contained within “Synteny” nodes including the FTa1 gene were mined. Only QTL associated with flowering “Trait” were then kept. The query is available in Supplementary File S1. (B) Visualization of the colocalization between flowering QTL and syntenic blocks containing FTa1 orthologs. Chromosome sections are represented by lines. Syntenic regions across chromosomes are represented by colored ribbons. FTa1 and its orthologs are represented by gray dots. QTL labeled with their IDs are depicted by segments when information on both flanking markers is available or otherwise by simple dots.
Figure 8
Figure 8
Fetch of expression levels (in TPM) of MtFTa1 and its orthologs in different tissues of the shoot system, in OrthoLegKB. Normalized expression level of FTa1 and its orthologs in RNA-seq samples (top panel) were queried in Cypher (middle panel), and several properties were returned in CSV format (bottom panel). The expression of FTa1 genes was queried at the “Sample” level using the “expr” variable. The tissue annotations from the “Condition” nodes connected to these “Samples” were filtered to have only “Condition” nodes connected to the “PO” node “shoot system” or any of its more specific child terms. Note that in the table, the order of the rows was rearranged to show the diversity of annotations under the “shoot system” term. The number of records returned in the output table and the average response time of the query are shown in light gray below the table. The full table is available as Supplementary Table S6.

Similar articles

Cited by

References

    1. Abuoda G., Dell'Aglio D., Keen A., Hose K. (2022). Transforming RDF-star to property graphs: A preliminary analysis of transformation approaches – extended version. arXiv [Preprint]. arXiv: 2210.05781. 10.48550/arXiv.2210.05781 - DOI
    1. Aguilar-Benitez D., Casimiro-Soriguer I., Maalouf F., Torres A. M. (2021). Linkage mapping and QTL analysis of flowering time in faba bean. Sci. Rep. 11, 13716. 10.1038/s41598-021-92680-4 - DOI - PMC - PubMed
    1. Bandi V., Gutwin C. (2020). Interactive Exploration of Genomic Conservation in Proceedings of Graphics Interface 2020 GI 2020. Toronto: Canadian Human-Computer Communications Society/Société canadienne du dialogue humain-machine, 74–83.
    1. Barrasa J. (2022). Neosemantics (n10s). Available online at: https://github.com/neo4j-labs/neosemantics (accessed December 21, 2022).
    1. Berardini T. Z., Reiser L., Li D., Mezheritsky Y., Muller R., Strait E., et al. . (2015). The arabidopsis information resource: making and mining the “gold standard” annotated reference plant genome: tair: making and mining the “gold standard” plant genome. Genesis 53, 474–485. 10.1002/dvg.22877 - DOI - PMC - PubMed