

Phase-wise evaluation and optimization of non-pharmaceutical interventions to contain the COVID-19 pandemic in the U.S
- PMID: 37601210
- PMCID: PMC10434774
- DOI: 10.3389/fpubh.2023.1198973
Phase-wise evaluation and optimization of non-pharmaceutical interventions to contain the COVID-19 pandemic in the U.S
Abstract
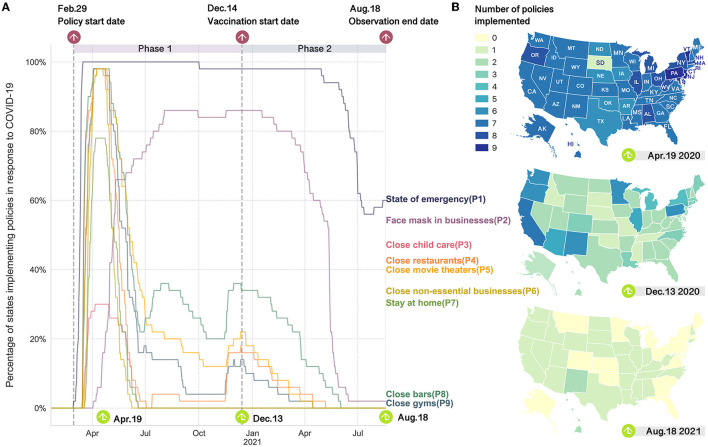
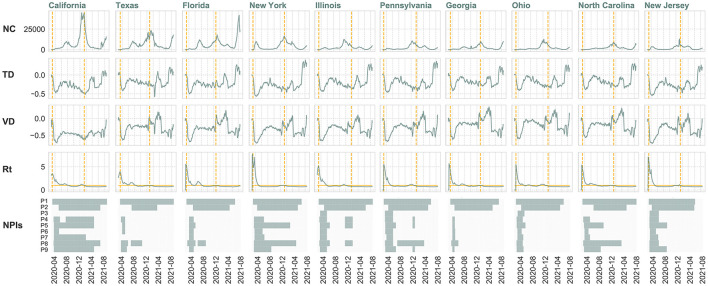
Given that the effectiveness of COVID-19 vaccines and other therapies is greatly limited by the continuously emerging variants, non-pharmaceutical interventions have been adopted as primary control strategies in the global fight against the COVID-19 pandemic. However, implementing strict interventions over extended periods of time is inevitably hurting the economy. Many countries are faced with the dilemma of how to take appropriate policy actions for socio-economic recovery while curbing the further spread of COVID-19. With an aim to solve this multi-objective decision-making problem, we investigate the underlying temporal dynamics and associations between policies, mobility patterns, and virus transmission through vector autoregressive models and the Toda-Yamamoto Granger causality test. Our findings reveal the presence of temporal lagged effects and Granger causality relationships among various transmission and human mobility variables. We further assess the effectiveness of existing COVID-19 control measures and explore potential optimal strategies that strike a balance between public health and socio-economic recovery for individual states in the U.S. by employing the Pareto optimality and genetic algorithms. The results highlight the joint power of the state of emergency declaration, wearing face masks, and the closure of bars, and emphasize the necessity of pursuing tailor-made strategies for different states and phases of epidemiological transmission. Our framework enables policymakers to create more refined designs of COVID-19 strategies and can be extended to other countries regarding best practices in pandemic response.
Keywords: COVID-19 pandemic; human mobility; multi-objective optimization; multivariate time series analysis; non-pharmaceutical interventions; public health policymaking.
Copyright © 2023 Zhou, Zhang, Santi and Ratti.
Conflict of interest statement
The authors declare that the research was conducted in the absence of any commercial or financial relationships that could be construed as a potential conflict of interest.
Figures


Similar articles
-
Physical interventions to interrupt or reduce the spread of respiratory viruses.Cochrane Database Syst Rev. 2020 Nov 20;11(11):CD006207. doi: 10.1002/14651858.CD006207.pub5. Cochrane Database Syst Rev. 2020. Update in: Cochrane Database Syst Rev. 2023 Jan 30;1:CD006207. doi: 10.1002/14651858.CD006207.pub6. PMID: 33215698 Free PMC article. Updated.
-
Trade-Off between COVID-19 Pandemic Prevention and Control and Economic Stimulus.Int J Environ Res Public Health. 2022 Oct 27;19(21):13956. doi: 10.3390/ijerph192113956. Int J Environ Res Public Health. 2022. PMID: 36360836 Free PMC article.
-
A Retrospective Global Assessment of Factors Associated With COVID-19 Policies and Health Outcomes.Front Public Health. 2022 May 9;10:843445. doi: 10.3389/fpubh.2022.843445. eCollection 2022. Front Public Health. 2022. PMID: 35615034 Free PMC article.
-
Mathematical assessment of the impact of non-pharmaceutical interventions on curtailing the 2019 novel Coronavirus.Math Biosci. 2020 Jul;325:108364. doi: 10.1016/j.mbs.2020.108364. Epub 2020 May 1. Math Biosci. 2020. PMID: 32360770 Free PMC article.
-
Study Designs to Assess Real-World Interventions to Prevent COVID-19.Front Public Health. 2021 Jul 27;9:657976. doi: 10.3389/fpubh.2021.657976. eCollection 2021. Front Public Health. 2021. PMID: 34386470 Free PMC article. Review.
References
-
- World Health Organization . Statement on the Second Meeting of the International Health Regulations (2005) Emergency Committee Regarding the Outbreak of Novel Coronavirus (2019-nCoV), Vol. 30. Geneva: World Health Organization; (2020).
-
- World Health Organization. WHO Coronavirus Disease (COVID-19) Dashboard. (2022). Available online at: https://covid19.who.int (accessed July 06, 2022).
Publication types
MeSH terms
Substances
LinkOut - more resources
Full Text Sources
Medical