. 2023 Aug 16:11:e15862.
doi: 10.7717/peerj.15862. eCollection 2023.

LIDER: cell embedding based deep neural network classifier for supervised cell type identification

Affiliations

LIDER: cell embedding based deep neural network classifier for supervised cell type identification

Yachen Tang et al. PeerJ. .

Abstract

Background: Automatic cell type identification has been an urgent task for the rapid development of single-cell RNA-seq techniques. Generally, the current approach for cell type identification is to generate cell clusters by unsupervised clustering and later assign labels to each cell cluster with manual annotation.

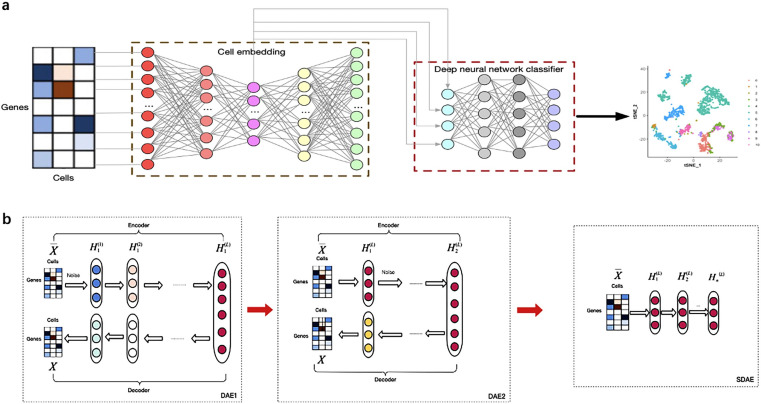
Methods: Here, we introduce LIDER (celL embeddIng based Deep nEural netwoRk classifier), a deep supervised learning method that combines cell embedding and deep neural network classifier for automatic cell type identification. Based on a stacked denoising autoencoder with a tailored and reconstructed loss function, LIDER identifies cell embedding and predicts cell types with a deep neural network classifier. LIDER was developed upon a stacked denoising autoencoder to learn encoder-decoder structures for identifying cell embedding.

Results: LIDER accurately identifies cell types by using stacked denoising autoencoder. Benchmarking against state-of-the-art methods across eight types of single-cell data, LIDER achieves comparable or even superior enhancement performance. Moreover, LIDER suggests comparable robust to batch effects. Our results show a potential in deep supervised learning for automatic cell type identification of single-cell RNA-seq data. The LIDER codes are available at https://github.com/ShiMGLab/LIDER.

Keywords: Cell embedding; Cell type identification; Deep neural network classifier; Stacked denoising autoencoders.


Conflict of interest statement

The authors declare there are no competing interests.

Figures

Figure 1
Figure 1. Building a multi-class scRNA-seq classifier with stacked denoising autoencoder and deep neural network classifier.
(A) ScRNA-seq data are collected and z-score transformed. LIDER generates cell embeddings using stacked denoising autoencoder. A deep neural network classifier is then developed by using Adam algorithm for classification tasks. Finally, the cell types are identified by the developed multi-class scRNA-seq classifier. (B) The development of stacked denoising autoencoders. After training the first level denoising autoencoders (DAE1), the obtained representation is used to train the second level denoising autoencoders (DAE2). Stacked denoising autoencoders (SDAE) are usually developed by multiple stacking layers of denoising autoencoders. DAE represents denoising autoencoder and SDAE represents stacked denoising autoencoder respectively.
Figure 2
Figure 2. Accuracy of validated test dataset from eight real single-cell transcriptomic datasets by using LIDER.
We randomly divide the single-cell transcriptomic data into 80% training dataset and 20% test dataset respectively. The deep neural network classifier is trained on the training set, validated on the test dataset, and evaluated based on accuracy. Zeisel (0.965), Segerstolpe (0.895), Tasic (0.983), PBMC (0.865), Macparland (0.961), Yan (1), Mouse (0.857), CRC (0.945).
Figure 3
Figure 3. LIDER improves prediction performance for cell type identification.
Accuracy of validated test dataset by using LIDER, logistic regression multiclassification algorithm (LR), Moana, SingleCellNet and ACTINN for eight single-cell transcriptomic datasets. In this analysis, 80% training dataset and 20% test dataset are divided from the whole single-cell transcriptomic data. Each subplot represents the accuracy from LIDER and four baseline methods for each single-cell transcriptomic dataset. (A) Zeisel dataset. LIDER (0.965), LR (0.95), Moana (0.923), SingleCellNet (0.876), ACTINN (0.912). (B) Segerstolpe dataset. LIDER (0.895), LR (0.872), Moana (0.851), SingleCellNet (0.832), ACTINN (0.844). (C) Tasic dataset. LIDER (0.983), LR (0.972), Moana (0.951), SingleCellNet (0.88), ACTINN (0.934). (D) PBMC dataset. LIDER (0.865), LR (0.852), Moana (0.841), SingleCellNet (0.823), ACTINN (0.825). (E) MacParland dataset. LIDER (0.961), LR (0.946), Moana (0.912), SingleCellNet (0.863), ACTINN (0.891). (F) Yan dataset. LIDER (1), LR (0.972), Moana (0.93), SingleCellNet (0.911), ACTINN (0.918). (G) Mouse dataset. LIDER (0.857), LR (0.846), Moana (0.823), SingleCellNet (0.8), ACTINN (0.811). (H) CRC dataset. LIDER (0.945), LR (0.93), Moana (0.916), SingleCellNet (0.872), ACTINN (0.894).
Figure 4
Figure 4. LIDER achieves similar performance with the true identity of cell type.
Each sub-figure represents the 2D visualizations of the true cell types and the predicted labels from LIDER for eight single-cell transcriptomic datasets respectively. In each sub-figure, the left subplot represents the 2D visualization of the true identity of each cell, and the right subplot represents the 2D visualization of the predicted cell type from LIDER respectively. Each point represents a cell in each sub-figure. (A) Zeisel dataset. (B) Segerstolpe dataset. (C) Tasic dataset. (D) PBMC dataset. (E) MacParland dataset. (F) Yan dataset. (G) Mouse dataset. (H) CRC dataset.
Figure 5
Figure 5. Accuracy of validated test dataset by using LIDER and PCA based neural network classifier for eight single-cell transcriptomic datasets.
Each subplot represents the accuracy from LIDER and PCA based neural network classifier for each single-cell transcriptomic dataset. (A) Zeisel dataset. PCA + NN (0.897), LIDER (0.965). (B) Segerstolpe dataset. PCA + NN (0.842), LIDER (0.895). (C) Tasic dataset. PCA + NN (0.98), LIDER (0.983). (D) PBMC dataset. PCA + NN (0.851), LIDER (0.865). (E) MacParland dataset. PCA + NN (0.95), LIDER (0.961). (F) Yan dataset. PCA + NN (0.963), LIDER(1). (G) Mouse dataset. PCA + NN (0.811), LIDER (0.857). (H) CRC dataset. PCA + NN (0.934), LIDER (0.945).

References

    1. Ahsan MU, Liu Q, Fang L, Wang K. NanoCaller for accurate detection of SNPs and indels in difficult-to-map regions from long-read sequencing by haplotype-aware deep neural networks. Genome Biology. 2021;22(1):1–33. doi: 10.1186/s13059-020-02207-9. - DOI - PMC - PubMed
    1. Aibar S, González-Blas CB, Moerman T, Huynh-Thu VA, Imrichova H, Hulselmans G, Rambow F, Marine J-C, Geurts P, Aerts J. SCENIC: single-cell regulatory network inference and clustering. Nature Methods. 2017;14(11):1083–1086. doi: 10.1038/nmeth.4463. - DOI - PMC - PubMed
    1. Buettner F, Natarajan KN, Casale FP, Proserpio V, Scialdone A, Theis FJ, Teichmann SA, Marioni JC, Stegle O. Computational analysis of cell-to-cell heterogeneity in single-cell RNA-sequencing data reveals hidden subpopulations of cells. Nature Biotechnology. 2015;33(2):155–160. doi: 10.1038/nbt.3102. - DOI - PubMed
    1. Cao F, Zhang Y, Cai Y, Animesh S, Zhang Y, Akincilar S, Loh YP, Chng WJ, Tergaonkar V, Kwoh CK. Chromatin Interaction Neural Network (ChINN): a machine learning-based method for predicting chromatin interactions from DNA sequences. bioRxiv. 2021:2020.2012.2030.424817. - PMC - PubMed
    1. Chen J, Rénia L, Ginhoux F. Constructing cell lineages from single-cell transcriptomes. Molecular Aspects of Medicine. 2018;59:95–113. doi: 10.1016/j.mam.2017.10.004. - DOI - PubMed

Publication types

MeSH terms

LinkOut - more resources