

Quantitative analysis of chest MRI images for benign malignant diagnosis of pulmonary solid nodules
- PMID: 37601669
- PMCID: PMC10436991
- DOI: 10.3389/fonc.2023.1212608
Quantitative analysis of chest MRI images for benign malignant diagnosis of pulmonary solid nodules
Abstract
Background: In this study, we developed and validated machine learning (ML) models by combining radiomic features extracted from magnetic resonance imaging (MRI) with clinicopathological factors to assess pulmonary nodule classification for benign malignant diagnosis.
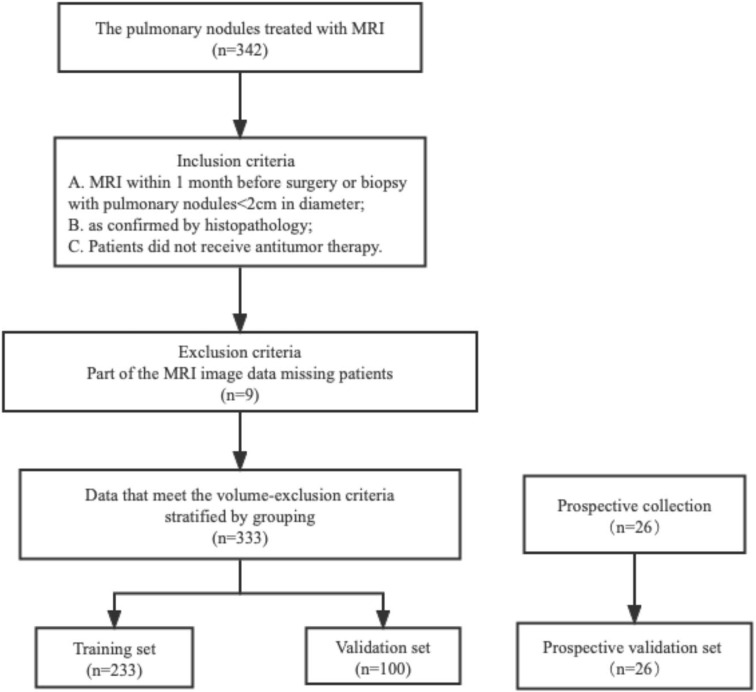
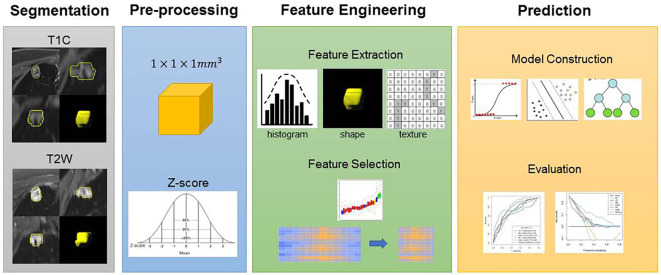
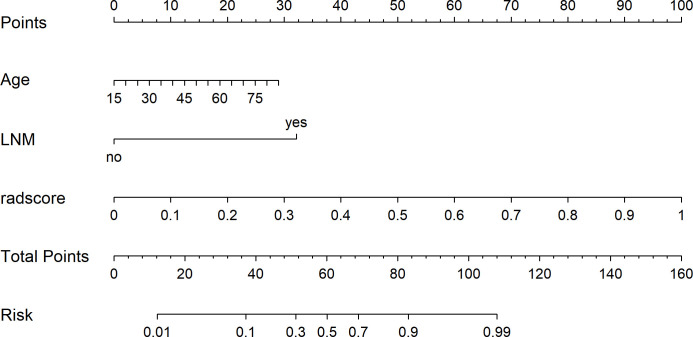
Methods: A total of 333 consecutive patients with pulmonary nodules (233 in the training cohort and 100 in the validation cohort) were enrolled. A total of 2,824 radiomic features were extracted from the MRI images (CE T1w and T2w). Logistic regression (LR), Naïve Bayes (NB), support vector machine (SVM), random forest (RF), and extreme gradient boosting (XGBoost) classifiers were used to build the predictive models, and a radiomics score (Rad-score) was obtained for each patient after applying the best prediction model. Clinical factors and Rad-scores were used jointly to build a nomogram model based on multivariate logistic regression analysis, and the diagnostic performance of the five prediction models was evaluated using the area under the receiver operating characteristic curve (AUC).
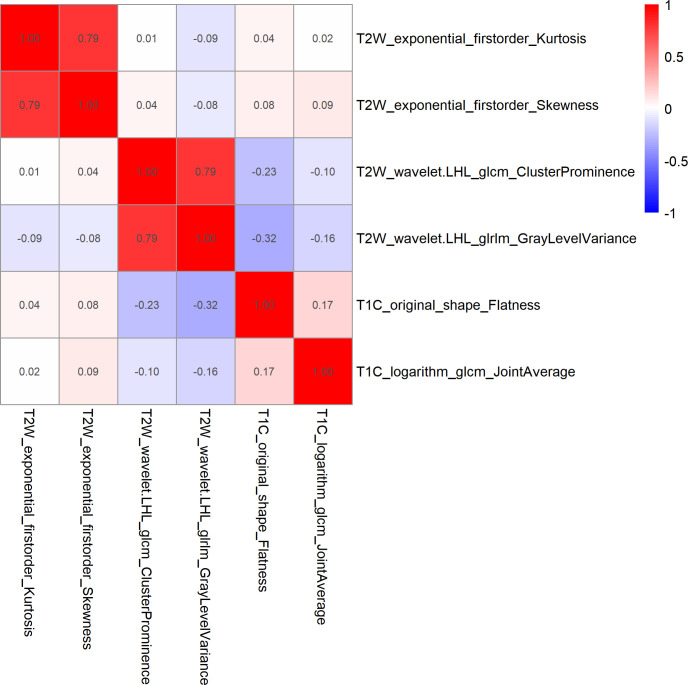
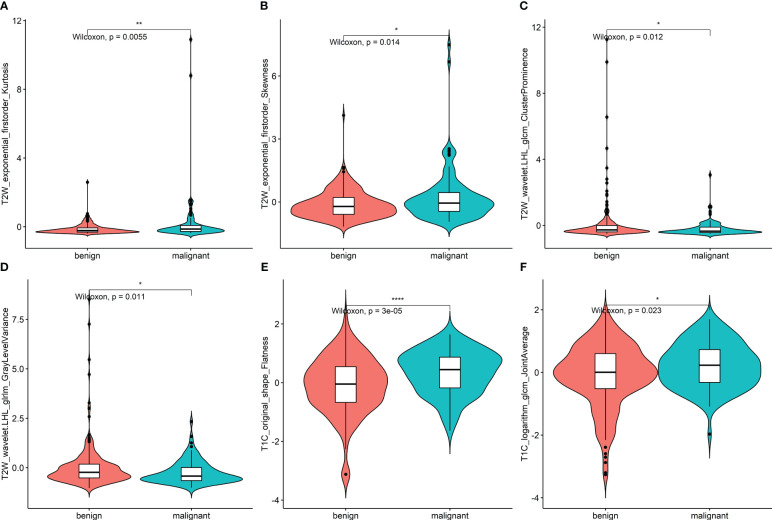
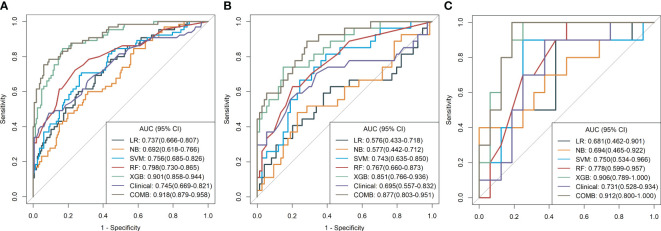
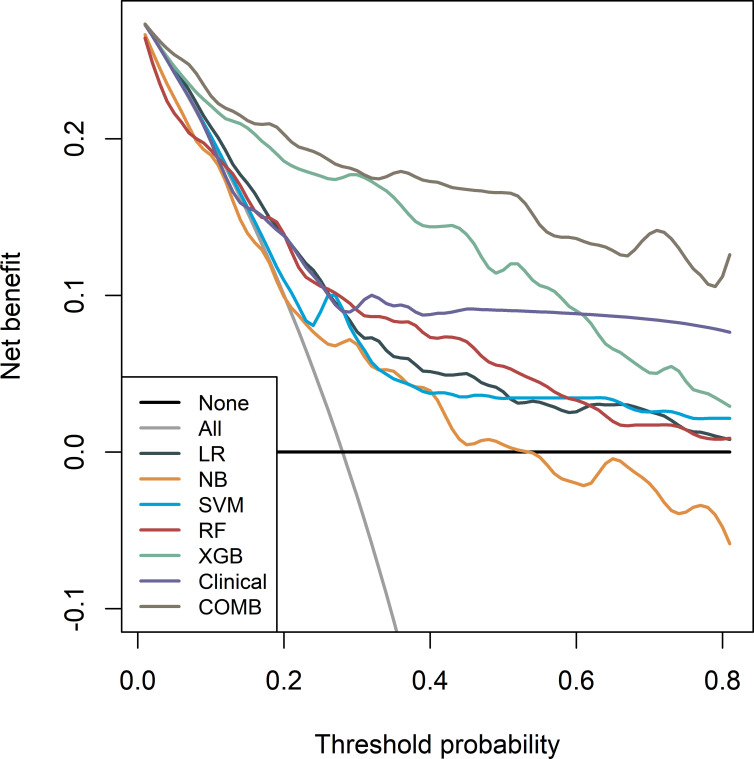
Results: A total of 161 women (48.35%) and 172 men (51.65%) with pulmonary nodules were enrolled. Six important features were selected from the 2,145 radiomic features extracted from CE T1w and T2w images. The XGBoost classifier model achieved the highest discrimination performance with AUCs of 0.901, 0.906, and 0.851 in the training, validation, and test cohorts, respectively. The nomogram model improved the performance with AUC values of 0.918, 0.912, and 0.877 in the training, validation, and test cohorts, respectively.
Conclusion: MRI radiomic ML models demonstrated good nodule classification performance with XGBoost, which was superior to that of the other four models. The nomogram model achieved higher performance with the addition of clinical information.
Keywords: differential diagnosis; machine learning; magnetic resonance imaging; pulmonary nodules; radiomics.
Copyright © 2023 Yang, Gao, Lu, Wang, Wu, Shen, Ren, Wu and Xu.
Conflict of interest statement
Author JR was employed by the company GE Healthcare. The remaining authors declare that the research was conducted in the absence of any commercial or financial relationships that could be construed as a potential conflict of interest.
Figures
Similar articles
-
Magnetic resonance radiomic feature performance in pulmonary nodule classification and impact of segmentation variability on radiomics.Br J Radiol. 2022 Dec 1;95(1140):20220230. doi: 10.1259/bjr.20220230. Epub 2022 Nov 15. Br J Radiol. 2022. PMID: 36367095 Free PMC article.
-
Prediction of the Ki-67 expression level in head and neck squamous cell carcinoma with machine learning-based multiparametric MRI radiomics: a multicenter study.BMC Cancer. 2024 Apr 5;24(1):418. doi: 10.1186/s12885-024-12026-x. BMC Cancer. 2024. PMID: 38580939 Free PMC article.
-
Multiclassifier fusion based on radiomics features for the prediction of benign and malignant primary pulmonary solid nodules.Ann Transl Med. 2020 Mar;8(5):171. doi: 10.21037/atm.2020.01.135. Ann Transl Med. 2020. PMID: 32309318 Free PMC article.
-
Establishment and verification of a prediction model based on clinical characteristics and computed tomography radiomics parameters for distinguishing benign and malignant pulmonary nodules.J Thorac Dis. 2024 Mar 29;16(3):1984-1995. doi: 10.21037/jtd-23-1400. Epub 2024 Mar 18. J Thorac Dis. 2024. PMID: 38617763 Free PMC article.
-
Integration of ultrasound radiomics features and clinical factors: A nomogram model for identifying the Ki-67 status in patients with breast carcinoma.Front Oncol. 2022 Oct 5;12:979358. doi: 10.3389/fonc.2022.979358. eCollection 2022. Front Oncol. 2022. PMID: 36276108 Free PMC article.
Cited by
-
Development of a clinical prediction model for benign and malignant pulmonary nodules with a CTR ≥ 50% utilizing artificial intelligence-driven radiomics analysis.BMC Med Imaging. 2025 Jan 17;25(1):21. doi: 10.1186/s12880-024-01533-9. BMC Med Imaging. 2025. PMID: 39825237 Free PMC article.
-
Innovative technologies and their clinical prospects for early lung cancer screening.Clin Exp Med. 2025 Jun 18;25(1):212. doi: 10.1007/s10238-025-01752-6. Clin Exp Med. 2025. PMID: 40533607 Free PMC article. Review.
-
Improving Diagnostic Performance for Head and Neck Tumors with Simple Diffusion Kurtosis Imaging and Machine Learning Bi-Parameter Analysis.Diagnostics (Basel). 2025 Mar 20;15(6):790. doi: 10.3390/diagnostics15060790. Diagnostics (Basel). 2025. PMID: 40150132 Free PMC article.
References
LinkOut - more resources
Full Text Sources