. 2023 Aug 3:13:1216911.
doi: 10.3389/fonc.2023.1216911. eCollection 2023.

Metformin is a metabolic modulator and radiosensitiser in rectal cancer

Affiliations

Metformin is a metabolic modulator and radiosensitiser in rectal cancer

Croí E Buckley et al. Front Oncol. .

Abstract

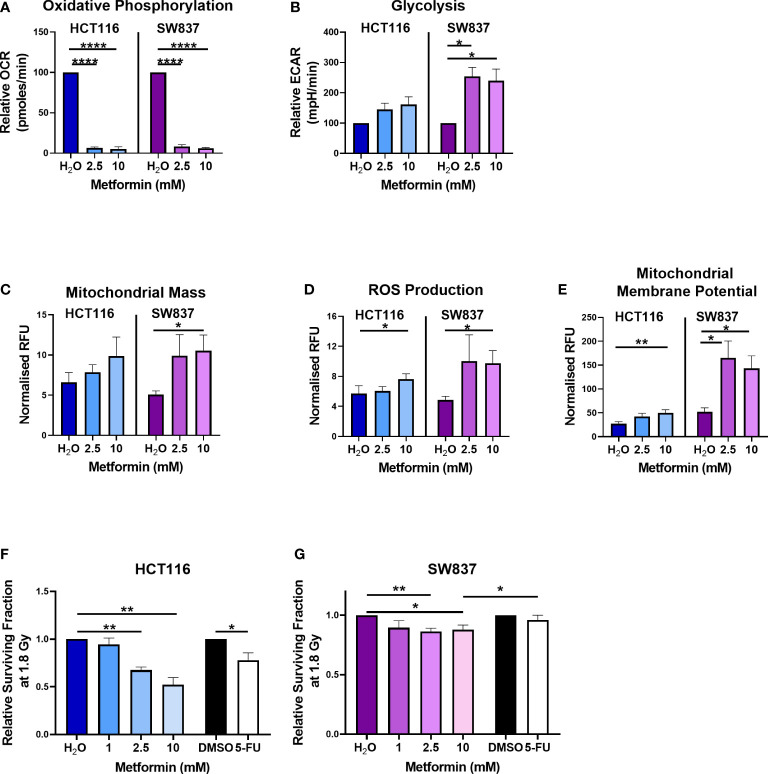
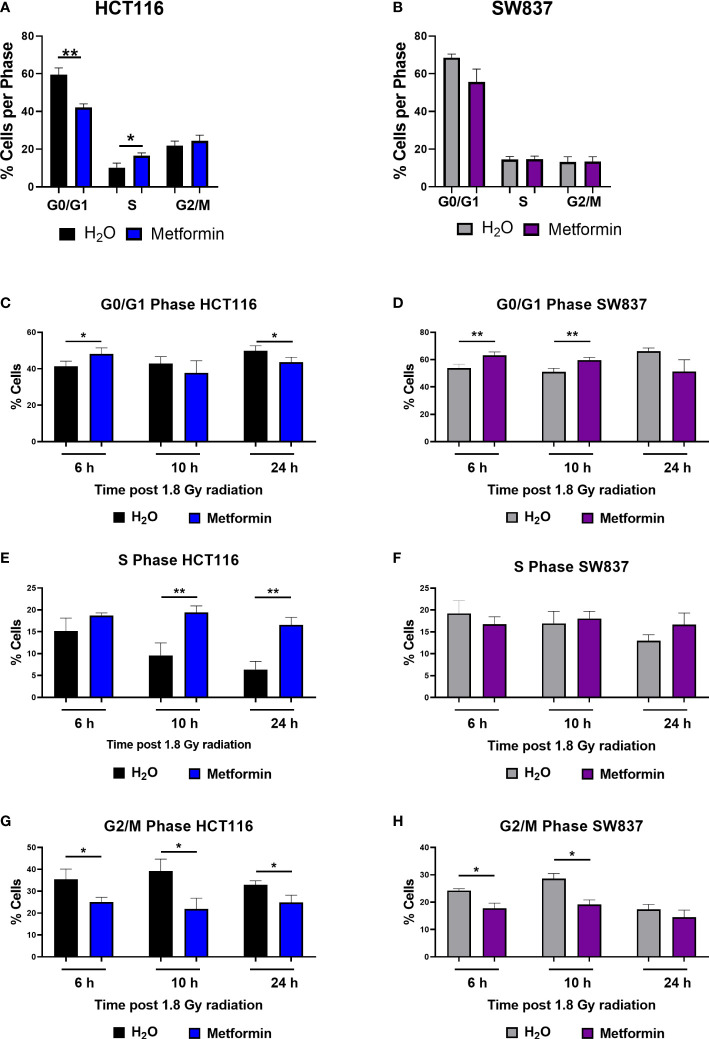
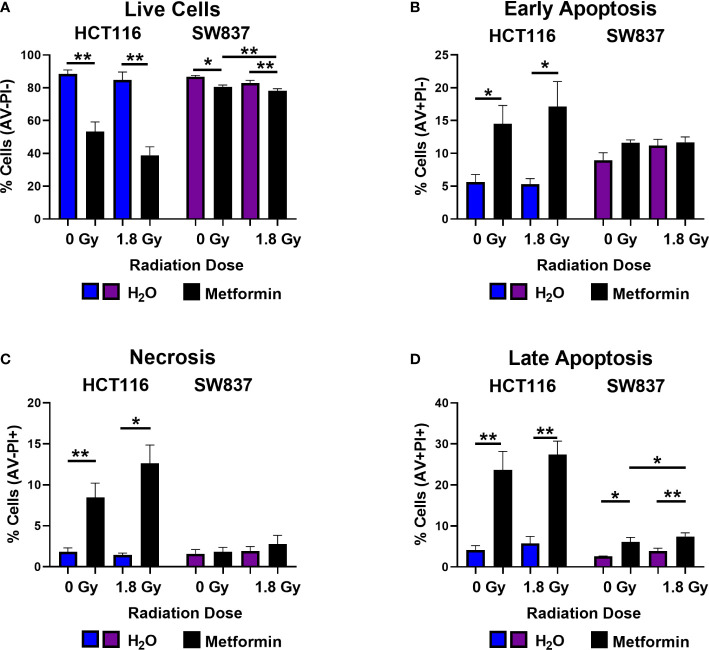
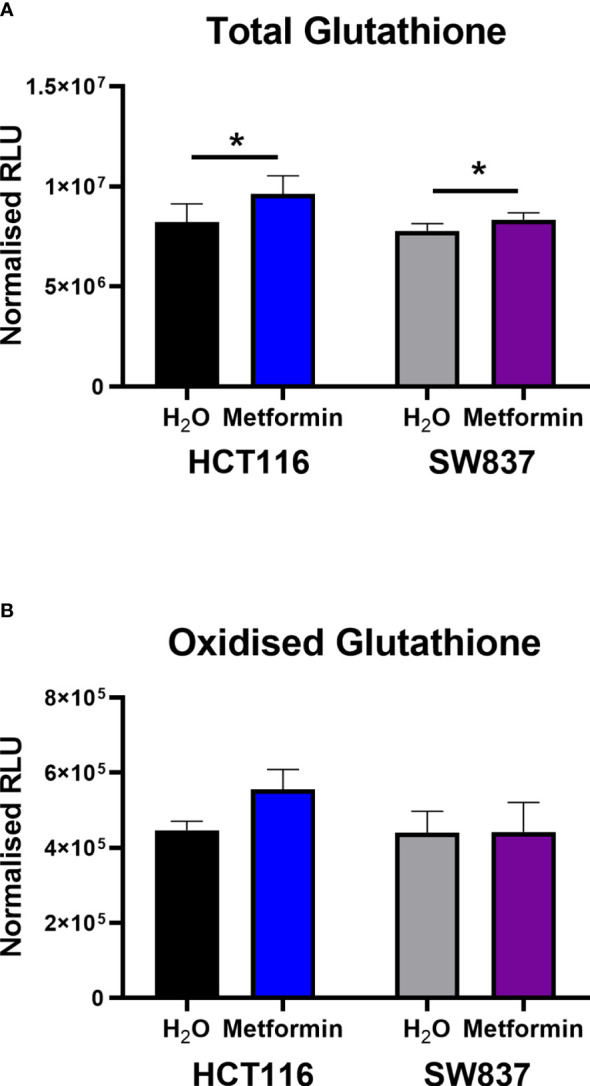
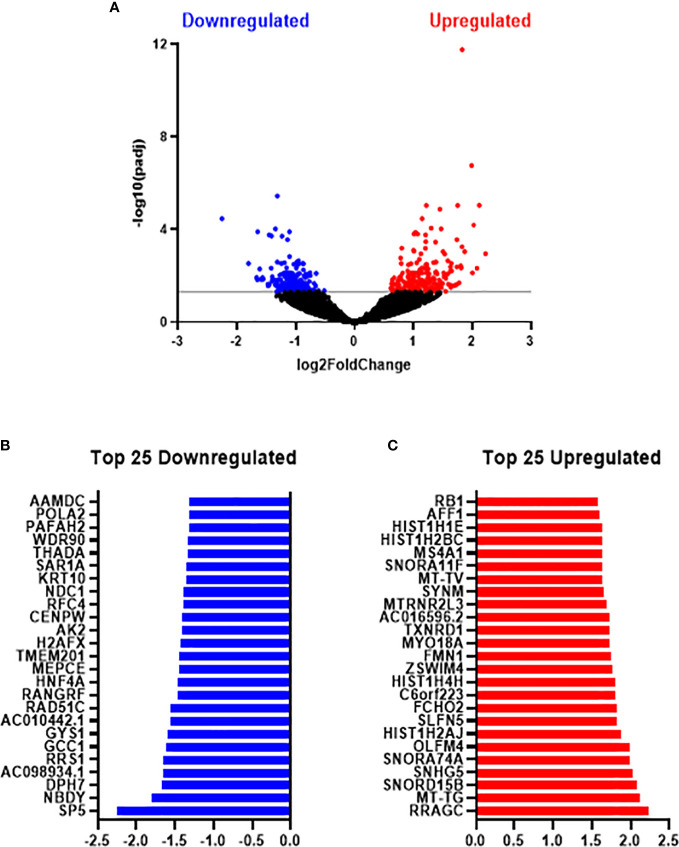
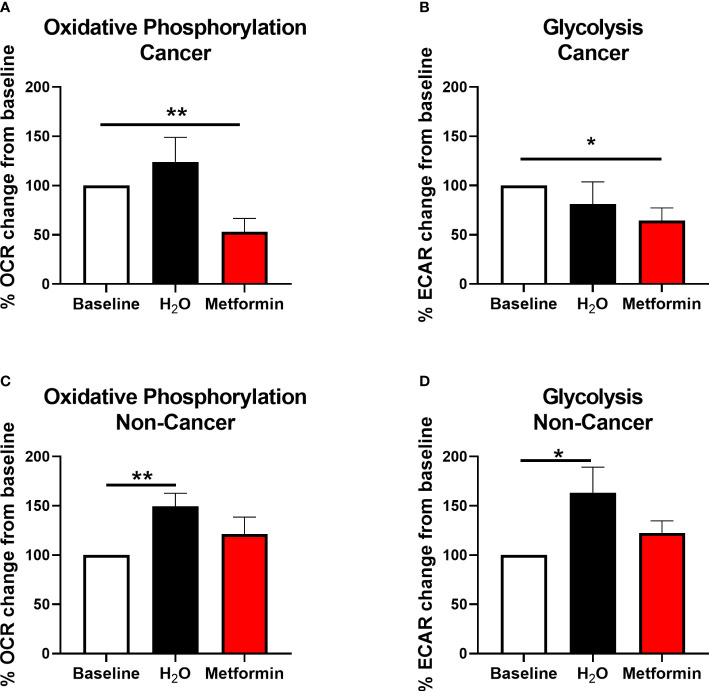
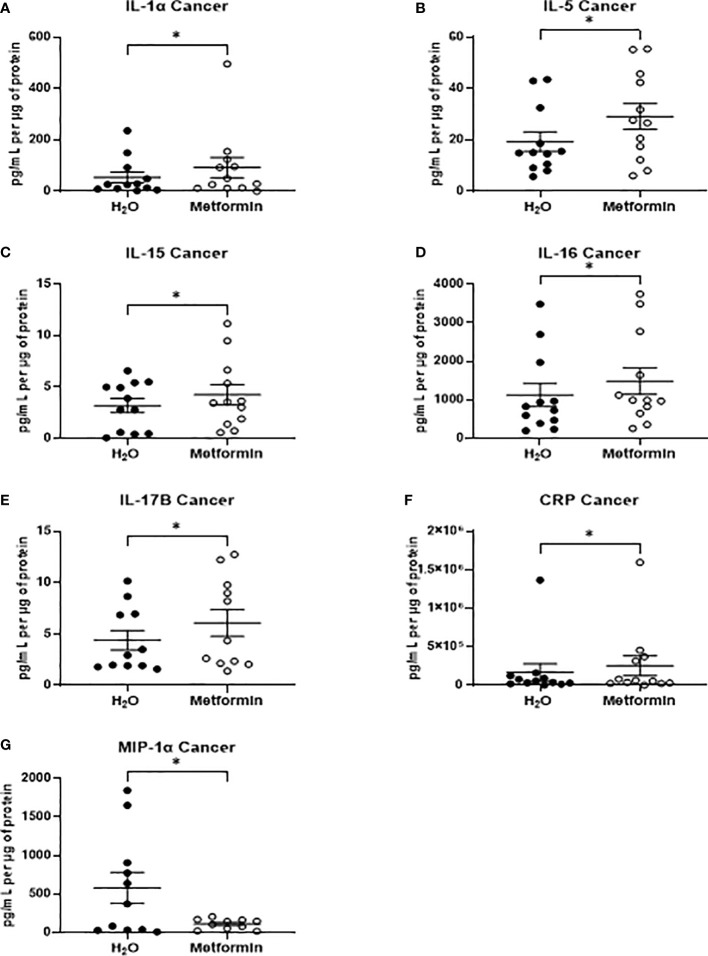
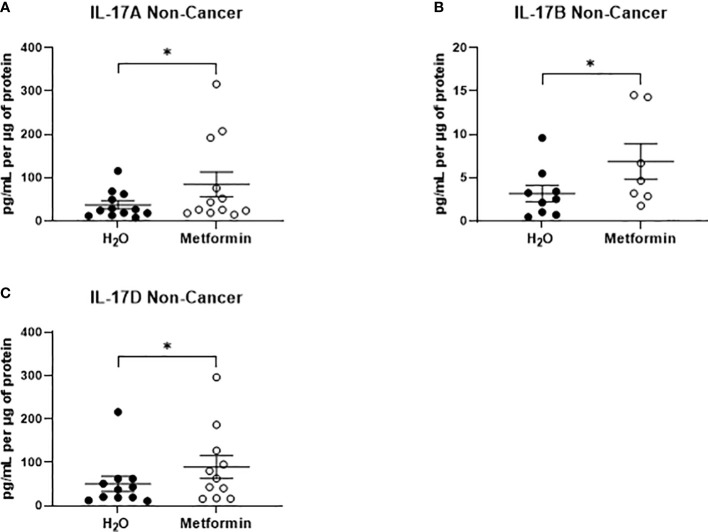
Resistance to neoadjuvant chemoradiation therapy, is a major challenge in the management of rectal cancer. Increasing evidence supports a role for altered energy metabolism in the resistance of tumours to anti-cancer therapy, suggesting that targeting tumour metabolism may have potential as a novel therapeutic strategy to boost treatment response. In this study, the impact of metformin on the radiosensitivity of colorectal cancer cells, and the potential mechanisms of action of metformin-mediated radiosensitisation were investigated. Metformin treatment was demonstrated to significantly radiosensitise both radiosensitive and radioresistant colorectal cancer cells in vitro. Transcriptomic and functional analysis demonstrated metformin-mediated alterations to energy metabolism, mitochondrial function, cell cycle distribution and progression, cell death and antioxidant levels in colorectal cancer cells. Using ex vivo models, metformin treatment significantly inhibited oxidative phosphorylation and glycolysis in treatment naïve rectal cancer biopsies, without affecting the real-time metabolic profile of non-cancer rectal tissue. Importantly, metformin treatment differentially altered the protein secretome of rectal cancer tissue when compared to non-cancer rectal tissue. Together these data highlight the potential utility of metformin as an anti-metabolic radiosensitiser in rectal cancer.

Keywords: colorectal; energy metabolism; metformin; radioresistance; radiosensitiser; rectal cancer.


Conflict of interest statement

The authors declare that the research was conducted in the absence of any commercial or financial relationships that could be construed as a potential conflict of interest.

Figures

Figure 1
Figure 1
Metformin alters energy metabolism, mitochondrial function and radiosensitivity in CRC cells. HCT116 and SW837 cells were treated with metformin (2.5 mM or 10 mM) or vehicle control (H2O) for 24 h, and energy metabolism and mitochondrial function was assessed using Seahorse technology and fluorescent probes, respectively. (A) OCR (B) ECAR (C) Mitochondrial mass (D) ROS production (E) Mitochondrial membrane potential. HCT116 cells and SW837 cells were treated with metformin (1 mM, 2.5 mM, 10 mM) or H2O vehicle control for 24 h, or 5-FU (15 µM) or DMSO control (0.001%) for 6 h, prior to irradiation with 1.8 Gy X-ray radiation and radiosensitivity was assessed by clonogenic assay. (F) Surviving fraction of HCT116 cells irradiated with 1.8 Gy following pre-treatment with metformin, 5-FU or vehicle controls. (G) Surviving fraction of SW837 cells irradiated with 1.8 Gy following pre-treatment with metformin, 5-FU or vehicle controls. Data is presented as mean ± SEM for at least 3 independent experiments. Statistical analysis was performed using t-testing or ANOVA as appropriate. *p < 0.05, **p < 0.01, ****p < 0.0001.
Figure 2
Figure 2
Metformin significantly alters basal cell cycle distribution and radiation-induced cell cycle progression in CRC cells. HCT116 and SW837 cells were treated with metformin (10 mM) or H2O vehicle control for 24 h before irradiation with 1.8 Gy X-ray radiation. Controls were mock irradiated. Cell cycle distribution was assessed basally and at 6 h, 10 h and 24 h post irradiation by PI staining and flow cytometry. (A) Basal cell cycle in HCT116 cells following treatment (48 h) with metformin or vehicle control. (B) Basal cell cycle in SW837 cells following treatment (48 h) with metformin or vehicle control. Proportion of G0/G1 phase cells following metformin and radiation treatment in (C) HCT116 and (D) SW837 cells. Proportion of S phase cells following metformin and radiation treatment in (E) HCT116 and (F) SW837 cells. Proportion of G/M phase cells following metformin and radiation treatment in (G) HCT116 and (H) SW837 cells. Data is presented as mean ± SEM for at least 4 independent experiments. Statistical analysis was performed using paired t-testing. *p < 0.05, **p < 0.01.
Figure 3
Figure 3
Metformin induces cell death in HCT116 and SW837 cells basally and following X-ray radiation. HCT116 and SW837 cells were treated with metformin (10 mM) or H2O vehicle control for 24 h, either mock-irradiated or exposed to 1.8 Gy X-ray radiation, and cell death was assessed by Annexin V/PI staining and flow cytometry at 48 h post irradiation/72 h post metformin treatment. (A) Live cells. (B) Early apoptotic cells. (C) Necrotic cells. (D) Late Apoptotic cells. Data is presented as mean ± SEM for 5 independent experiments. Statistical analysis was performed by paired t-testing. *p<0.05, **p< 0.01.
Figure 4
Figure 4
Metformin significantly increases GSH levels in HCT116 and SW837 cells. GSH and GSSG levels were assessed by GSSG/GSH-Glo™ luminescent assay in HCT116 and SW837 cells at 24 h post treatment with either metformin (10mM) or H2O vehicle control. (A) Total GSH levels in HCT116 and SW837 cells. (B) GSSG levels in HCT116 and SW837 cells. Data is presented as mean ± SEM for n=5 (HCT116) or n=6 (SW837) independent experiments. Statistical analysis was performed by paired t-testing *p < 0.05.
Figure 5
Figure 5
Metformin significantly alters the transcriptome of radioresistant SW837 cells. SW837 cells were treated with Metformin (10 mM) or H2O vehicle control for 24 h and transcriptomics was performed using the Lexogen QuantSeq 3’ mRNA-Seq sequencing platform. (A) Volcano plot demonstrating 407 genes significantly altered in SW837 cells treated with metformin, when compared to H2O vehicle control. The y-axis corresponds to the -log10(p-adj), and the x-axis represents the Log2 (Fold Change). Dots in blue and red represent the significantly downregulated/upregulated genes in metformin treated SW837 cells. Dots in black represent the genes that did not reach statistical significance (p-adj > 0.05). (B) The top 25 downregulated genes (by fold change) in SW837 cells treated with metformin, when compared to H2O vehicle control. (C) The top 25 upregulated genes (by fold change) in metformin treated SW837 cells, when compared to H2O vehicle control. Data is presented for 4 independent experiments. Statistical analysis was performed using the Wald test, with corrections for multiple comparisons performed by the Benjamini-Hochberg correction (FDR).
Figure 6
Figure 6
Metformin alters metabolism in rectal cancer tissue biopsies. OCR and ECAR were measured in treatment naïve rectal cancer biopsies or normal, non-cancer rectal tissue prior to and 24 h post treatment with metformin (10 mM) or H2O vehicle control using the Seahorse XFe24 analyser. (A) OCR percentage change from baseline following treatment with metformin or H2O vehicle control in rectal cancer biopsies. (B) ECAR percentage change from baseline following treatment with metformin or H2O vehicle control in rectal cancer biopsies. (C) OCR percentage change from baseline following treatment with metformin or H2O vehicle control in normal, non-cancer rectal tissue. (D) ECAR percentage change from baseline following treatment with metformin or H2O vehicle control in normal, non-cancer rectal tissue. Data is normalised to protein content and presented as mean ± SEM. n =10 (cancer) or n = 12 (non-cancer). Statistical analysis was performed using Wilcoxon matched pairs signed rank test. *p < 0.05, **p< 0.01.
Figure 7
Figure 7
Metformin alters the inflammatory secretome of rectal cancer tissue biopsies. Treatment naïve rectal cancer tissue biopsies were treated with metformin (10 mM) or H2O vehicle control for 24h, TCM was collected and profiled using multiplex ELISA. (A) IL-1α (B) IL-5 from (C) IL-15 (D) IL-16, (E) IL-17B (F) CRP and (G) MIP-1α were significantly altered in TCM following metformin treatment. Data is normalised to protein content and presented from n=12 patient samples. Statistical analysis was performed by Wilcoxon signed rank t-test. *p < 0.05.
Figure 8
Figure 8
Metformin significantly alters the secretion of IL-17 related cytokines from non-cancer rectal tissue. Normal, non-cancer rectal tissue biopsies were treated with metformin (10 mM) or H2O vehicle control for 24h, NCM was collected and profiled using multiplex ELISA. (A) IL-17A, (B) IL-17B and (C) IL-17D were significantly altered in NCM treated with metformin. Data is normalised to protein content and presented from n=12 patient samples. Statistical analysis was performed by Wilcoxon signed rank t-test. *p < 0.05.

Similar articles

Cited by

References

    1. Sung H, Ferlay J, Siegel RL, Laversanne M, Soerjomataram I, Jemal A, et al. Global cancer statistics 2020: GLOBOCAN estimates of incidence and mortality worldwide for 36 cancers in 185 countries. CA Cancer J Clin (2021) 71(3):209–49. doi: 10.3322/caac - DOI - PubMed
    1. National Cancer Registry Ireland (NCRI) . Cancer Incidence Projections for Ireland 2020-2045. Cork, Ireland: National Cancer Registry; (2019).
    1. Araghi M, Soerjomataram I, Bardot A, Ferlay J, Cabasag CJ, Morrison DS, et al. Changes in colorectal cancer incidence in seven high-income countries: a population-based study. Lancet Gastroenterol Hepatol (2019) 4(7):511–8. doi: 10.1016/S2468-1253(19)30147-5 - DOI - PMC - PubMed
    1. Vuik FE, Nieuwenburg SA, Bardou M, Lansdorp-Vogelaar I, Dinis-Ribeiro M, Bento MJ, et al. Increasing incidence of colorectal cancer in young adults in Europe over the last 25 years. Gut (2019) 68(10):1820–6. doi: 10.1136/gutjnl-2018-317592 - DOI - PMC - PubMed
    1. Ullah MF, Fleming CA, Mealy K. Changing trends in age and stage of colorectal cancer presentation in Ireland - From the nineties to noughties and beyond. Surgeon (2018) 16(6):350–4. doi: 10.1016/j.surge.2018.03.006 - DOI - PubMed

LinkOut - more resources