Photoactivatable Fluorophores for Bioimaging Applications
- PMID: 37601830
- PMCID: PMC10437147
- DOI: 10.1021/acsaom.3c00025
Photoactivatable Fluorophores for Bioimaging Applications
Abstract
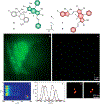
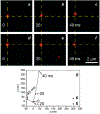
Photoactivatable fluorophores provide the opportunity to switch fluorescence on exclusively in a selected area within a sample of interest at a precise interval of time. Such a level of spatiotemporal fluorescence control enables the implementation of imaging schemes to monitor dynamic events in real time and visualize structural features with nanometer resolution. These transformative imaging methods are contributing fundamental insights on diverse cellular processes with profound implications in biology and medicine. Current photoactivatable fluorophores, however, become emissive only after the activation event, preventing the acquisition of fluorescence images and, hence, the visualization of the sample prior to activation. We developed a family of photoactivatable fluorophores capable of interconverting between emissive states with spectrally resolved fluorescence, instead of switching from a nonemissive state to an emissive one. We demonstrated that our compounds allow the real-time monitoring of molecules diffusing across the cellular blastoderm of developing embryos as well as of polymer beads translocating along the intestinal tract of live nematodes. Additionally, they also permit the tracking of single molecules in the lysosomal compartments of live cells and the visualization of these organelles with nanometer resolution. Indeed, our photoactivatable fluorophores may evolve into invaluable analytical tools for the investigation of the fundamental factors regulating the functions and structures of cells at the molecular level.
Keywords: fluorescence photoactivation and dissipation (FPD); photoactivatable fluorophores (PAFs); photoactivated localization microscopy (PALM); photochemical barcoding, single-molecule localization microscopy (SMLM); single-particle tracking photoactivated localization microscopy (spt-PALM).
Conflict of interest statement
The authors declare no competing financial interest.
Figures


Similar articles
-
Photoactivatable BODIPYs for Live-Cell PALM.Molecules. 2023 Mar 7;28(6):2447. doi: 10.3390/molecules28062447. Molecules. 2023. PMID: 36985424 Free PMC article. Review.
-
Photoactivatable fluorophores for single-molecule localization microscopy of live cells.Methods Appl Fluoresc. 2020 May 20;8(3):032002. doi: 10.1088/2050-6120/ab8c5c. Methods Appl Fluoresc. 2020. PMID: 32325443 Review.
-
Photoactivatable synthetic fluorophores.Phys Chem Chem Phys. 2013 Sep 28;15(36):14840-50. doi: 10.1039/c3cp51822a. Phys Chem Chem Phys. 2013. PMID: 23780303
-
Live-Cell Imaging at the Nanoscale with Bioconjugatable and Photoactivatable Fluorophores.Bioconjug Chem. 2020 Apr 15;31(4):1052-1062. doi: 10.1021/acs.bioconjchem.0c00073. Epub 2020 Mar 18. Bioconjug Chem. 2020. PMID: 32150390
-
A Photoswitchable Fluorophore for the Real-Time Monitoring of Dynamic Events in Living Organisms.Chemistry. 2016 Oct 10;22(42):15027-15034. doi: 10.1002/chem.201603545. Epub 2016 Aug 30. Chemistry. 2016. PMID: 27571689
Cited by
-
No-wash fluorogenic labeling of proteins for reversible photoswitching in live cells.Chem Sci. 2023 Dec 18;15(4):1393-1401. doi: 10.1039/d3sc04953a. eCollection 2024 Jan 24. Chem Sci. 2023. PMID: 38274070 Free PMC article.
-
Hydroxy-pendant tetrazole as the cage group for photoactivatable push-pull fluorophores.Chem Sci. 2025 Jun 24;16(30):13847-13854. doi: 10.1039/d5sc03279b. eCollection 2025 Jul 30. Chem Sci. 2025. PMID: 40611996 Free PMC article.
-
Photoactivation of BODIPY Fluorescence with Green Light.J Org Chem. 2025 Jun 20;90(24):8214-8227. doi: 10.1021/acs.joc.5c00668. Epub 2025 Jun 6. J Org Chem. 2025. PMID: 40479737 Free PMC article.
References
-
- Lakowicz JR Principles of Fluorescence Spectroscopy; Springer: New York, 2006.
-
- Mitchison TJ; Sawin KE; Theriot JA; Gee K; Mallavarapu A Caged fluorescent probes. Methods Enzymol. 1998, 291, 63–78. - PubMed
-
- Wysocki LM; Lavis LD Advances in the chemistry of small molecule fluorescent probes. Curr. Opin. Chem. Biol 2011, 15, 752–759. - PubMed
-
- Puliti D; Warther D; Orange C; Specht A; Goeldner M Small photoactivatable molecules for controlled fluorescence activation. Bioorg. Med. Chem 2011, 19, 1023–1029. - PubMed
-
- Raymo FM Photoactivatable synthetic dyes for fluorescence imaging at the nanoscale. J. Phys. Chem. Lett 2012, 3, 2379–2385. - PubMed
Grants and funding
LinkOut - more resources
Full Text Sources
