

Unsupervised machine learning algorithms identify expected haemorrhage relationships but define unexplained coagulation profiles mapping to thrombotic phenotypes in hereditary haemorrhagic telangiectasia
- PMID: 37601877
- PMCID: PMC10435691
- DOI: 10.1002/jha2.746
Unsupervised machine learning algorithms identify expected haemorrhage relationships but define unexplained coagulation profiles mapping to thrombotic phenotypes in hereditary haemorrhagic telangiectasia
Abstract
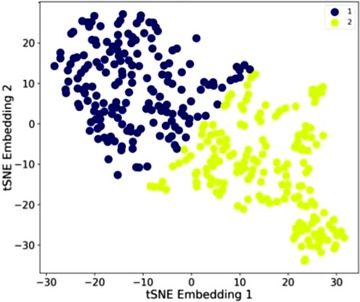
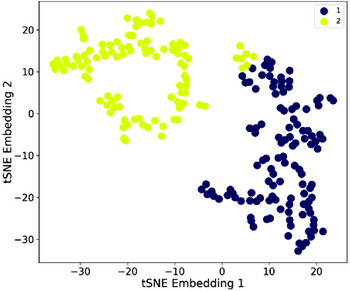
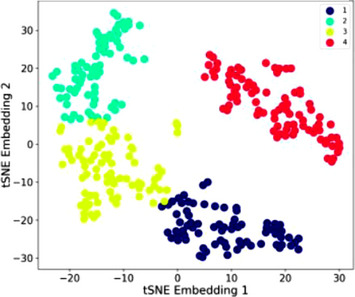
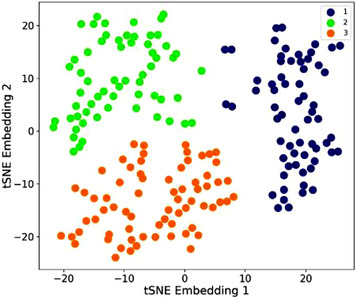
Hereditary haemorrhagic telangiectasia (HHT) can result in challenging anaemia and thrombosis phenotypes. Clinical presentations of HHT vary for relatives with identical casual mutations, suggesting other factors may modify severity. To examine objectively, we developed unsupervised machine learning algorithms to test whether haematological data at presentation could be categorised into sub-groupings and fitted to known biological factors. With ethical approval, we examined 10 complete blood count (CBC) variables, four iron index variables, four coagulation variables and eight iron/coagulation indices combined from 336 genotyped HHT patients (40% male, 60% female, 86.5% not using iron supplementation) at a single centre. T-SNE unsupervised, dimension reduction, machine learning algorithms assigned each high-dimensional datapoint to a location in a two-dimensional plane. k-Means clustering algorithms grouped into profiles, enabling visualisation and inter-profile comparisons of patients' clinical and genetic features. The unsupervised machine learning algorithms using t-SNE and k-Means identified two distinct CBC profiles, two iron profiles, four clotting profiles and three combined profiles. Validating the methodology, profiles for CBC or iron indices fitted expected patterns for haemorrhage. Distinct coagulation profiles displayed no association with age, sex, C-reactive protein, pulmonary arteriovenous malformations (AVMs), ENG/ACVRL1 genotype or epistaxis severity. The most distinct profiles were from t-SNE/k-Means analyses of combined iron-coagulation indices and mapped to three risk states - for venous thromboembolism in HHT; for ischaemic stroke attributed to paradoxical emboli through pulmonary AVMs in HHT; and for cerebral abscess attributed to odontogenic bacteremias in immunocompetent HHT patients with right-to-left shunting through pulmonary AVMs. In conclusion, unsupervised machine learning algorithms categorise HHT haematological indices into distinct, clinically relevant profiles which are independent of age, sex or HHT genotype. Further evaluation may inform prophylaxis and management for HHT patients' haemorrhagic and thrombotic phenotypes.
Keywords: anaemia; genetic disorders; haemorrhage; high‐dimensional data; t‐SNE.
© 2023 The Authors. eJHaem published by British Society for Haematology and John Wiley & Sons Ltd.
Conflict of interest statement
The authors have no conflicts of interest to declare.
Figures
Similar articles
-
Mutations in the ENG, ACVRL1, and SMAD4 genes and clinical manifestations of hereditary haemorrhagic telangiectasia: experience from the Center for Osler's Disease, Uppsala University Hospital.Ups J Med Sci. 2018 Sep;123(3):153-157. doi: 10.1080/03009734.2018.1483452. Epub 2018 Sep 25. Ups J Med Sci. 2018. PMID: 30251589 Free PMC article.
-
Molecular mechanisms and clinical manifestations of hereditary hemorrhagic telangiectasia.Thromb Res. 2024 Sep;241:109117. doi: 10.1016/j.thromres.2024.109117. Epub 2024 Aug 12. Thromb Res. 2024. PMID: 39151291
-
Mutational and clinical spectrum of Japanese patients with hereditary hemorrhagic telangiectasia.BMC Med Genomics. 2021 Dec 6;14(1):288. doi: 10.1186/s12920-021-01139-y. BMC Med Genomics. 2021. PMID: 34872578 Free PMC article.
-
Prevalence and characteristics of brain arteriovenous malformations in hereditary hemorrhagic telangiectasia: a systematic review and meta-analysis.J Neurosurg. 2017 Aug;127(2):302-310. doi: 10.3171/2016.7.JNS16847. Epub 2016 Oct 21. J Neurosurg. 2017. PMID: 27767404
-
Hereditary haemorrhagic telangiectasia and pregnancy: a review of the literature.Orphanet J Rare Dis. 2020 Jan 7;15(1):5. doi: 10.1186/s13023-019-1286-z. Orphanet J Rare Dis. 2020. PMID: 31910869 Free PMC article. Review.
Cited by
-
Pathogenic Variant Frequencies in Hereditary Haemorrhagic Telangiectasia Support Clinical Evidence of Protection from Myocardial Infarction.J Clin Med. 2023 Dec 31;13(1):250. doi: 10.3390/jcm13010250. J Clin Med. 2023. PMID: 38202257 Free PMC article.
-
Functional filter for whole-genome sequencing data identifies HHT and stress-associated non-coding SMAD4 polyadenylation site variants >5 kb from coding DNA.Am J Hum Genet. 2023 Nov 2;110(11):1903-1918. doi: 10.1016/j.ajhg.2023.09.005. Epub 2023 Oct 9. Am J Hum Genet. 2023. PMID: 37816352 Free PMC article.
References
-
- European Reference Network for Rare Vascular Disease (VASCERN): Hereditary haemorrhagic telangiectasia. Available from: www.orpha.net/consor/www/cgi‐bin/OC_Exp.php?lng=EN&Expert=774. Accessed 23 Oct 2022.
-
- Guttmacher AE, Marchuk DA, White RI. Hereditary hemorrhagic telangiectasia. New Engl J Med. 1995;333:918–24. - PubMed
-
- Shovlin CL. Hereditary haemorrhagic telangiectasia: pathophysiology, diagnosis and treatment. Blood Rev. 2010;24:203–19 - PubMed
-
- Hoag J, Terry P, Mitchell S, Reh D, Merlo C. An epistaxis severity score for hereditary hemorrhagic telangiectasia. Laryngoscope. 2010;120:838–43 - PubMed
LinkOut - more resources
Full Text Sources
Medical
Research Materials