. 2023 Jun 29;3(8):100349.
doi: 10.1016/j.xgen.2023.100349. eCollection 2023 Aug 9.

Fancm has dual roles in the limiting of meiotic crossovers and germ cell maintenance in mammals

Affiliations

Fancm has dual roles in the limiting of meiotic crossovers and germ cell maintenance in mammals

Vanessa Tsui et al. Cell Genom. .

Abstract

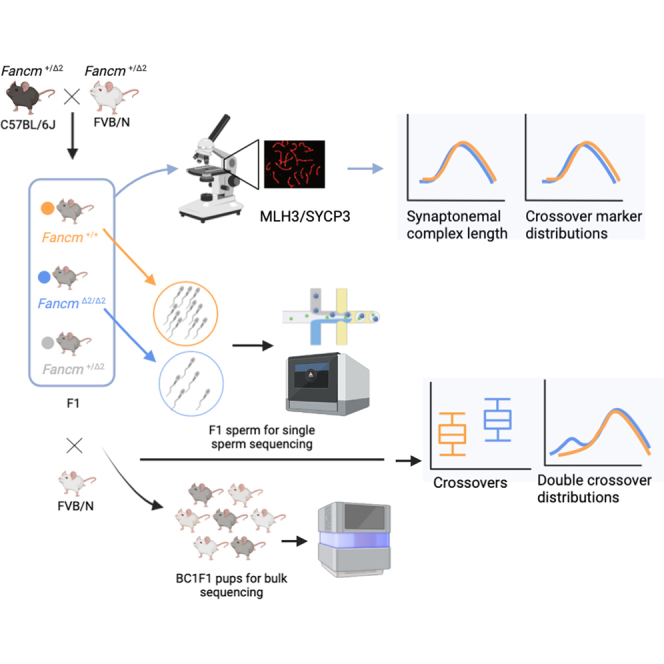
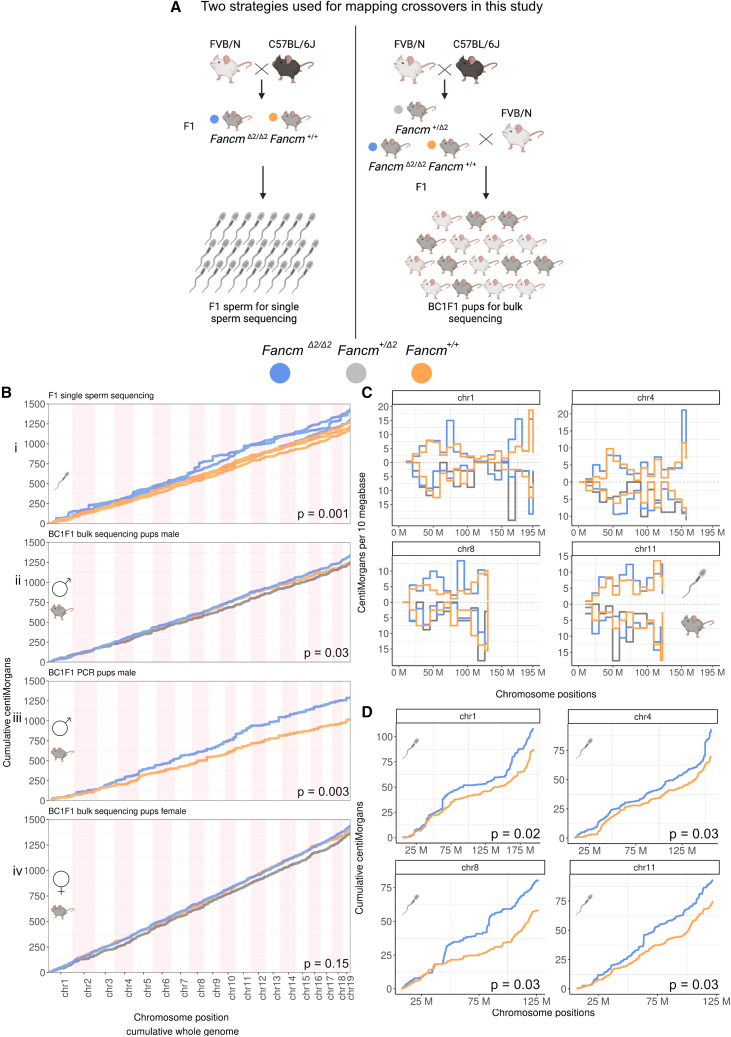
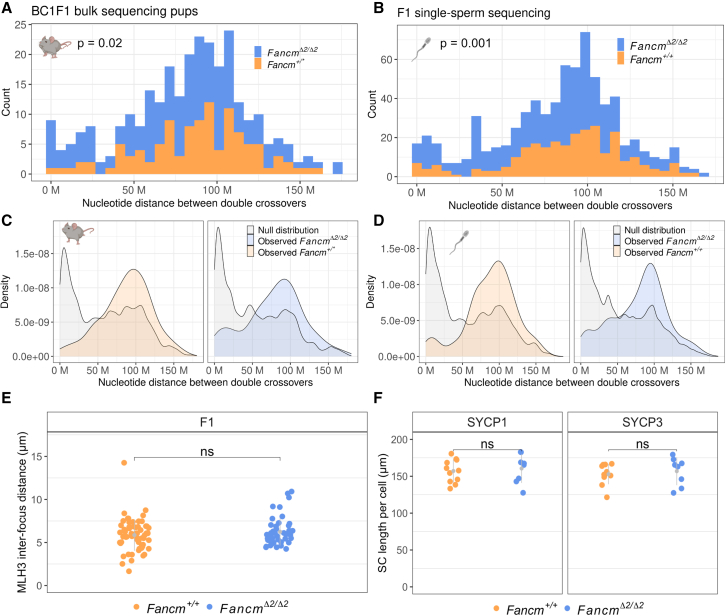
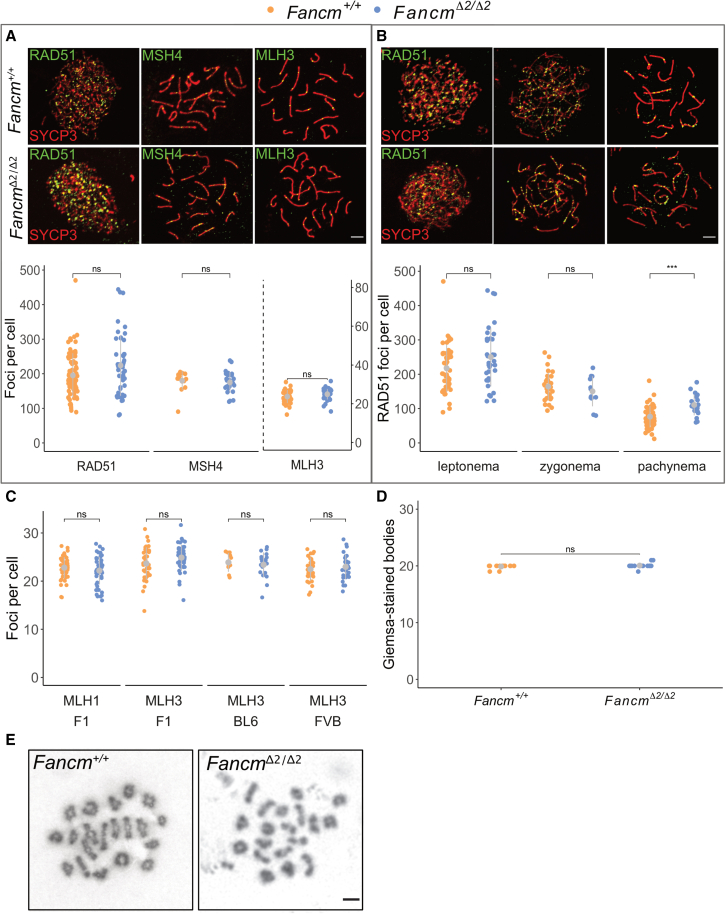
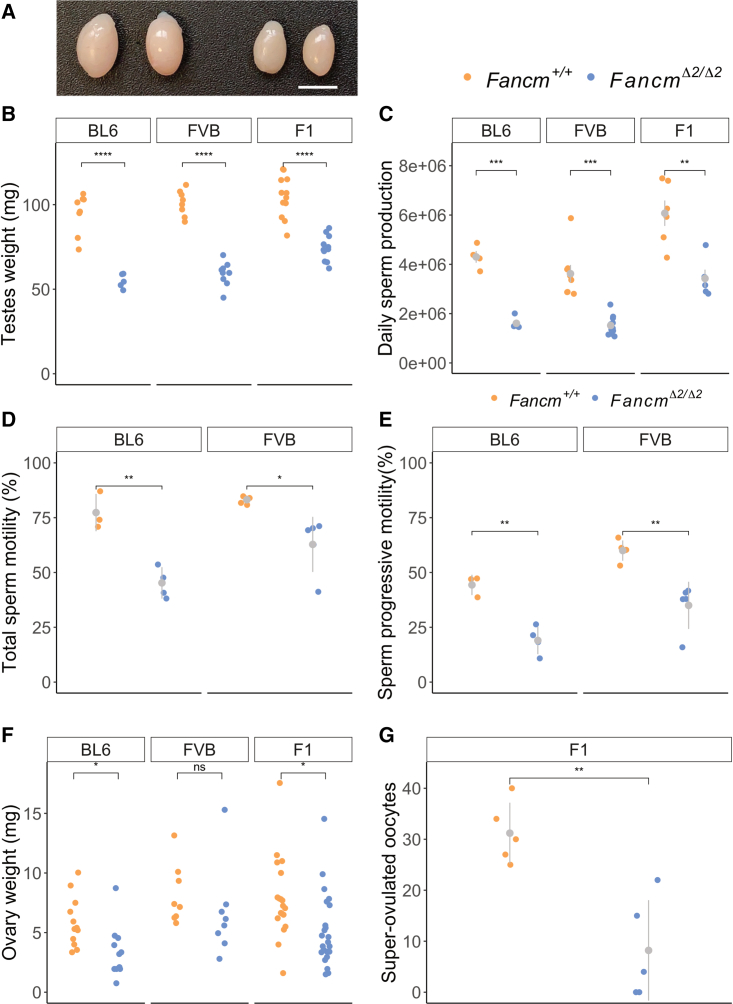
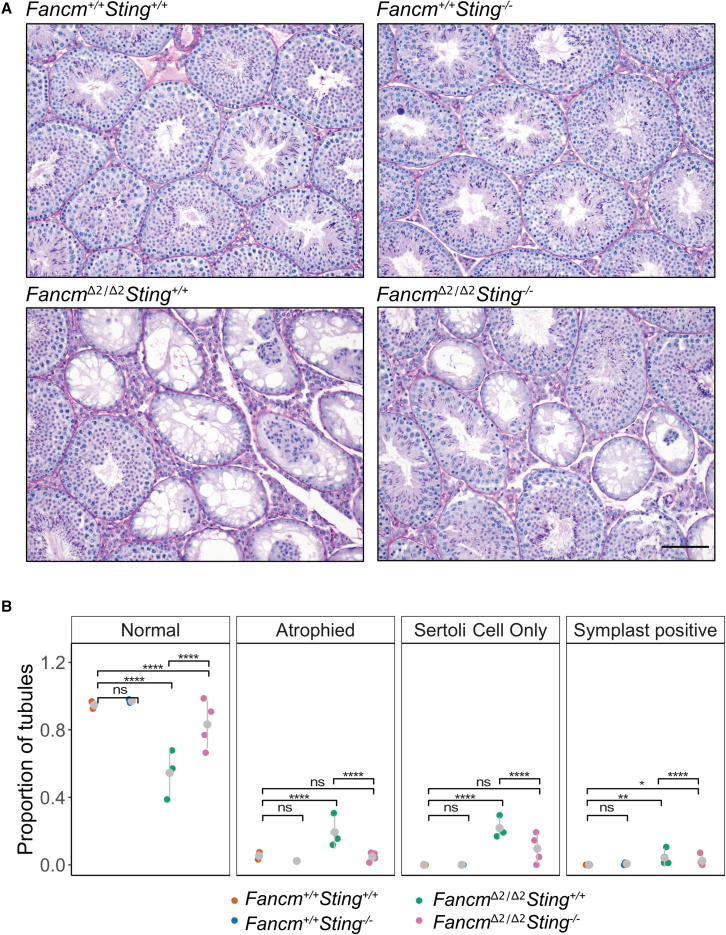
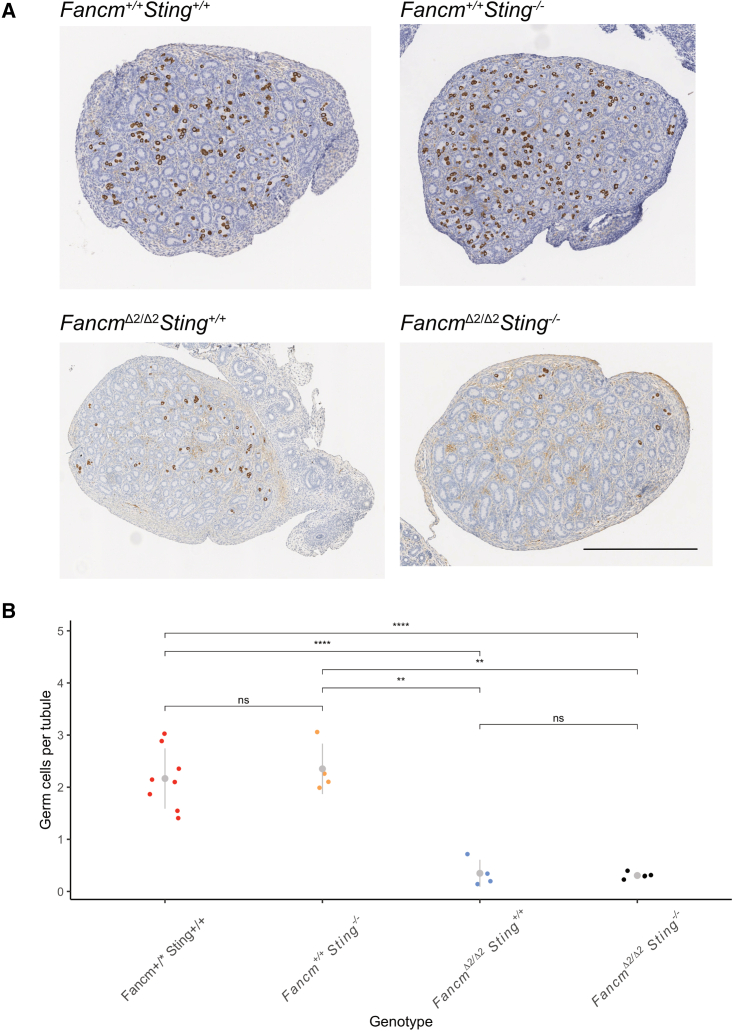
Meiotic crossovers are required for accurate chromosome segregation and producing new allelic combinations. Meiotic crossover numbers are tightly regulated within a narrow range, despite an excess of initiating DNA double-strand breaks. Here, we reveal the tumor suppressor FANCM as a meiotic anti-crossover factor in mammals. We use unique large-scale crossover analyses with both single-gamete sequencing and pedigree-based bulk-sequencing datasets to identify a genome-wide increase in crossover frequencies in Fancm-deficient mice. Gametogenesis is heavily perturbed in Fancm loss-of-function mice, which is consistent with the reproductive defects reported in humans with biallelic FANCM mutations. A portion of the gametogenesis defects can be attributed to the cGAS-STING pathway after birth. Despite the gametogenesis phenotypes in Fancm mutants, both sexes are capable of producing offspring. We propose that the anti-crossover function and role in gametogenesis of Fancm are separable and will inform diagnostic pathways for human genomic instability disorders.


Conflict of interest statement

The authors declare no competing interests.

Figures

None
Graphical abstract
Figure 1
Figure 1
Fancm limits meiotic crossovers as measured using different generations and technologies (A) Crossovers were assayed using high-throughput sequencing of individual sperm from F1 mice, bulk whole-genome DNA sequencing of BC1F1 animals, and PCR of selected SNPs. (B) Cumulative centimorgans calculated using data from three different assays: (i) F1 single-sperm sequencing (n = 3 animals per genotype; n = 218 sperm from FancmΔ2/Δ2, 190 sperm from Fancm+/+), (ii) high-throughput sequencing with BC1F1 pups (n = 98 mice from FancmΔ2/Δ2, 34 mice from Fancm+/Δ2, 40 mice from Fancm+/+), and (iii) PCR-based markers with BC1F1 pups (n = 31 FancmΔ2/Δ2, 25 Fancm+/+ independent animals per genotype). (iv) 200 BC1F1 pups sequenced to derive female genetic distances (n = 100 FancmΔ2/Δ2, 50 Fancm+/Δ2, 50 Fancm+/+ independent animals per genotype). Observed crossover fractions were used as input and converted into genetic distances in centimorgans using the Kosambi mapping function and presented as cumulative centimorgans across the genome. All three approaches demonstrate a significant increase in total genetic map length in male FancmΔ2/Δ2 mutants compared with that measured in Fancm+/+ littermates. Note: for PCR genotyping, chromosome 10 is not presented as full length due to lower marker coverage. (C and D) Four selected chromosomes, 1, 4, 8, and 11, which drove a significant portion of the increase in map length in the mutants are plotted. (C) Genetic distances were plotted in 10 Mb chromosome bins for four selected chromosomes for two assays (F1 single-sperm sequencing [top] and bulk DNA sequencing of BC1F1 pups [bottom]). No significant differences were observed in genotype groups in each bin. (D) Cumulative genetic distances per chromosome from F1 single-sperm sequencing data with permutation p values printed for each chromosome after multiple testing correction.
Figure 2
Figure 2
Extra crossovers in Fancm are consistent with the characteristics of class II crossovers Interference is detected in Fancm-deficient male mice, but extra crossovers fit with a more random distribution and are not labeled by MLH1/3. (A and B) Intercrossover distances were quantified in the wild type and the mutant from the BC1F1-derived bulk sequencing and sperm sequencing data by including only chromosomes with exactly two crossovers. Printed p values are from Wilcoxon rank-sum test. (A) n = (175 FancmΔ2/Δ2 and 109 Fancm+/∗ double crossovers per group. Fancm+/∗ indicates pooling of Fancm+/+ and Fancm+/Δ2 data, as their crossover rates were shown not to be significantly different). (B) n = (453 FancmΔ2/Δ2 and 276 Fancm+/+). (C and D) Crossover interference is observed in the wild type and the mutant, as the observed intercrossover distributions are more evenly spaced than an expected random distribution generated via permuting genotype group labels (B = 1,000). (E) Cytological measurement of interference used MLH3 interfocus distances in both the wild type and the mutant. n = 2 F1 (FVB/N × C57BL/6J) mice per genotype. Total cells analyzed: 62 F1.Fancm+/+ and 47 F1.FancmΔ2/Δ2. Gray bars indicate mean ± SD. (F) Synaptonemal complex length was assessed by measuring SYCP1 and SYCP3 length in micrometers per nucleus in pachytene spermatocytes. Total cells analyzed: 16 F1.Fancm+/+ and 22 F1.FancmΔ2/Δ2. Gray bars indicate mean ± SD.
Figure 3
Figure 3
Meiotic double-strand break repair was relatively normal in FancmΔ2/Δ2 spermatocytes (A) Representative images of F1.Fancm+/+ and F1.FancmΔ2/Δ2 spermatocyte chromosome spreads from meiotic prophase, stained for the indicated proteins (top), and quantification of foci per nucleus in wild-type and FancmΔ2/Δ2 spermatocytes. Each data point is a count from one cell. Scale bar, 5 μm. Gray bars indicate mean ± SD. F1.Fancm+/+: RAD51 foci at leptonema (217.65 ± 68.8), MSH4 foci at zygonema (164.2 ± 40.4), and MLH3 foci at pachynema (23.7 ± 3.3). F1.FancmΔ2/Δ2: RAD51 foci at leptonema (250.0 ± 85.5), MSH4 foci at zygonema (150.3 ± 43.6), and MLH3 foci at pachynema (24.9 ± 2.7). Total RAD51-labeled cells analyzed: 79 F1.Fancm+/+ and 46 F1.FancmΔ2/Δ2. Total MSH4-labeled cells analyzed: 16 F1.Fancm+/+ and 26 F1.FancmΔ2/Δ2. Total MLH3-labeled cells analyzed: 40 F1.Fancm+/+ and 47 F1.FancmΔ2/Δ2. (B) RAD51 focus numbers are higher at pachynema in FancmΔ2/Δ2. Gray bars indicate mean ± SD. Each data point indicates a count from one nucleus. F1.Fancm+/+: RAD51 foci at leptonema (217.7 ± 68.8), zygonema (164.2 ± 40.4), and pachynema (76.5). FancmΔ2/Δ2: RAD51 foci at leptonema (250.0 ± 85.5), zygonema (150.3 ± 43.6), and pachynema (110.6 ± 30.3). Scale bar, 5 μm (∗∗∗p 0.001 [unpaired t test], two F1 mice analyzed per genotype at each meiotic phase). (C) Variation in MLH3 foci in B6, FVB, and F1 backgrounds. Eighty-nine F1.Fancm+/+, 101 F1.FancmΔ2/Δ2, 10 B6.Fancm+/+, 20 B6.FancmΔ2/Δ2, 32 FVB.Fancm+/+, and 32 FVB.FancmΔ2/Δ2 cells were analyzed. Gray bars indicate mean ± SD. (D) The number of Giemsa-stained bodies per spermatocyte in Fancm+/+ and FancmΔ2/Δ2. Thirty-one Fancm+/+ and 19 FancmΔ2/Δ2 cells were analyzed. Gray bars indicate mean ± SD. (E) Representative meiotic metaphase I spreads for B6.Fancm+/+ and B6.FancmΔ2/Δ2. Scale bar, 5 μm.
Figure 4
Figure 4
Hypogonadism and gametogenesis defects in both sexes of Fancm-deficient mice (A) Testes from B6.Fancm+/+ (left) and B6.FancmΔ2/Δ2 (right) mice. Scale bar, 5 mm. (B) Six- to 14-week-old testes weights were lower in the mutants in all strains. Gray bars indicate mean ± SD. (C) Quantification of daily sperm production. Gray bars indicate mean ± SD. (D and E) Total sperm motility (D) and sperm progressive motility (E) were assessed with computer-assisted sperm analysis from 10-week-old mice. Gray bars indicate mean ± SD. (F) Ovary weights were quantified across the three strains used from 5-week or older mice. Gray bars indicate mean ± SD. (G) F1 females were superovulated and Fancm-deficient mice produced fewer oocytes. Gray bars indicate mean ± SD. Five mice per genotype; ∗p 0.05, ∗∗p 0.01, ∗∗∗p 0.001, and ∗∗∗∗p 0.0001.
Figure 5
Figure 5
Sting depletion partially rescues histological defects in the seminiferous tubules in Fancm-deficient mice (A) H&E stain of seminiferous tubules in B6.Fancm+/+ and B6.FancmΔ2/Δ2 mice. Scale bar, 100 μm. Wild-type tubules are relatively replete in their appearance. Mutant mice have a heterogeneous reduction in spermatocytes (hypospermatogenesis) at the level of individual tubules. A mixture of normal, atrophied, symplast-positive, and Sertoli cell-only tubules is observed. (B) FancmΔ2/Δ2Sting−/− testes have more full tubules than the Fancm single mutant (p-adjusted < 0.0001). Quantification of the PAS-stained seminiferous tubule cross sections. Each data point represents data from one mouse shown as a proportion for the given classification (∗p 0.05, ∗∗p 0.01, ∗∗∗∗p 0.0001 (pairwise proportion test with multiple testing correction fdr). A total of 290 Fancm+/+Sting+/+, 305 Fancm+/+Sting−/−, 479 FancmΔ2/Δ2Sting+/+, and 605 FancmΔ2/Δ2Sting−/− tubules were analyzed. Gray bars indicate mean ± SD.
Figure 6
Figure 6
Sting depletion does not rescue germ cell numbers in newborn male Fancm-deficient mice (A) Representative images of testis cross sections stained with anti-MVH. Scale bar, 500 μm. (B) Germ cells per tubule were quantified in the indicated genotypes using anti-MVH. Each data point represents average germ cells per tubule for a unique mouse. A minimum of 500 tubules were counted per mouse (∗∗p 0.01, ∗∗∗∗p 0.0001). Gray bars indicate mean ± SD.

Similar articles

Cited by

References

    1. Shimamura A., Alter B.P. Pathophysiology and management of inherited bone marrow failure syndromes. Blood Rev. 2010;24:101–122. doi: 10.1016/j.blre.2010.03.002. - DOI - PMC - PubMed
    1. Alter B.P., Giri N., Savage S.A., Rosenberg P.S. Cancer in the national cancer institute inherited bone marrow failure syndrome cohort after fifteen years of follow-up. Haematologica. 2018;103:30–39. doi: 10.3324/haematol.2017.178111. - DOI - PMC - PubMed
    1. Niraj J., Färkkilä A., D’Andrea A.D. The fanconi anemia pathway in cancer. Annu. Rev. Cell Biol. 2019;3:457–478. doi: 10.1146/annurev-cancerbio-030617-050422. - DOI - PMC - PubMed
    1. Basbous J., Constantinou A. A tumor suppressive DNA translocase named FANCM. Crit. Rev. Biochem. Mol. Biol. 2019;54:27–40. doi: 10.1080/10409238.2019.1568963. - DOI - PubMed
    1. Bakker S.T., van de Vrugt H.J., Rooimans M.A., Oostra A.B., Steltenpool J., Delzenne-Goette E., van der Wal A., van der Valk M., Joenje H., te Riele H., de Winter J.P. Fancm-deficient mice reveal unique features of Fanconi anemia complementation group M. Hum. Mol. Genet. 2009;18:3484–3495. doi: 10.1093/hmg/ddp297. - DOI - PubMed