. 2023 Aug 3:3:1211848.
doi: 10.3389/fnetp.2023.1211848. eCollection 2023.

Assessing cardiorespiratory interactions via lagged joint symbolic dynamics during spontaneous and controlled breathing

Affiliations

Assessing cardiorespiratory interactions via lagged joint symbolic dynamics during spontaneous and controlled breathing

Beatrice Cairo et al. Front Netw Physiol. .

Abstract

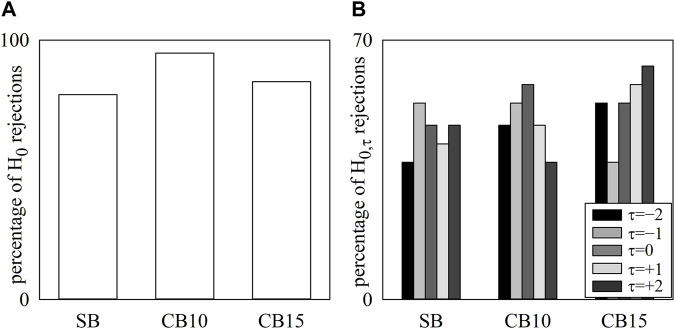
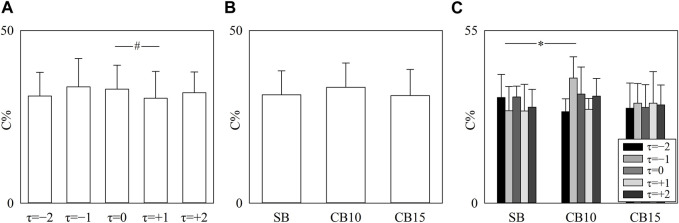
Introduction: Joint symbolic analysis (JSA) can be utilized to describe interactions between time series while accounting for time scales and nonlinear features. JSA is based on the computation of the rate of occurrence of joint patterns built after symbolization. Lagged JSA (LJSA) is obtained from the more classical JSA by introducing a delay/lead between patterns built over the two series and combined to form the joint scheme, thus monitoring coordinated patterns at different lags. Methods: In the present study, we applied LJSA for the assessment of cardiorespiratory coupling (CRC) from heart period (HP) variability and respiratory activity (R) in 19 healthy subjects (age: 27-35 years; 8 males, 11 females) during spontaneous breathing (SB) and controlled breathing (CB). The R rate of CB was selected to be indistinguishable from that of SB, namely, 15 breaths·minute-1 (CB15), or slower than SB, namely, 10 breaths·minute-1 (CB10), but in both cases, very rapid interactions between heart rate and R were known to be present. The ability of the LJSA approach to follow variations of the coupling strength was tested over a unidirectionally or bidirectionally coupled stochastic process and using surrogate data to test the null hypothesis of uncoupling. Results: We found that: i) the analysis of surrogate data proved that HP and R were significantly coupled in any experimental condition, and coupling was not more likely to occur at a specific time lag; ii) CB10 reduced CRC strength at the fastest time scales while increasing that at intermediate time scales, thus leaving the overall CRC strength unvaried; iii) despite exhibiting similar R rates and respiratory sinus arrhythmia, SB and CB15 induced different cardiorespiratory interactions; iv) no dominant temporal scheme was observed with relevant contributions of HP patterns either leading or lagging R. Discussion: LJSA is a useful methodology to explore HP-R dynamic interactions while accounting for time shifts and scales.

Keywords: autonomic nervous system; cardiac control; coupling strength; heart rate variability; nonlinear interactions; phase relationship; respiratory sinus arrhythmia.


Conflict of interest statement

The author(s) AP, BDM, FG, VB, BC declared that they were an editorial board member of Frontiers, at the time of submission. This had no impact on the peer review process and the final decision.

Figures

FIGURE 1
FIGURE 1
The vertical grouped error bar graphs show C% (A,B), 0V-0V% (C,D), 1V-1V% (E,F), 2LV-2LV% (G,H), and 2UV-2UV% (I,J) computed over simulated processes as a function of c2 . Results were obtained in the case of unidirectional interactions with c1=0 (A,C,E,G,I) and bidirectional interactions with c1=c2 (B,D,F,H,J) from 20 realizations of Y1 and Y2 . Results were reported for τ=1 (black bars) and τ=+1 (white bars). At c2=0 , Y1 and Y2 were uncoupled. The symbols § and * indicate a significant difference with p < 0.05 versus c2=0 within the same time shift, being τ=1 and τ=+1 , respectively. The symbol # indicates a significant difference with p < 0.05 between the time lags within the same value of c2 . Symbols indicating p < 0.05 were reported solely when the null hypothesis of uncoupling between Y1 and Y2 was rejected (i.e., the value of the markers was significantly above the one found at c2=0 ). Data are reported as mean plus standard deviation.
FIGURE 2
FIGURE 2
The vertical box-and-whisker plots show φHPRfR (A) and τHPRfR (B) as a function of the experimental condition (i.e., SB, CB10, and CB15). The height of the box represents the distance between the first and third quartiles, with the median marked as a horizontal segment, and the whiskers denote the 5th and 95th percentiles. The symbol * indicates p < 0.05 versus SB.
FIGURE 3
FIGURE 3
The simple bar graphs show the percentage of H0 rejections as a function of the experimental condition (i.e., SB, CB10, and CB15) (A), and the grouped bar graphs show the percentage of H0,τ rejections as a function of the experimental condition with the time lag τ coded according to the filling color of the bar from light gray to black (B). No significant differences were detected across experimental conditions and lags.
FIGURE 4
FIGURE 4
The simple error bar graphs show C% as a function of the time lag (i.e., to τ = −2, τ = −1, τ = 0, τ = +1, and τ = +2) when data are pooled regardless of the experimental condition (A) and C% as a function of the experimental condition (i.e., SB, CB10, and CB15) when data are pooled regardless of the time lag (B). The grouped error bar graphs show C% as a function of the experimental condition with τ coded according to the filling color of the bar from light gray to black (C). The symbol # indicates a significant between-time lag difference versus τ = 0 with p < 0.05. Data are reported as mean plus standard deviation.
FIGURE 5
FIGURE 5
The vertical grouped error bar graphs show 0V-0 V% (A), 1V-1V% (B), 2LV-2LV% (C), and 2UV-2UV% (D) as a function of the time lag (i.e., to τ = −2, τ = −1, τ = 0, τ = +1, and τ = +2). Data are pooled regardless of the experimental condition. The symbol # indicates a significant between-time lag difference versus τ = 0 with p < 0.05. Data are reported as mean plus standard deviation.
FIGURE 6
FIGURE 6
The vertical grouped error bar graphs show 0V-0V% (A), 1V-1V% (B), 2LV-2LV% (C), and 2UV-2UV% (D) as a function of experimental condition (i.e., SB, CB10, and CB15). Data are pooled regardless of the time lag between HP and R series. The symbol * indicates a significant between-experimental condition difference versus SB with p < 0.05. Data are reported as mean plus standard deviation.
FIGURE 7
FIGURE 7
The vertical grouped error bar graphs show 0V-0V% (A), 1V-1V% (B), 2LV-2LV% (C), and 2UV-2UV% (D) as a function of experimental condition (i.e., SB, CB10, and CB15). Data relevant to τ = −2, τ = −1, τ = 0, τ = +1, and τ = +2 are coded according to the filling color of the bar from light gray to black. The symbol * indicates a significant between-experimental condition difference versus SB with p < 0.05 within the same time shift (i.e., to τ = −2, τ = −1, τ = 0, τ = +1, or τ = +2). The symbol # indicates a significant between-time lag difference with p < 0.05 within the same experimental condition (i.e., SB, CB10, or CB15). Data are reported as mean plus standard deviation.

Similar articles

Cited by

References

    1. Abreu R. M., Cairo B., Porta A. (2023). On the significance of estimating cardiorespiratory coupling strength in sports medicine. Front. Netw. Physiol. 2, 60. 10.3389/fnetp.2022.1114733 - DOI - PMC - PubMed
    1. Abreu R. M., Catai A. M., Cairo B., Rehder-Santos P., De Maria B., Vaini E., et al. (2019). “Assessment of the coupling strength of cardiovascular control via joint symbolic analysis during postural challenge in recreational athletes,” in Proceedings of the Annual International Conference of the IEEE Engineering in Medicine and Biology Society, Berlin, Germany, 23-27 July 2019 (IEEE; ), 2011–2014. - PubMed
    1. Abreu R. M., Catai A. M., Cairo B., Rehder-Santos P., Silva C. D., Favari Signini E., et al. (2020). A transfer entropy approach for the assessment of the impact of inspiratory muscle training on the cardiorespiratory coupling of amateur cyclists. Front. Physiol. 11, 134. 10.3389/fphys.2020.00134 - DOI - PMC - PubMed
    1. Akaike H. (1974). A new look at the statistical model identification. IEEE Trans. Autom. Control 19, 716–723. 10.1109/tac.1974.1100705 - DOI
    1. Angelone A., Coulter N. A. (1964). Respiratory sinus arrhythmina: A frequency dependent phenomenon. J. Appl. Physiol. 19, 479–482. 10.1152/jappl.1964.19.3.479 - DOI - PubMed