. 2023 Jul 12;4(8):100798.
doi: 10.1016/j.patter.2023.100798. eCollection 2023 Aug 11.

Inferring CTCF-binding patterns and anchored loops across human tissues and cell types

Affiliations

Inferring CTCF-binding patterns and anchored loops across human tissues and cell types

Hang Xu et al. Patterns (N Y). .

Abstract

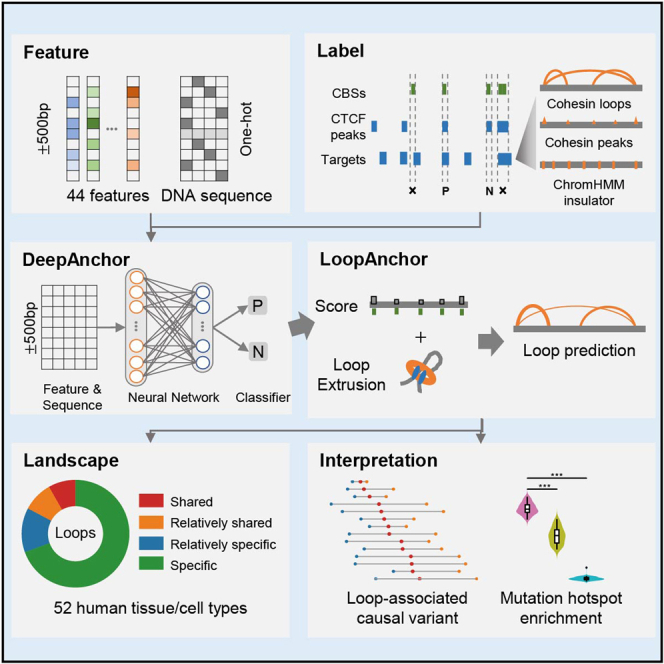
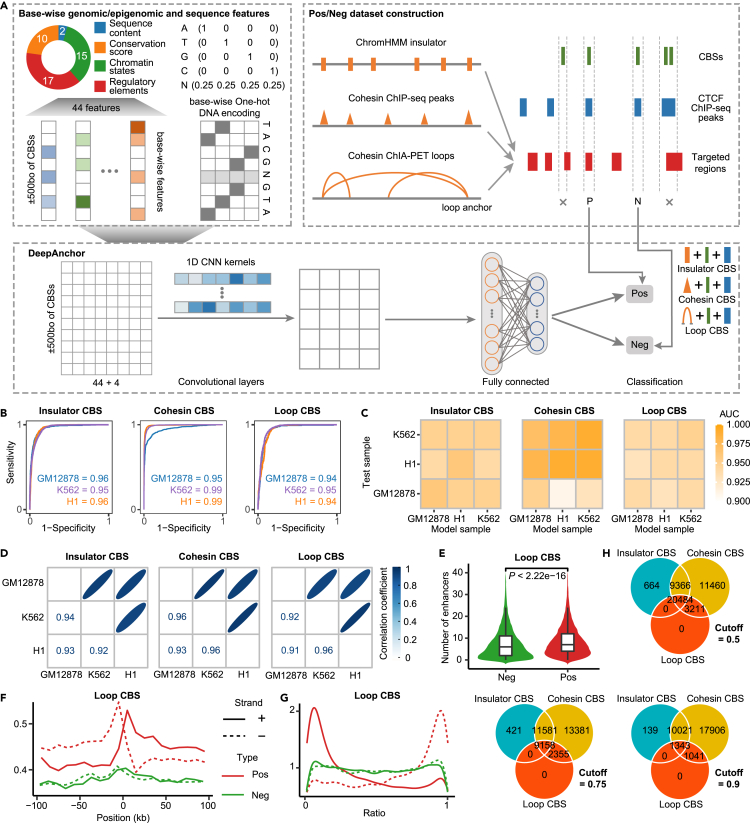
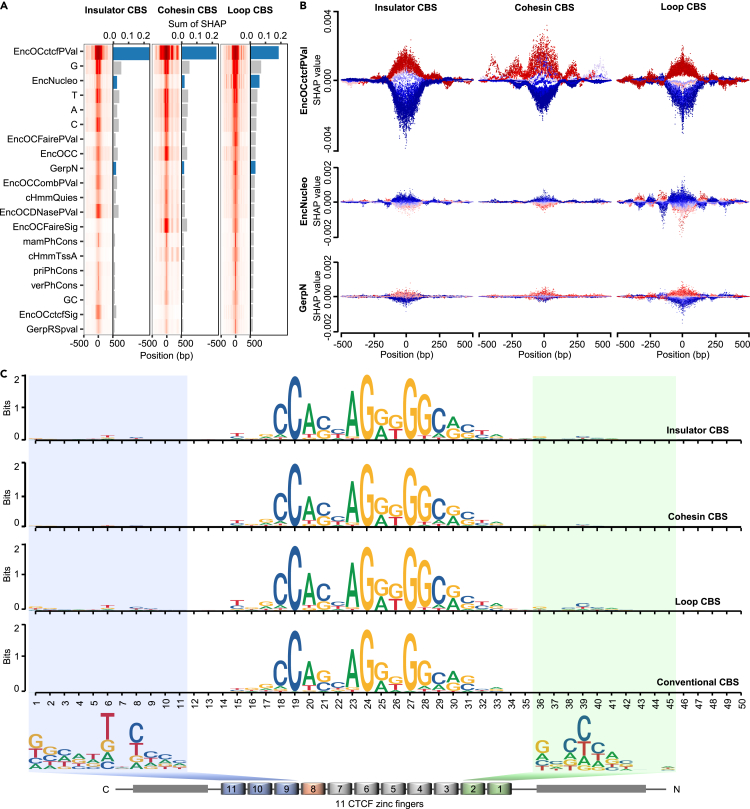
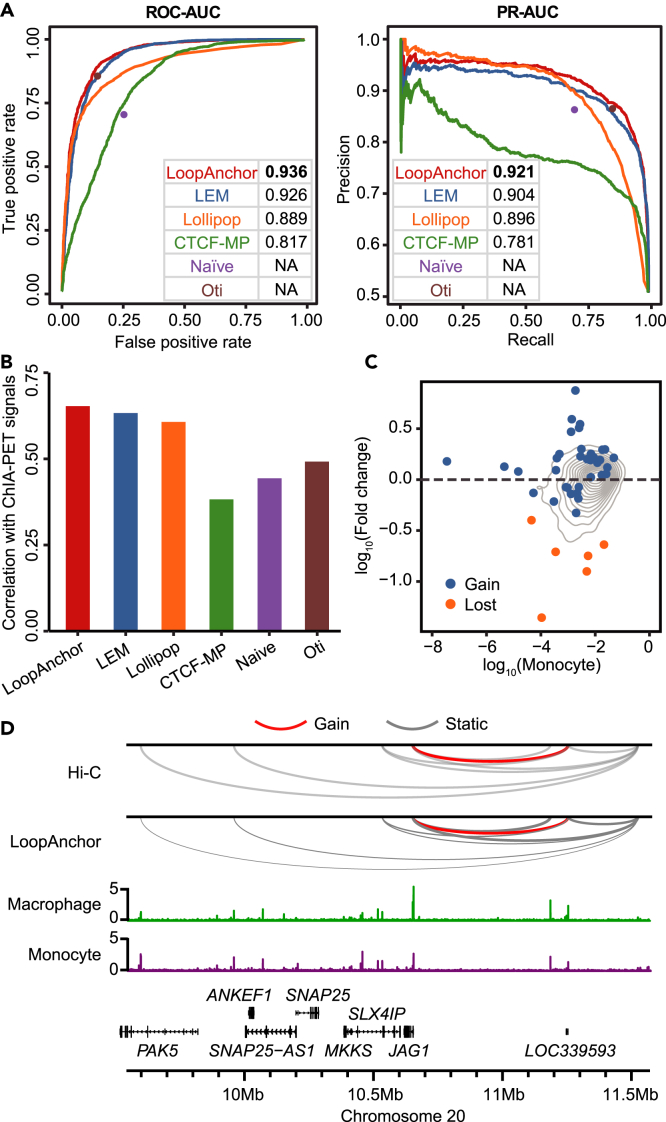
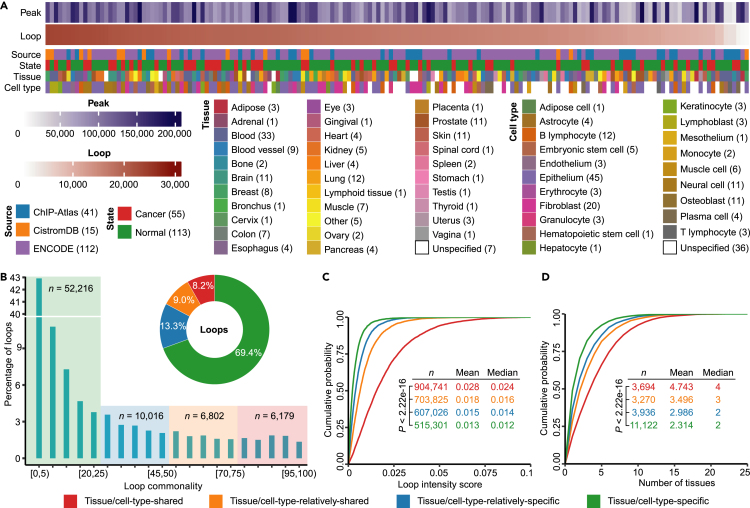
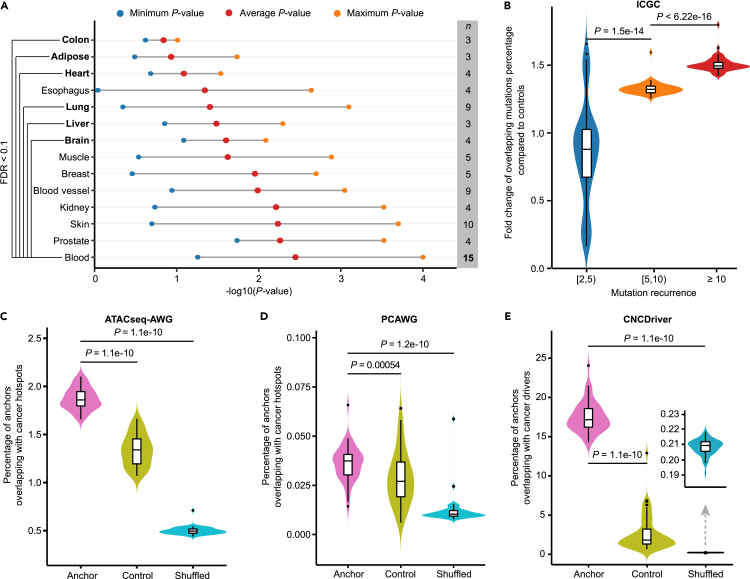
CCCTC-binding factor (CTCF) is a transcription regulator with a complex role in gene regulation. The recognition and effects of CTCF on DNA sequences, chromosome barriers, and enhancer blocking are not well understood. Existing computational tools struggle to assess the regulatory potential of CTCF-binding sites and their impact on chromatin loop formation. Here we have developed a deep-learning model, DeepAnchor, to accurately characterize CTCF binding using high-resolution genomic/epigenomic features. This has revealed distinct chromatin and sequence patterns for CTCF-mediated insulation and looping. An optimized implementation of a previous loop model based on DeepAnchor score excels in predicting CTCF-anchored loops. We have established a compendium of CTCF-anchored loops across 52 human tissue/cell types, and this suggests that genomic disruption of these loops could be a general mechanism of disease pathogenesis. These computational models and resources can help investigate how CTCF-mediated cis-regulatory elements shape context-specific gene regulation in cell development and disease progression.

Keywords: 3D genome; CTCF; CTCF-mediated loop; cis-regulatory element; deep neural networks.


Conflict of interest statement

The authors declare no competing interests.

Figures

None
Graphical abstract
Figure 1
Figure 1
Structure and performance of DeepAnchor model (A) Schematic view of DeepAnchor model. Base-wise chromatin features and DNA sequences are extracted for all candidate CBSs identified by motif scanning. Positive (Pos) and negative (Neg) datasets are constructed by considering both CTCF ChIP-seq peaks and targeted chromosome intervals, including ChromHMM insulator-associated CBS (insulator CBS), cohesin ChIP-seq signal-associated CBS (cohesin CBS), and cohesin ChIA-PET loop-associated CBS (loop CBS). A 1D-CNN model is then used to train a classifier for distinguishing positive CBSs (CTCF-mediated CREs) from other ones. The probability of CBSs being insulator/cohesin/loop-associated can be calculated and used as the DeepAnchor score for downstream analyses. Related terminologies are as follows. Insulator: an enhancer blocker or a barrier between heterochromatin and euchromatin. Chromatin loop: during the interphase of a cell, the condensed chromatin forms a 3D structure within the cell nucleus. The basic loop-like structure is called a chromatin loop. Loop anchor: given a chromatin loop detected by ChIA-PET, we call the endpoints of the loop on the chromosome a loop anchor. Insulator/cohesin/loop CBS: by using different targeted regions, we obtain different P/N datasets and train different DeepAnchor models. CBS predicted by different models will be named by a particular targeted region. (B) Cross-validation ROC curves based on GM12878, K562, and H1-hESC datasets, respectively, among three types of CBSs. (C) Cross-sample ROC curves for DeepAnchor models on different cell types among three types of CBSs. (D) Correlation between DeepAnchor scores for three cell-type-specific models among three types of CBSs. (E) Comparison of the number of enhancers around CBSs between predicted Pos and Neg CTCF-mediated CREs in loop CBS model. The Mann-Whitney U test was used to test the significance. (F) Strand-oriented asymmetric pattern of enhancer enrichment at predicted Pos and Neg CTCF-mediated CREs in loop CBS model. (G) Position and strand preference of TAD boundary enrichment by measuring the distance between each CBS and the 5′ end of TAD it belongs at predicted Pos and Neg CTCF-mediated CREs in loop CBS model. (H) The intersection of the predicted CTCF-mediated CREs among three CBS types at different thresholds. See also Figure S1 and Table S1.
Figure 2
Figure 2
Base-wise analysis of sequence and chromatin patterns across different types of CTCF binding (A) Feature importance analysis of top 20 features at a base-wise level among three types of CBSs. Heatmap: average absolute feature Shapley values of each position at ±500 bp of CBS. Bar plot: summation of absolute feature Shapley values across ±500 bp of CBS. (B) Base-wise Shapley value distribution for three representative features across different types of CBSs. EncOCctcfPval, p value (PHRED-scale) of CTCF evidence for open chromatin; EncNucleo, maximum of ENCODE nucleosome position track score; GerpN, neutral evolution score defined by GERP++. Please refer to more feature descriptions from Table S1. (C) Comparison of DNA motifs associated with positive CBSs among three types of CBSs in this study and a commonly used conventional CBS. See also Figures S2–S4.
Figure 3
Figure 3
Performance evaluation of LoopAnchor for CTCF-anchored loop prediction (A) ROC curves, precision-recall curves, and associated AUCs among LoopAnchor and five state-of-the-art methods. All supervised models, such as LoopAnchor, LEM, Lollipop, and CTCF-MP, were trained on GM12878 RAD21 ChIA-PET data and independently tested on K562 RAD21 ChIA-PET data. (B) Correlation between predicted scores and real RAD21 ChIA-PET loop intensity on K562. (C) Gained and lost loops from monocyte to macrophage differentiation by comparing LoopAnchor prediction with Hi-C observation. log10(Fold change) is the transformed fold change of predicted loop intensity for a specific loop between macrophage and monocyte; log10(Monocyte) is the transformed Hi-C loop score observed in monocyte; blue dot is lost Hi-C loop; orange dot is gained Hi-C loop. (D) Example of loops predicted by LoopAnchor at JAG1 locus. For Hi-C loops, line color is used to distinguish the gained and static loops. For LoopAnchor, line width represents the predicted loop intensity, and the loop with a fold change of intensity >3 is marked in red.
Figure 4
Figure 4
Landscape of predicted CTCF-anchored loops across 32 human tissues and 20 cell types (A) Overview of predicted CTCF-anchored loops across 168 biosamples (columns) and biological conditions (rows). (B) Classification of CTCF-anchored loops according to their shared patterns. All predicted loops were classified into four categories, namely tissue/cell-type-specific, tissue/cell-type-relatively-specific, tissue/cell-type-relatively-shared, and tissue/cell-type-shared. (C) Comparison of loop intensity score for loops in four categories. The cumulative probability was calculated, and the Kruskal-Wallis test was used to test the significance. (D) Validation of tissue distribution for loops across four categories using predicted chromatin loops based on Peakachu for 42 human tissue/cell types. The cumulative probability was calculated, and the Kruskal-Wallis test was used to test the significance. See also Figures S5 and S6; Tables S2 and S3.
Figure 5
Figure 5
Disease-causal variants and somatic hotspots enrichment (A) Enrichment significance distribution for autoimmune disease-causal variants among different normal tissues. The tissues were ordered by their average p values. The one-tailed Mann-Whitney U test (FDR < 0.1) revealed that the blood tissue was significantly more enriched than the tissues highlighted in bold. (B) Comparison of fold change distribution among different somatic mutation recurrence categories. The two-tailed Mann-Whitney U test was used to test the significance. (C–E) Comparison of overlapped percentage with somatic hotspots using different datasets from ATACseq-AWG (C), PCAWG (D), and CNCDriver (E). The paired two-tailed Mann-Whitney U test was used to test the significance. See also Table S4.

Similar articles

Cited by

References

    1. ENCODE Project Consortium An integrated encyclopedia of DNA elements in the human genome. Nature. 2012;489:57–74. doi: 10.1038/nature11247. - DOI - PMC - PubMed
    1. ENCODE Project Consortium. Moore J.E., Purcaro M.J., Pratt H.E., Epstein C.B., Shoresh N., Adrian J., Kawli T., Davis C.A., Dobin A., et al. Expanded encyclopaedias of DNA elements in the human and mouse genomes. Nature. 2020;583:699–710. doi: 10.1038/s41586-020-2493-4. - DOI - PMC - PubMed
    1. Braccioli L., de Wit E. CTCF: a Swiss-army knife for genome organization and transcription regulation. Essays Biochem. 2019;63:157–165. doi: 10.1042/EBC20180069. - DOI - PubMed
    1. Ong C.T., Corces V.G. CTCF: an architectural protein bridging genome topology and function. Nat. Rev. Genet. 2014;15:234–246. doi: 10.1038/nrg3663. - DOI - PMC - PubMed
    1. Phillips J.E., Corces V.G. CTCF: master weaver of the genome. Cell. 2009;137:1194–1211. doi: 10.1016/j.cell.2009.06.001. - DOI - PMC - PubMed

LinkOut - more resources