. 2023 Aug 3;40(8):msad185.
doi: 10.1093/molbev/msad185.

Genetic Architecture of Flowering Time Differs Between Populations With Contrasting Demographic and Selective Histories

Affiliations

Genetic Architecture of Flowering Time Differs Between Populations With Contrasting Demographic and Selective Histories

Célia Neto et al. Mol Biol Evol. .

Abstract

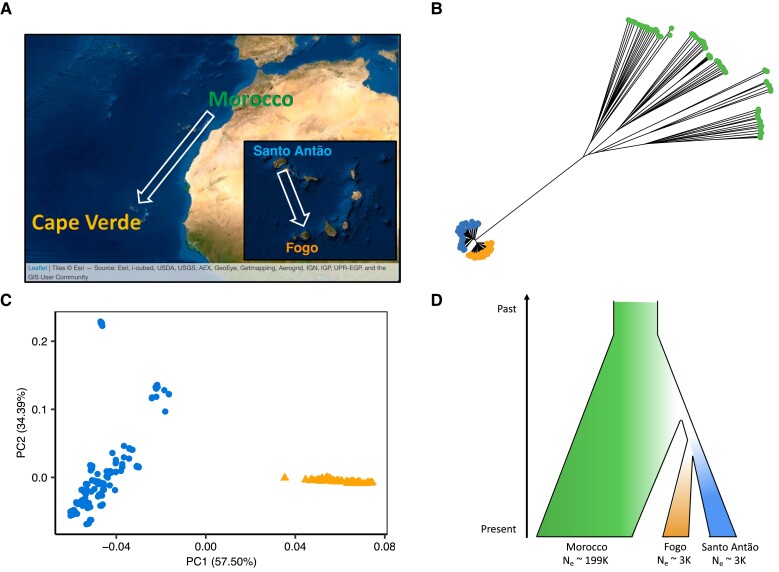
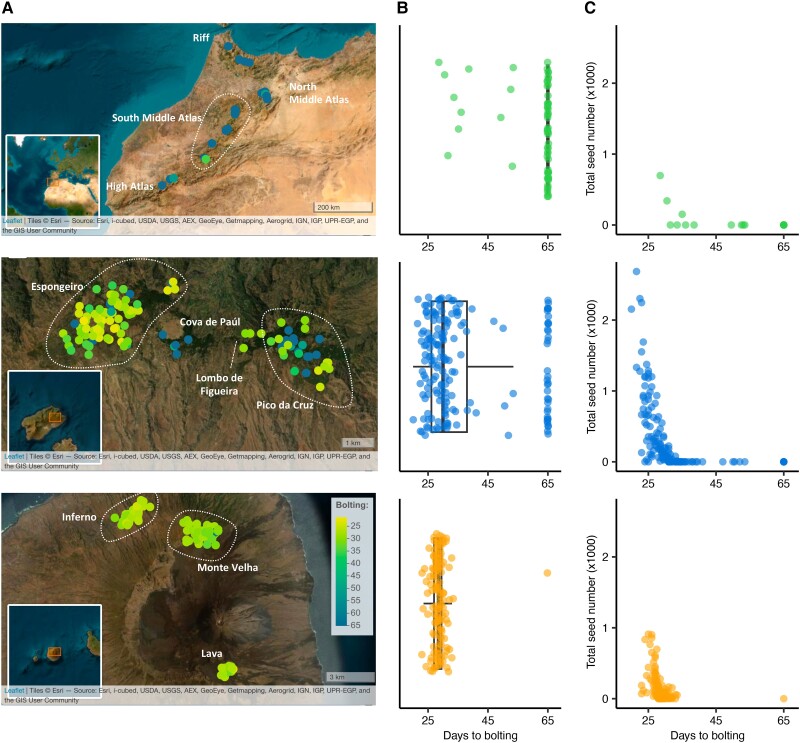
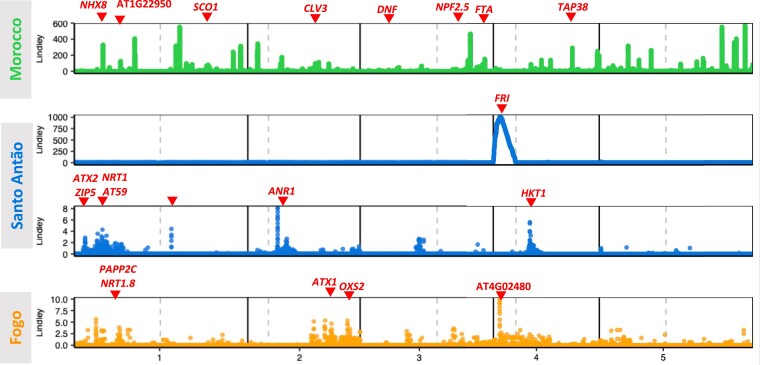
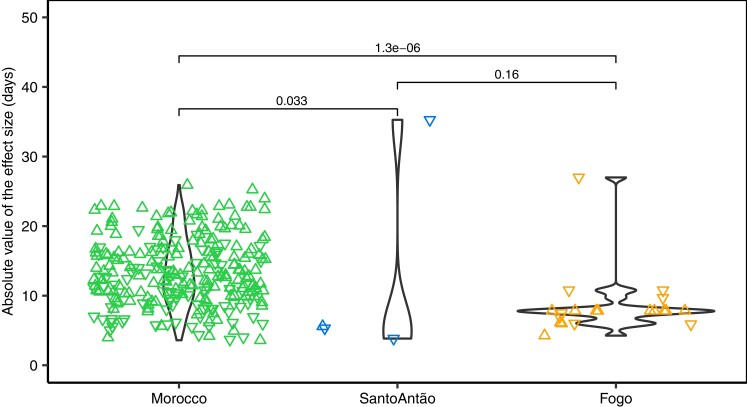
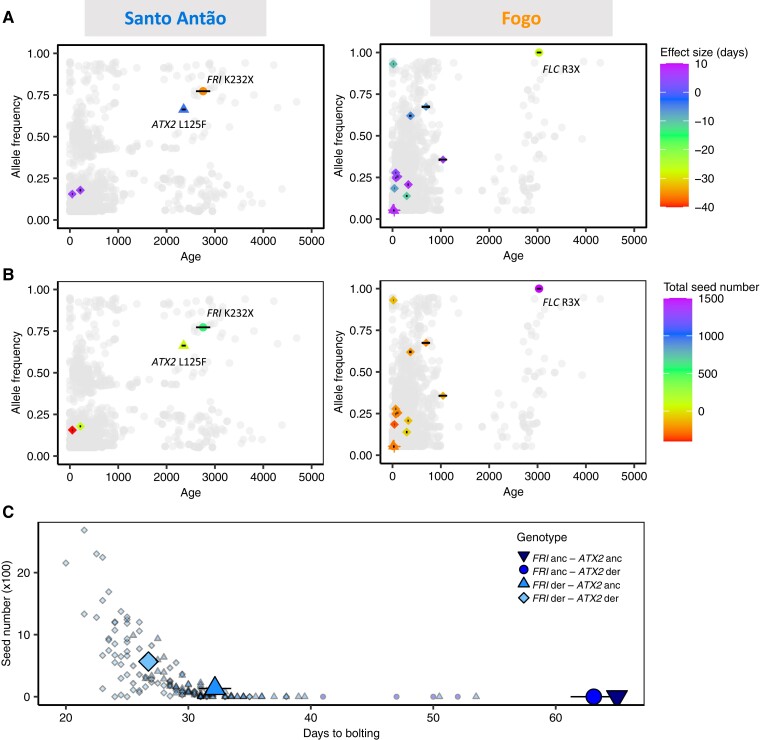
Understanding the evolutionary factors that impact the genetic architecture of traits is a central goal of evolutionary genetics. Here, we investigate how quantitative trait variation accumulated over time in populations that colonized a novel environment. We compare the genetic architecture of flowering time in Arabidopsis populations from the drought-prone Cape Verde Islands and their closest outgroup population from North Africa. We find that trait polygenicity is severely reduced in the island populations compared to the continental North African population. Further, trait architectures and reconstructed allelic histories best fit a model of strong directional selection in the islands in accord with a Fisher-Orr adaptive walk. Consistent with this, we find that large-effect variants that disrupt major flowering time genes (FRI and FLC) arose first, followed by smaller effect variants, including ATX2 L125F, which is associated with a 4-day reduction in flowering time. The most recently arising flowering time-associated loci are not known to be directly involved in flowering time, consistent with an omnigenic signature developing as the population approaches its trait optimum. Surprisingly, we find no effect in the natural population of EDI-Cvi-0 (CRY2 V367M), an allele for which an effect was previously validated by introgression into a Eurasian line. Instead, our results suggest the previously observed effect of the EDI-Cvi-0 allele on flowering time likely depends on genetic background, due to an epistatic interaction. Altogether, our results provide an empirical example of the effects demographic history and selection has on trait architecture.

Keywords: Fisher–Orr geometric model; adaptive walk‌; complex traits; directional selection; flowering time.


Figures

Fig. 1.
Fig. 1.
Geographical location and population history of CVI Arabidopsis. (A) Arabidopsis colonized Cape Verde 4–5 kya from North Africa. (B) Neighbor-joining tree showing the relationship between Moroccan and Cape Verdean individuals. (C) Principal component analysis (PCA) showing the differentiation between Santo Antão (circles) and Fogo individuals (triangles). (D) Schematic of Cape Verde Arabidopsis history.
Fig. 2.
Fig. 2.
Flowering time varies in the populations and is correlated with fitness. Results are shown from top to bottom for Moroccan, Santo Antão, and Fogo populations, respectively. (A) Spatial distribution of variation in flowering time. (B) Phenotypic distribution of flowering time per population. Each dot corresponds to the median across four replicates per line. (C) Scatter plot showing the time to first flowering versus seed production, a proxy for fitness.
Fig. 3.
Fig. 3.
GWAS for flowering time. Manhattan plots for the three populations (Morocco, Santo Antão, and Fogo) show associations with flowering time under CVI simulated conditions. The chromosome position is shown on the x-axis and the Lindley score from the local score approach is shown on the y-axis. Candidate genes are denoted by arrows. For Santo Antão, the top panel shows GWAS results with all genotyped markers and the bottom panel shows GWAS results with FRI K232X as a covariate.
Fig. 4.
Fig. 4.
Effect size distributions of flowering time-associated loci. The absolute value of the effect size in days (y-axis) per population (x-axis). Each dot represents one SNP per candidate locus identified with the local score approach and with a r2< 0.5. Triangles pointed up represent variants with an estimated positive effect size, delaying flowering, while triangles pointed down represent variants with an estimated negative effect size, reducing flowering time. Although FLC R3X is fixed in Fogo, and not identified through GWAS, it is included here for completeness. P-values shown are from MW tests.
Fig. 5.
Fig. 5.
Relationship between allele frequency and effect size for flowering time-associated variants in the three populations. Effect size in days (x-axis) for FRI 232X, FLC 3X, and each SNP tagging a candidate locus (each dot) and its respective allele frequency on the population (y-axis). A negative effect size corresponds to early flowering and a positive effect size to late flowering.
Fig. 6.
Fig. 6.
Relationship between age and allele frequency of loci implicated in flowering time and fitness in CVI. In (A and B), age estimates (in years) versus allele frequency for associated loci are shown in comparison to the genomic background. Colored SNPs represent associated variants, with colors matching their estimated effect sizes in days and seed number (A and B, respectively), and shape their predicted impacts (based on SnpEff annotation; circles are high impact, triangles moderate, diamonds are modifiers, and cross low effect variants). Each gray dot represents one SNP in an LD-pruned genome. The left panels refer to Santo Antão and the right panels to Fogo. Horizontal black lines on the associated variants represent 95% CI of estimated age. (C) Effects of allelic combinations between the two major candidates from Santo Antão, FRI, and ATX2, respectively, on time to flower (x-axis) and fitness (y-axis). Each small dot represents one line from the Santo Antão natural population, and large symbols the average per genotype category.

Similar articles

Cited by

References

    1. Ågren J, Oakley CG, Lundemo S, Schemske DW. 2017. Adaptive divergence in flowering time among natural populations of Arabidopsis thaliana: estimates of selection and QTL mapping. Evolution. 71(3):550–564. - PubMed
    1. Ågren J, Schemske DW. 2012. Reciprocal transplants demonstrate strong adaptive differentiation of the model organism Arabidopsis thaliana in its native range. New Phytol. 194(4):1112–1122. - PubMed
    1. Alcázar R, von Reth M, Bautor J, Chae E, Weigel D, Koornneef M, & Parker JE. 2014. Analysis of a plant Complex resistance gene locus underlying immune-related hybrid incompatibility and its occurrence in nature. PLoS Genet. 10(12):e1004848. - PMC - PubMed
    1. Alonso-Blanco C, El-Assal SE-D, Coupland G, Koornneef M. 1998. Analysis of natural allelic variation at flowering time loci in the landsberg erecta and Cape Verde islands ecotypes of Arabidopsis thaliana. Genetics. 149(2):749. - PMC - PubMed
    1. Alonso-Blanco C, Peeters AJM, Koornneef M, Lister C, Dean C, van den Bosch N, Pot J, Kuiper MTR. 1998. Development of an AFLP based linkage map of Ler, Col and Cvi Arabidopsis thaliana ecotypes and construction of a Ler/Cvi recombinant inbred line population: AFLP based linkage map of Arabidopsis. Plant J. 14(2):259–271. - PubMed

Publication types

Substances