Review
. 2023 Aug 18;102(33):e34604.
doi: 10.1097/MD.0000000000034604.

LAMP1/2 as potential diagnostic and prognostic marker for brain lower grade glioma: A review

Affiliations
Review

LAMP1/2 as potential diagnostic and prognostic marker for brain lower grade glioma: A review

Xiao Fen Qiu et al. Medicine (Baltimore). .

Abstract

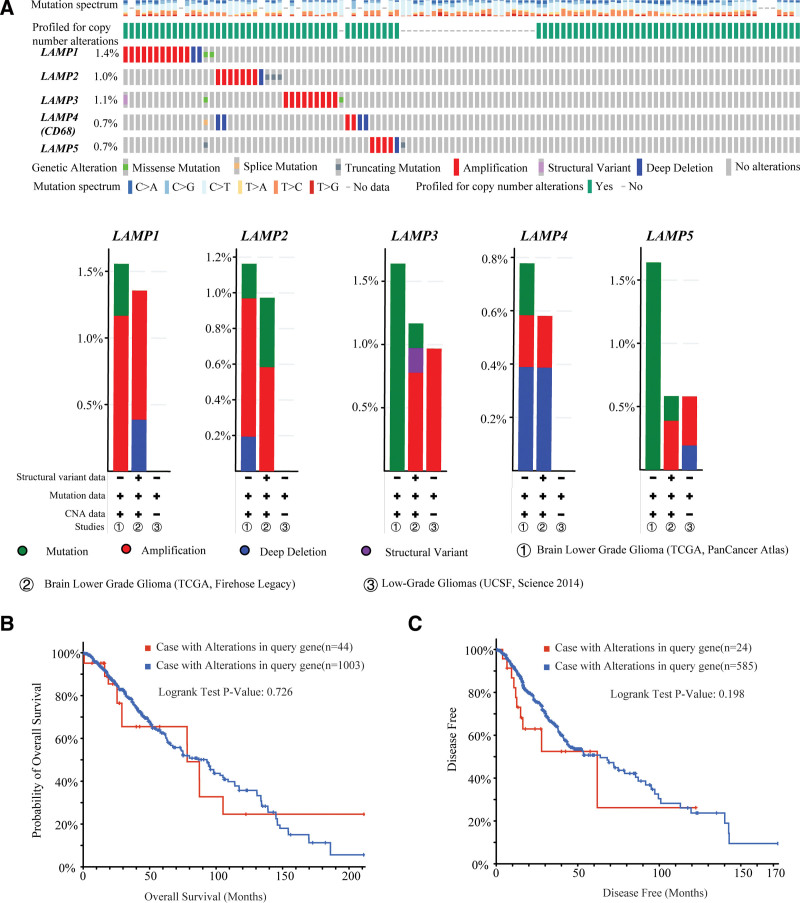
Brain lower grade glioma (LGG) is a common type of glioma. The current treatment methods still have some limitations, and some LGG patients will inevitably continue to deteriorate after treatment. We found the value of lysosomal associated membrane proteins (LAMPs) in the diagnosis and prognosis of LGG, which helps to enhance the clinical understanding of LGG treatment and improved prognosis. We assess the role of LAMPs in LGG, via the publicly available TCGA database. We explored expression levels of LAMPs in LGG using GEPIA2, cBioPortal, and UALCAN databases. The correction of LAMPs expression levels with immune cell infiltration in LGG patient was assessed by TIMER database. The Lysosomal associated membrane protein 1 (LAMP1)/2/4 mRNA levels were significantly higher in LGG patients than in healthy controls. Morover, high mRNA expressions of LAMP1/2/Lysosomal associated membrane protein 3 were associated with poor overall survival. We found that the immune invasion of LGG was almost significantly correlated with the expression of LAMPs. The results suggested that mRNA expressions of LAMP1 and LAMP4 were significantly associated with histological subtypes in LGG patients. lysosomal associated membrane protein 2 and LAMP5 were significantly down-regulated expression in samples of TP53 mutant in LGG compared to TP53 wild type. In addition, Lysosomal associated membrane protein 3 and LAMP4 were significantly overexpressed in samples of TP53 mutant in LGG Enrichment analysis applied to each component indicated that biological function was primarily associated with series of pathways in synapse and immunity.


Conflict of interest statement

The authors have no conflicts of interest to disclose.

Figures

Figure 1.
Figure 1.
Alteration frequency of LAMPs has no significant correlation with LGG prognosis (TCGA and cBioPortal). (A) OncoPrint visualization of alterations associated with LAMPs genes. (B) Overall survival percentage and survival time of LGG patients with/without gene alterations by Kaplan–Meier plots. (C) Disease free survival percentage and survival time of LGG patients with/without gene alterations by Kaplan–Meier plots, LAMPs = lysosomal associated membrane proteins, LGG = Brain lower grade glioma.
Figure 2.
Figure 2.
LAMPs mRNA levels and the prognostic value of the individual LAMPs in LGG (GEPIA2 database). (A) The distribution of LAMP1–5 gene mRNA expression between LGG and normal controls. n (tumor, T) = 518; n (normal control, N) = 207. (B) Survival map of Hazardous Ratio of LAMPs in pan cancer, the X-axis is the name of the gene, and the Y-axis is the abbreviation of the name of the cancer. In the heat map, the one selected by the square box indicates that the gene expression level has a significant correlation with the overall survival rate in the corresponding cancer. The red box indicates that the gene expression level has a lower survival rate in the corresponding cancer type. Conversely, the blue box indicates that high expression of the gene has a higher overall survival rate in the corresponding cancer type. (C) Curves show relative expression of LAMP1–5 with overall survival between LGG and normal controls using GEPIA2, n (high) = 257, n (low) = 257. P value of log-rank and hazard ratio were listed. LAMP1 = lysosomal associated membrane protein 1, LAMPs = lysosomal associated membrane proteins, LGG = Brain lower grade glioma.
Figure 3.
Figure 3.
Association of mRNA expression of different LAMPs with histological subtypes of LGG patients (UALCAN database). (A) LAMP1 expression profile based on histological subtypes (Astrocytoma vs oligoastrocytoma, P value < .001; Astrocytoma vs Oligodendroglioma, P value < .001; Oligoastrocytoma-vs Oligodendroglioma, P value < .001). (B) LAMP2 expression profile based on histological subtypes. (C) LAMP3 expression profile based on histological subtypes (Astrocytoma vs oligoastrocytoma, P value = .031; Astrocytoma vs Oligodendroglioma, P value = .005). (D) LAMP4 expression profile based on histological subtypes (Astrocytoma vs oligoastrocytoma, P value < .001; Astrocytoma vs Oligodendroglioma, P value < .001; Oligoastrocytoma-vs Oligodendroglioma, P value < .001). (E) LAMP5 expression profile based on histological subtypes (Astrocytoma vs oligoastrocytoma, P value < .001; Oligoastrocytoma-vs Oligodendroglioma, P value = .035). Difference of transcriptional expression was compared by students test and P < .05 was considered as statically significant. LAMP1 = lysosomal associated membrane protein 1, LAMP2 = lysosomal associated membrane protein 2, LAMP3 = lysosomal associated membrane protein 3, LAMPs = lysosomal associated membrane proteins, LGG = Brain lower grade glioma.
Figure 4.
Figure 4.
Correlation of LAMPs expression with immune infiltration level in LGG. (A) LAMP1 expression is significantly negatively related to tumor purity and has significant positive correlations with infiltrating levels of B cells, CD4 + T cells, Macrophages, Neutrophils, and Dendritic cells in LGG, other than CD8 + T cells. (B) LAMP2 expression is significantly negatively related to tumor purity and has significant positive correlations with infiltrating levels of B cells, CD8 + T cells, CD4 + T cells, Macrophages, Neutrophils, and Dendritic cells in LGG. (C) LAMP3 expression is significantly negatively related to tumor purity and has significant positive correlations with infiltrating levels of B cells, CD8 + T cells, CD4 + T cells, Macrophages, Neutrophils, and Dendritic cells in LGG. (D) LAMP4 expression is significantly negatively related to tumor purity and has significant positive correlations with infiltrating levels of B cells, CD8 + T cells, CD4 + T cells, Macrophages, Neutrophils, and Dendritic cells in LGG. (E) LAMP5 expression is significantly negatively related to tumor purity, B cells, CD4 + T cells, Macrophages, Neutrophils, Dendritic cells, and has significant positive correlations with infiltrating levels of CD8 + T cells in LGG. LAMP1 = lysosomal associated membrane protein 1, LAMP2 = lysosomal associated membrane protein 2, LAMP3 = lysosomal associated membrane protein 3, LAMPs = lysosomal associated membrane proteins, LGG = Brain lower grade glioma.
Figure 5.
Figure 5.
Expression profiles of LAMPs in TP53 mutant and wild type cases in LGG. (A) Heatmap shows the log2 fold changes of the differential expression of each gene for each cancer type, red squares represent high expression of LAMPs in LGG of TP53 mutant and blue squares represent low expression of LAMPs in the LGG of TP53 mutant. (B–E) Expression profiles of LAMP1-5 in TP53 mutant and wild type cases in LGG, P values are marked in red when P value < .05. LAMP1 = lysosomal associated membrane protein 1, LAMPs = lysosomal associated membrane proteins, LGG = Brain lower grade glioma.
Figure 6.
Figure 6.
The genome-wide correlation between LAMPs family members and other signatures in LGG from the TCGA database. LAMPs = lysosomal associated membrane proteins, LGG = Brain lower grade glioma.
Figure 7.
Figure 7.
Enrichment analysis with LAMP1\2\3 association gene in LGG. (A) Colored by cluster ID, where nodes that share the same cluster ID are typically close to each other. (B) MCODE components identified in the gene lists (For each given gene list, protein-protein interaction enrichment analysis has been carried out with the following databases: STRING, BioGrid7 OmniPath, InWeb_IM. LAMP1 = lysosomal associated membrane protein 1, LGG = Brain lower grade glioma.

References

    1. Gusyatiner O, Hegi ME. Glioma epigenetics: from subclassification to novel treatment options. Semin Cancer Biol. 2018;51:50–8. - PubMed
    1. Ostrom QT, Gittleman H, Farah P, et al. . CBTRUS statistical report: primary brain and central nervous system tumors diagnosed in the United States in 2006-2010. Neuro Oncol. 2013;15(Suppl 2):ii1–56. - PMC - PubMed
    1. Wijnenga MMJ, French PJ, Dubbink HJ, et al. . The impact of surgery in molecularly defined low-grade glioma: an integrated clinical, radiological, and molecular analysis. Neuro Oncol. 2018;20:103–12. - PMC - PubMed
    1. Jiang B, Chaichana K, Veeravagu A, et al. . Biopsy versus resection for the management of low-grade gliomas. Cochrane Database Syst Rev. 2017;4:CD009319. - PMC - PubMed
    1. Louis DN, Ohgaki H, Wiestler OD, et al. . The 2007 WHO classification of tumours of the central nervous system. Acta Neuropathol. 2007;114:97–109. - PMC - PubMed

Substances