

The spread of interferon-γ in melanomas is highly spatially confined, driving nongenetic variability in tumor cells
- PMID: 37603742
- PMCID: PMC10468618
- DOI: 10.1073/pnas.2304190120
The spread of interferon-γ in melanomas is highly spatially confined, driving nongenetic variability in tumor cells
Abstract
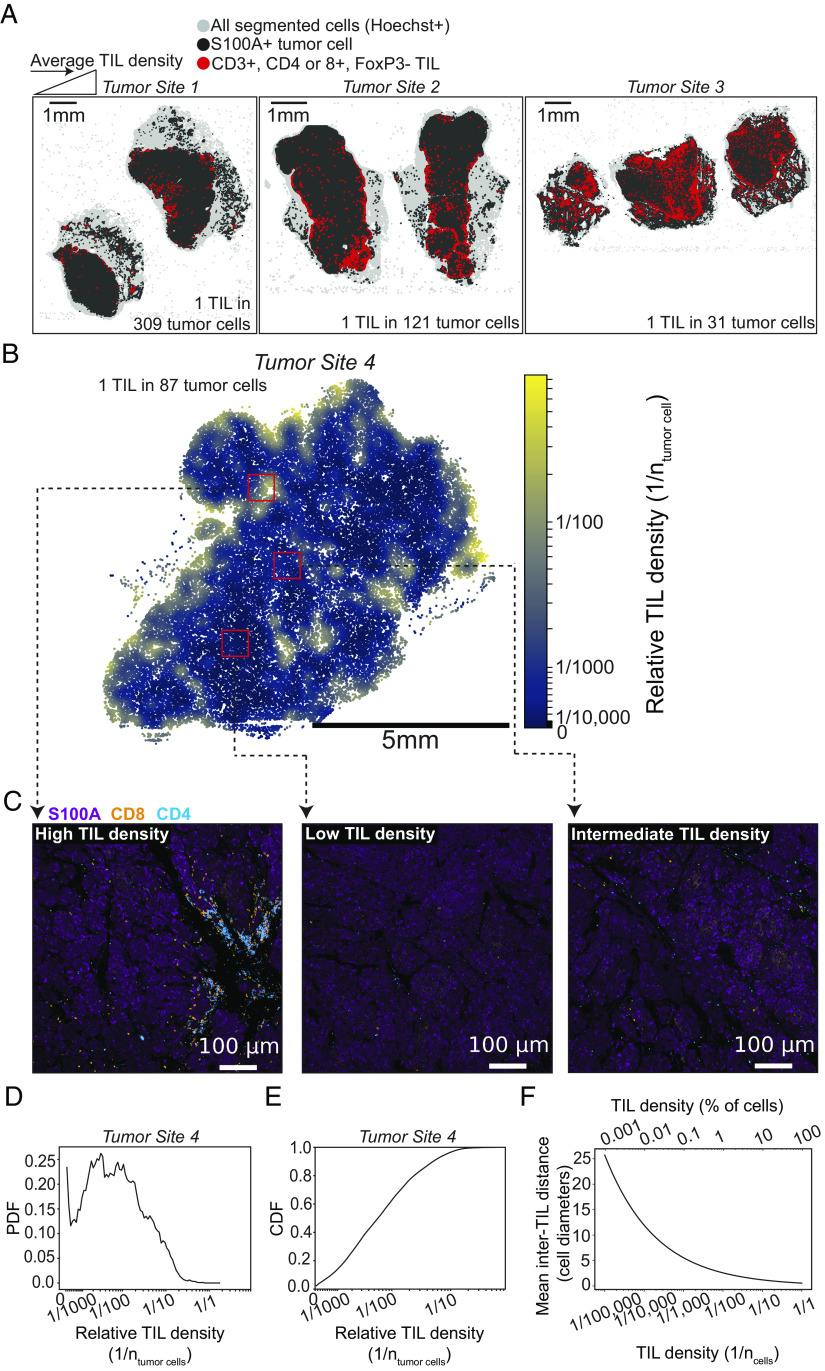
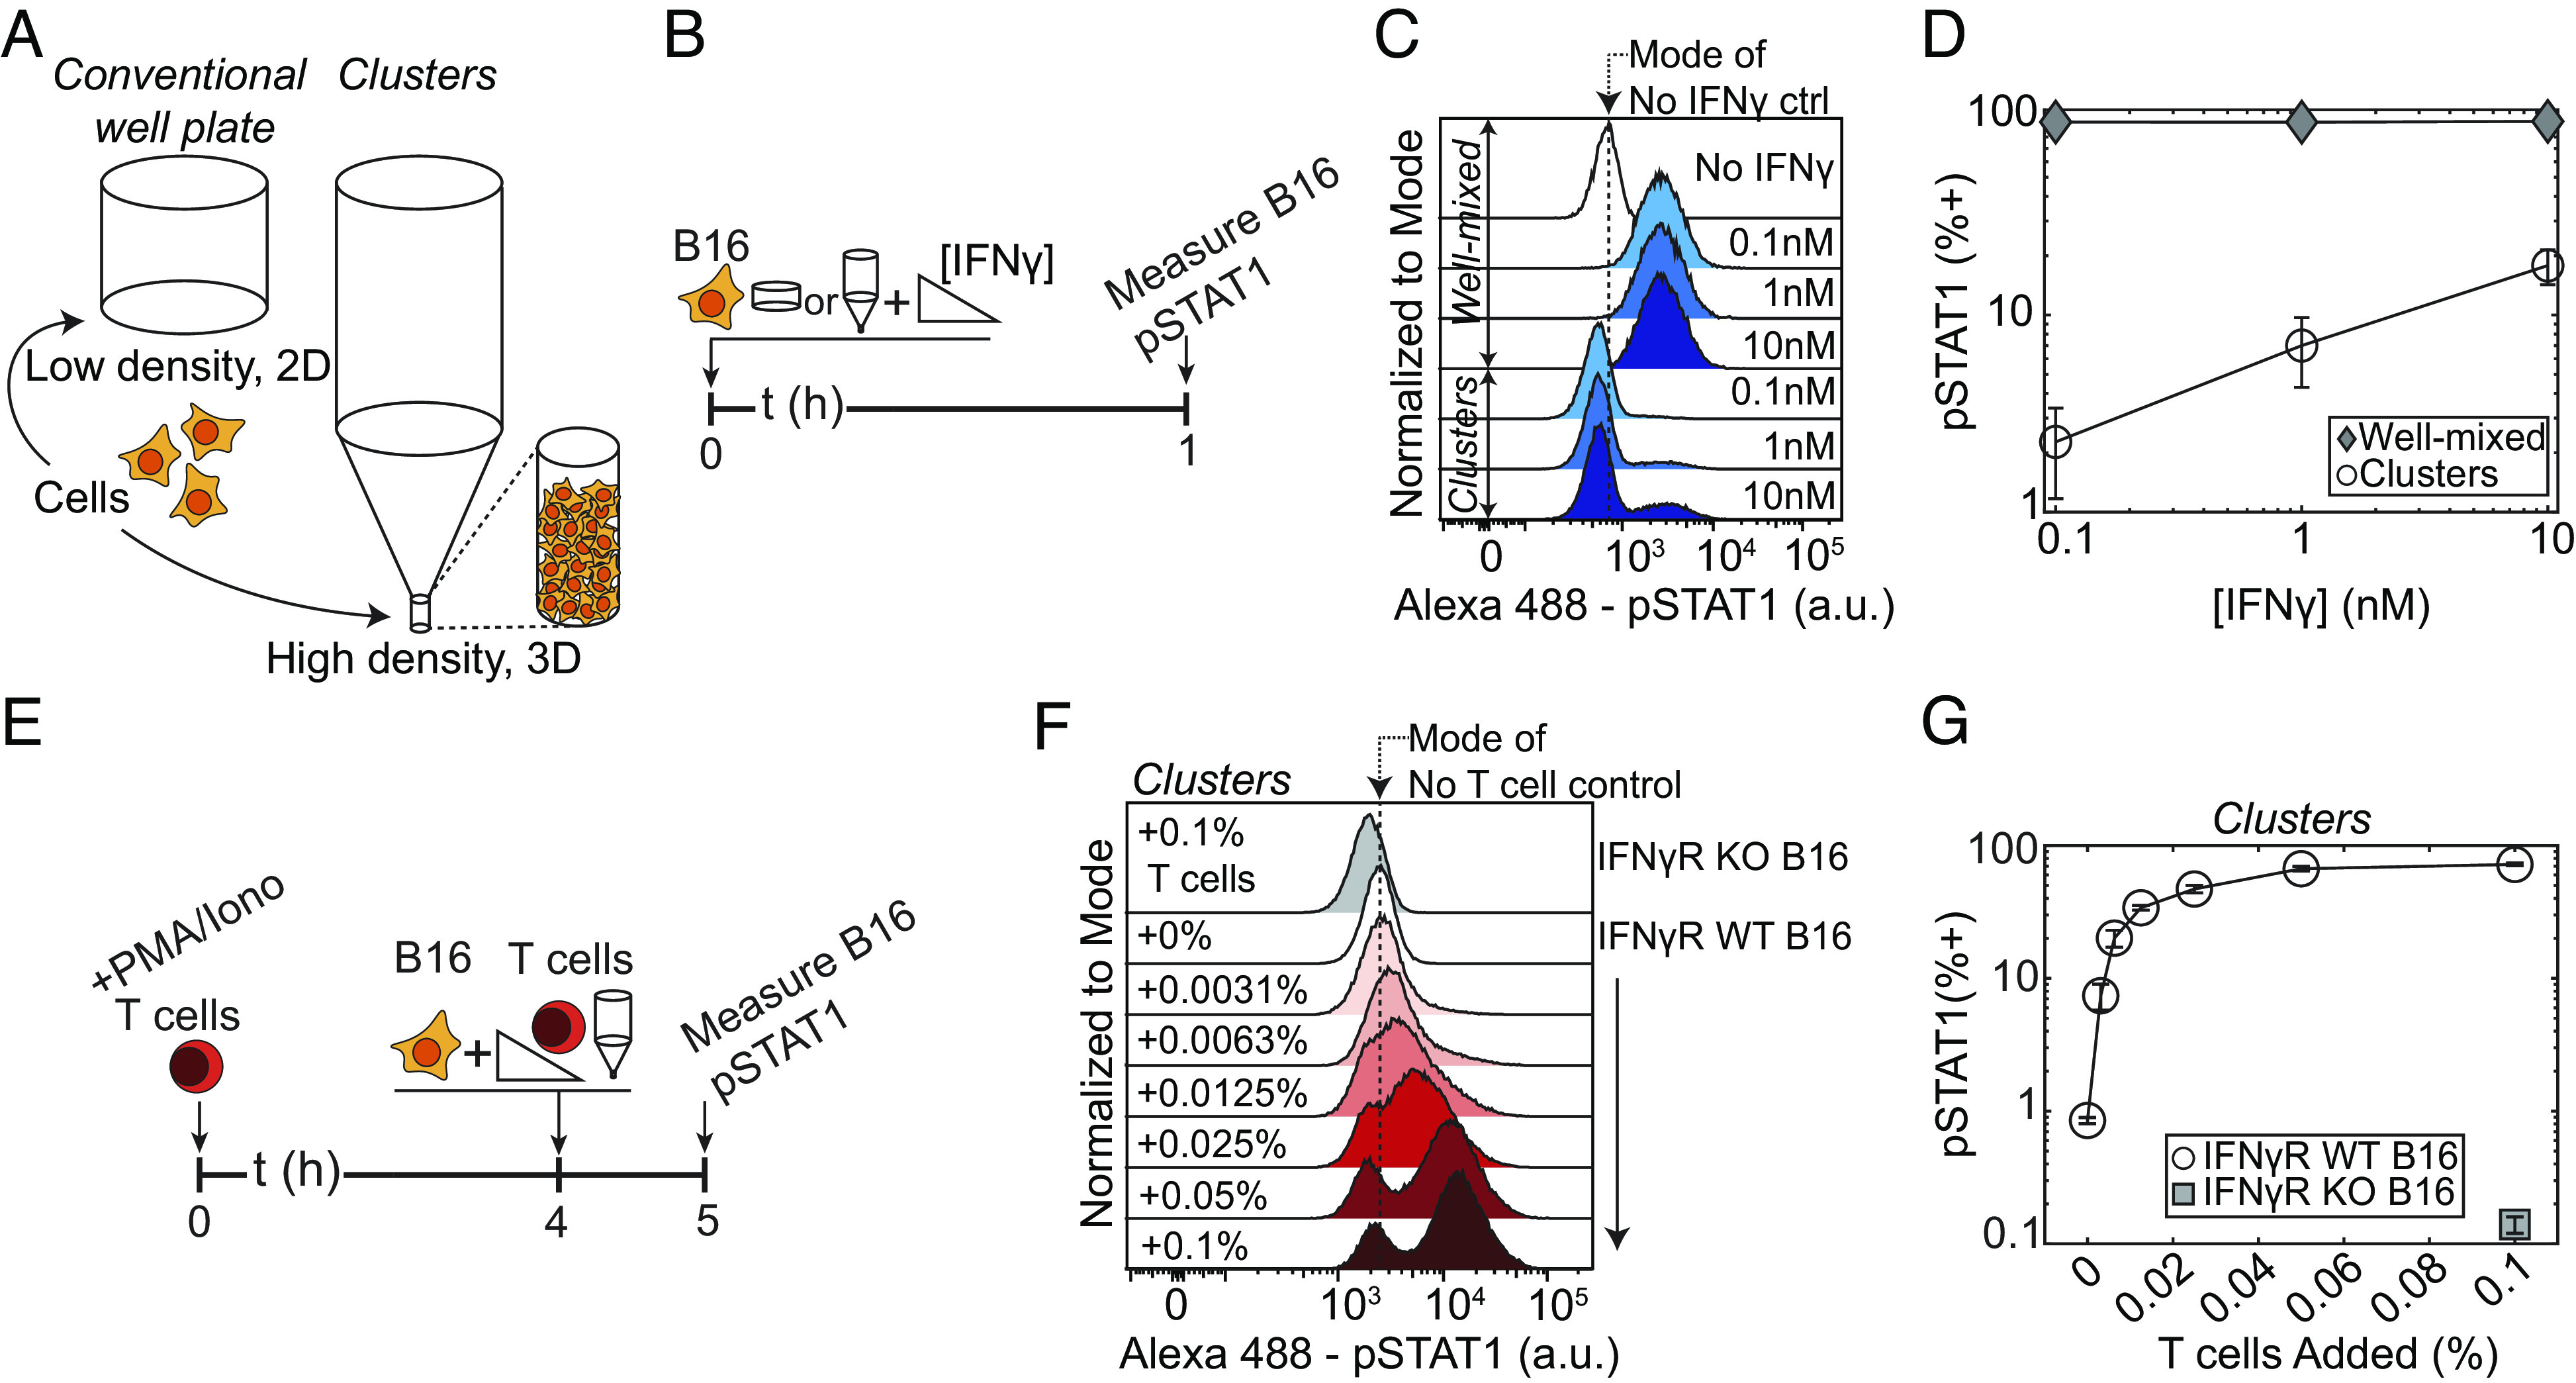
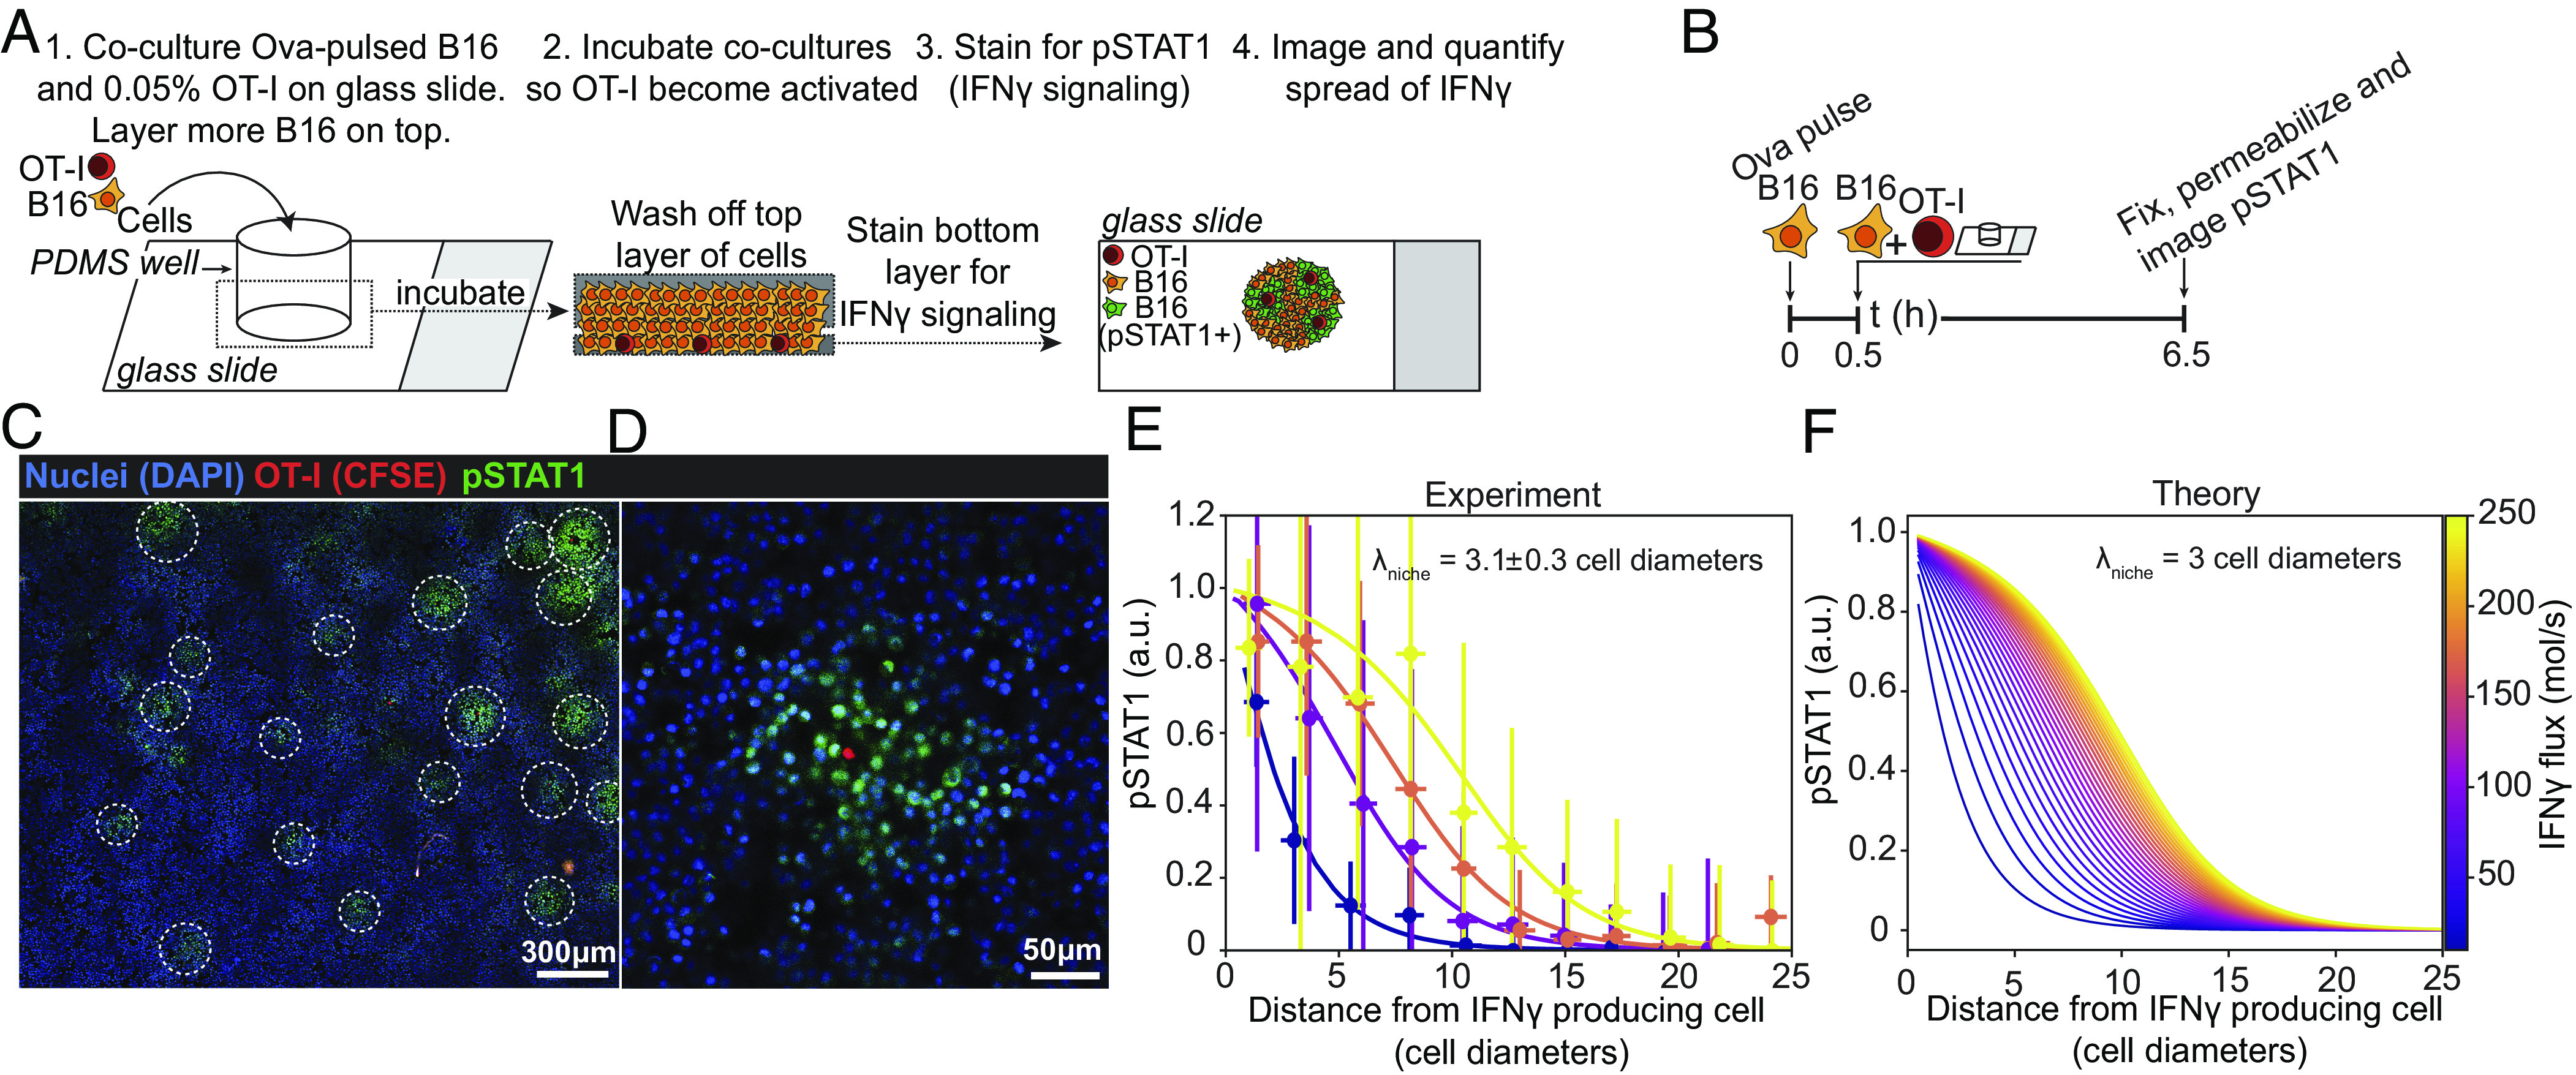
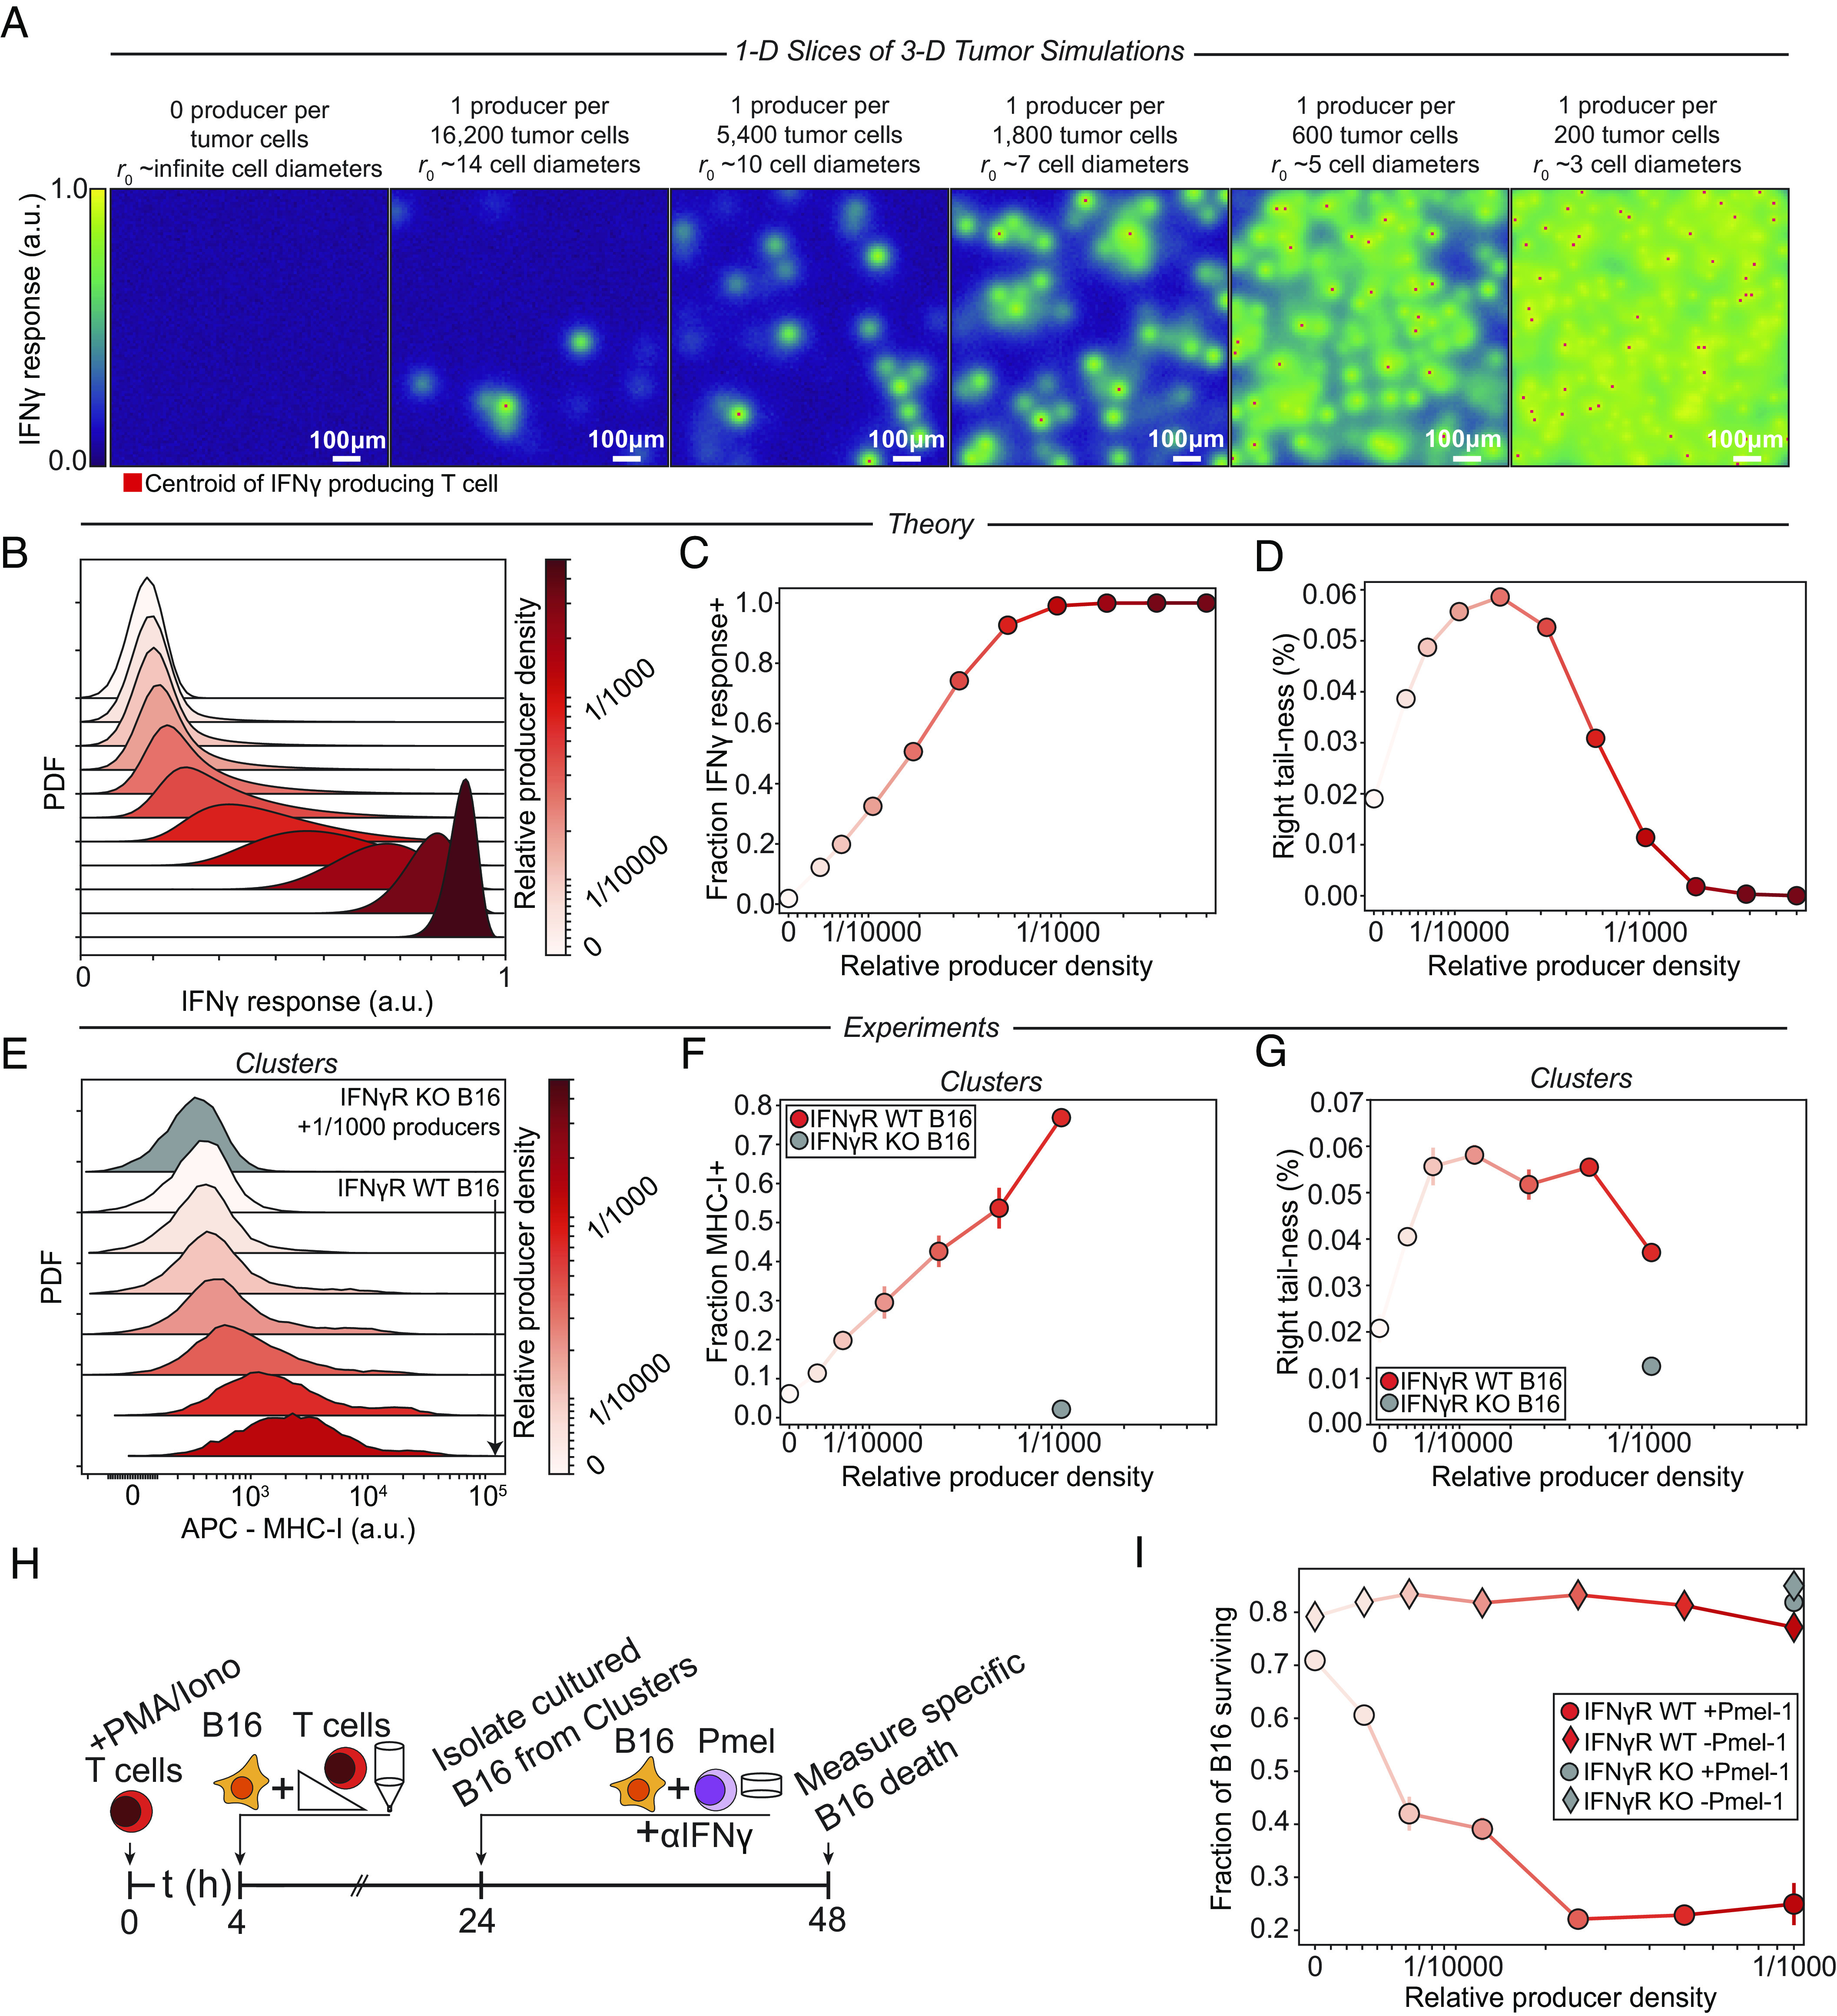
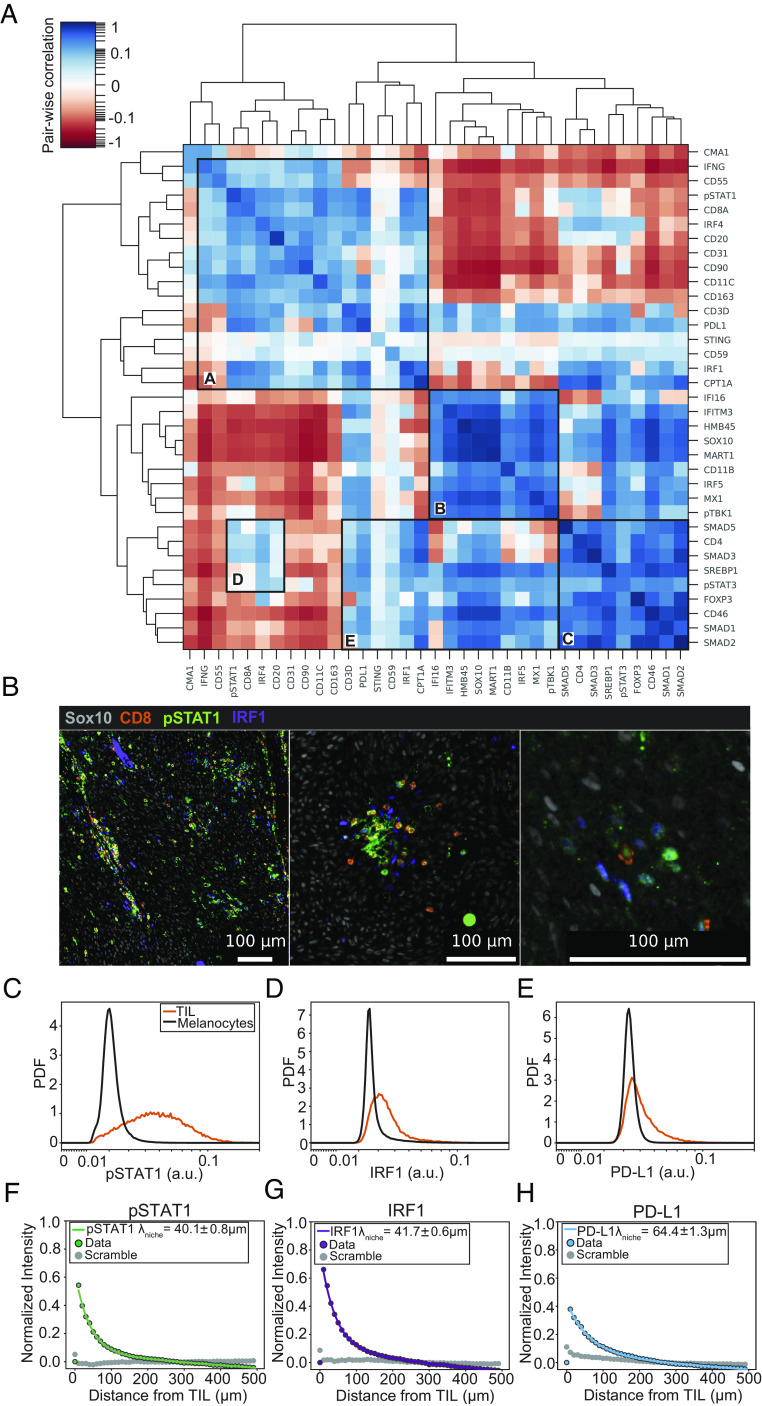
Interferon-γ (IFNγ) is a critical antitumor cytokine that has varied effects on different cell types. The global effect of IFNγ in the tumor depends on which cells it acts upon and the spatial extent of its spread. Reported measurements of IFNγ spread vary dramatically in different contexts, ranging from nearest-neighbor signaling to perfusion throughout the entire tumor. Here, we apply theoretical considerations to experiments both in vitro and in vivo to study the spread of IFNγ in melanomas. We observe spatially confined niches of IFNγ signaling in 3-D mouse melanoma cultures and human tumors that generate cellular heterogeneity in gene expression and alter the susceptibility of affected cells to T cell killing. Widespread IFNγ signaling only occurs when niches overlap due to high local densities of IFNγ-producing T cells. We measured length scales of ~30 to 40 μm for IFNγ spread in B16 mouse melanoma cultures and human primary cutaneous melanoma. Our results are consistent with IFNγ spread being governed by a simple diffusion-consumption model and offer insight into how the spatial organization of T cells contributes to intratumor heterogeneity in inflammatory signaling, gene expression, and immune-mediated clearance. Solid tumors are often viewed as collections of diverse cellular "neighborhoods": Our work provides a general explanation for such nongenetic cellular variability due to confinement in the spread of immune mediators.
Keywords: cytokine signaling; interferon-γ; melanoma; quantitative biology; tumor-infiltrating lymphocytes.
Conflict of interest statement
The authors declare no competing interest.
Figures
Similar articles
-
Catch and Release of Cytokines Mediated by Tumor Phosphatidylserine Converts Transient Exposure into Long-Lived Inflammation.Mol Cell. 2017 Jun 1;66(5):635-647.e7. doi: 10.1016/j.molcel.2017.05.011. Mol Cell. 2017. PMID: 28575659 Free PMC article.
-
USP18 is crucial for IFN-γ-mediated inhibition of B16 melanoma tumorigenesis and antitumor immunity.Mol Cancer. 2014 May 31;13:132. doi: 10.1186/1476-4598-13-132. Mol Cancer. 2014. PMID: 24884733 Free PMC article.
-
Immune-based antitumor effects of BRAF inhibitors rely on signaling by CD40L and IFNγ.Cancer Res. 2014 Jun 15;74(12):3205-17. doi: 10.1158/0008-5472.CAN-13-3461. Epub 2014 Apr 15. Cancer Res. 2014. PMID: 24736544 Free PMC article.
-
Topical treatment of all-trans retinoic acid inhibits murine melanoma partly by promoting CD8+ T-cell immunity.Immunology. 2017 Oct;152(2):287-297. doi: 10.1111/imm.12768. Epub 2017 Jun 29. Immunology. 2017. PMID: 28556970 Free PMC article.
-
Development of an IFNγ response-related signature for predicting the survival of cutaneous melanoma.Cancer Med. 2020 Nov;9(21):8186-8201. doi: 10.1002/cam4.3438. Epub 2020 Sep 9. Cancer Med. 2020. PMID: 32902917 Free PMC article.
Cited by
-
Linking signal input, cell state, and spatial context to inflammatory responses.Curr Opin Immunol. 2024 Dec;91:102462. doi: 10.1016/j.coi.2024.102462. Epub 2024 Sep 11. Curr Opin Immunol. 2024. PMID: 39265520 Free PMC article. Review.
-
SpatialCells: automated profiling of tumor microenvironments with spatially resolved multiplexed single-cell data.Brief Bioinform. 2024 Mar 27;25(3):bbae189. doi: 10.1093/bib/bbae189. Brief Bioinform. 2024. PMID: 38701421 Free PMC article.
-
Ex vivo model of functioning human lymph node reveals role for innate lymphocytes and stroma in response to vaccine adjuvant.Cell Rep. 2025 Jul 22;44(7):115938. doi: 10.1016/j.celrep.2025.115938. Epub 2025 Jul 2. Cell Rep. 2025. PMID: 40608517 Free PMC article.
-
Antigenic cancer persister cells survive direct T cell attack.bioRxiv [Preprint]. 2025 Mar 17:2025.03.14.643359. doi: 10.1101/2025.03.14.643359. bioRxiv. 2025. PMID: 40166148 Free PMC article. Preprint.
-
Dual role of interferon-gamma in the response of melanoma patients to immunotherapy with immune checkpoint inhibitors.Mol Cancer. 2025 Mar 20;24(1):89. doi: 10.1186/s12943-025-02294-x. Mol Cancer. 2025. PMID: 40108693 Free PMC article. Review.
References
-
- Nastala C. L., et al. , Recombinant IL-12 administration induces tumor regression in association with IFN-gamma production. J. Immunol. 153, 1697–1706 (1994). - PubMed
-
- Briesemeister D., et al. , Tumor rejection by local interferon gamma induction in established tumors is associated with blood vessel destruction and necrosis. Int. J. Cancer 128, 371–378 (2011). - PubMed
MeSH terms
Substances
LinkOut - more resources
Full Text Sources
Other Literature Sources
Medical
