. 2023 Aug 29;120(35):e2206612120.
doi: 10.1073/pnas.2206612120. Epub 2023 Aug 21.

Modeling islet enhancers using deep learning identifies candidate causal variants at loci associated with T2D and glycemic traits

Affiliations

Modeling islet enhancers using deep learning identifies candidate causal variants at loci associated with T2D and glycemic traits

Sanjarbek Hudaiberdiev et al. Proc Natl Acad Sci U S A. .

Abstract

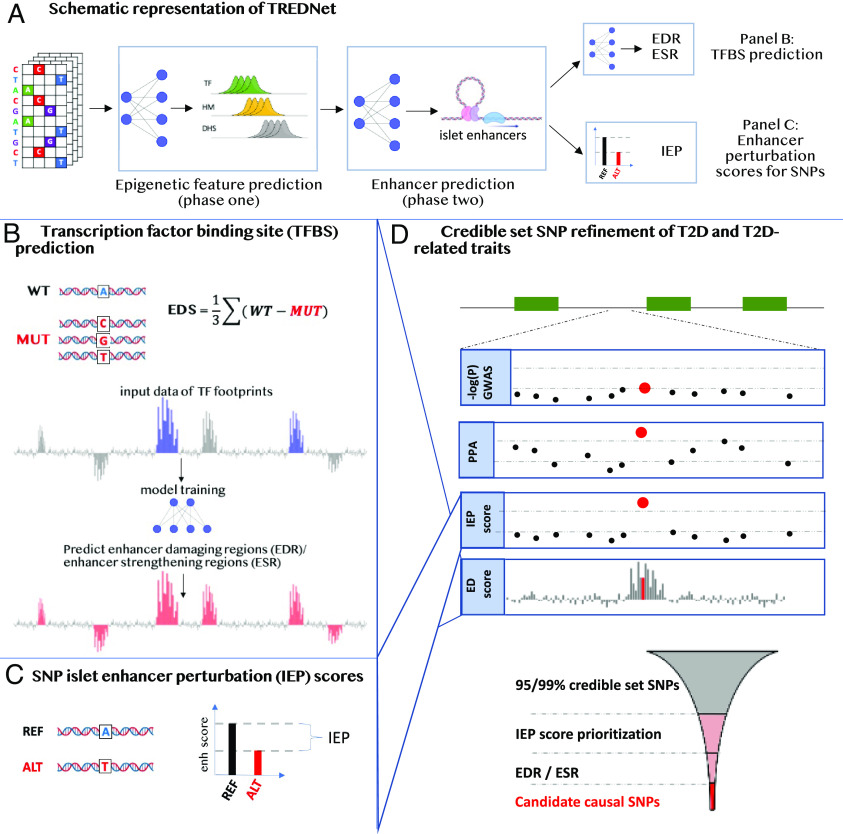
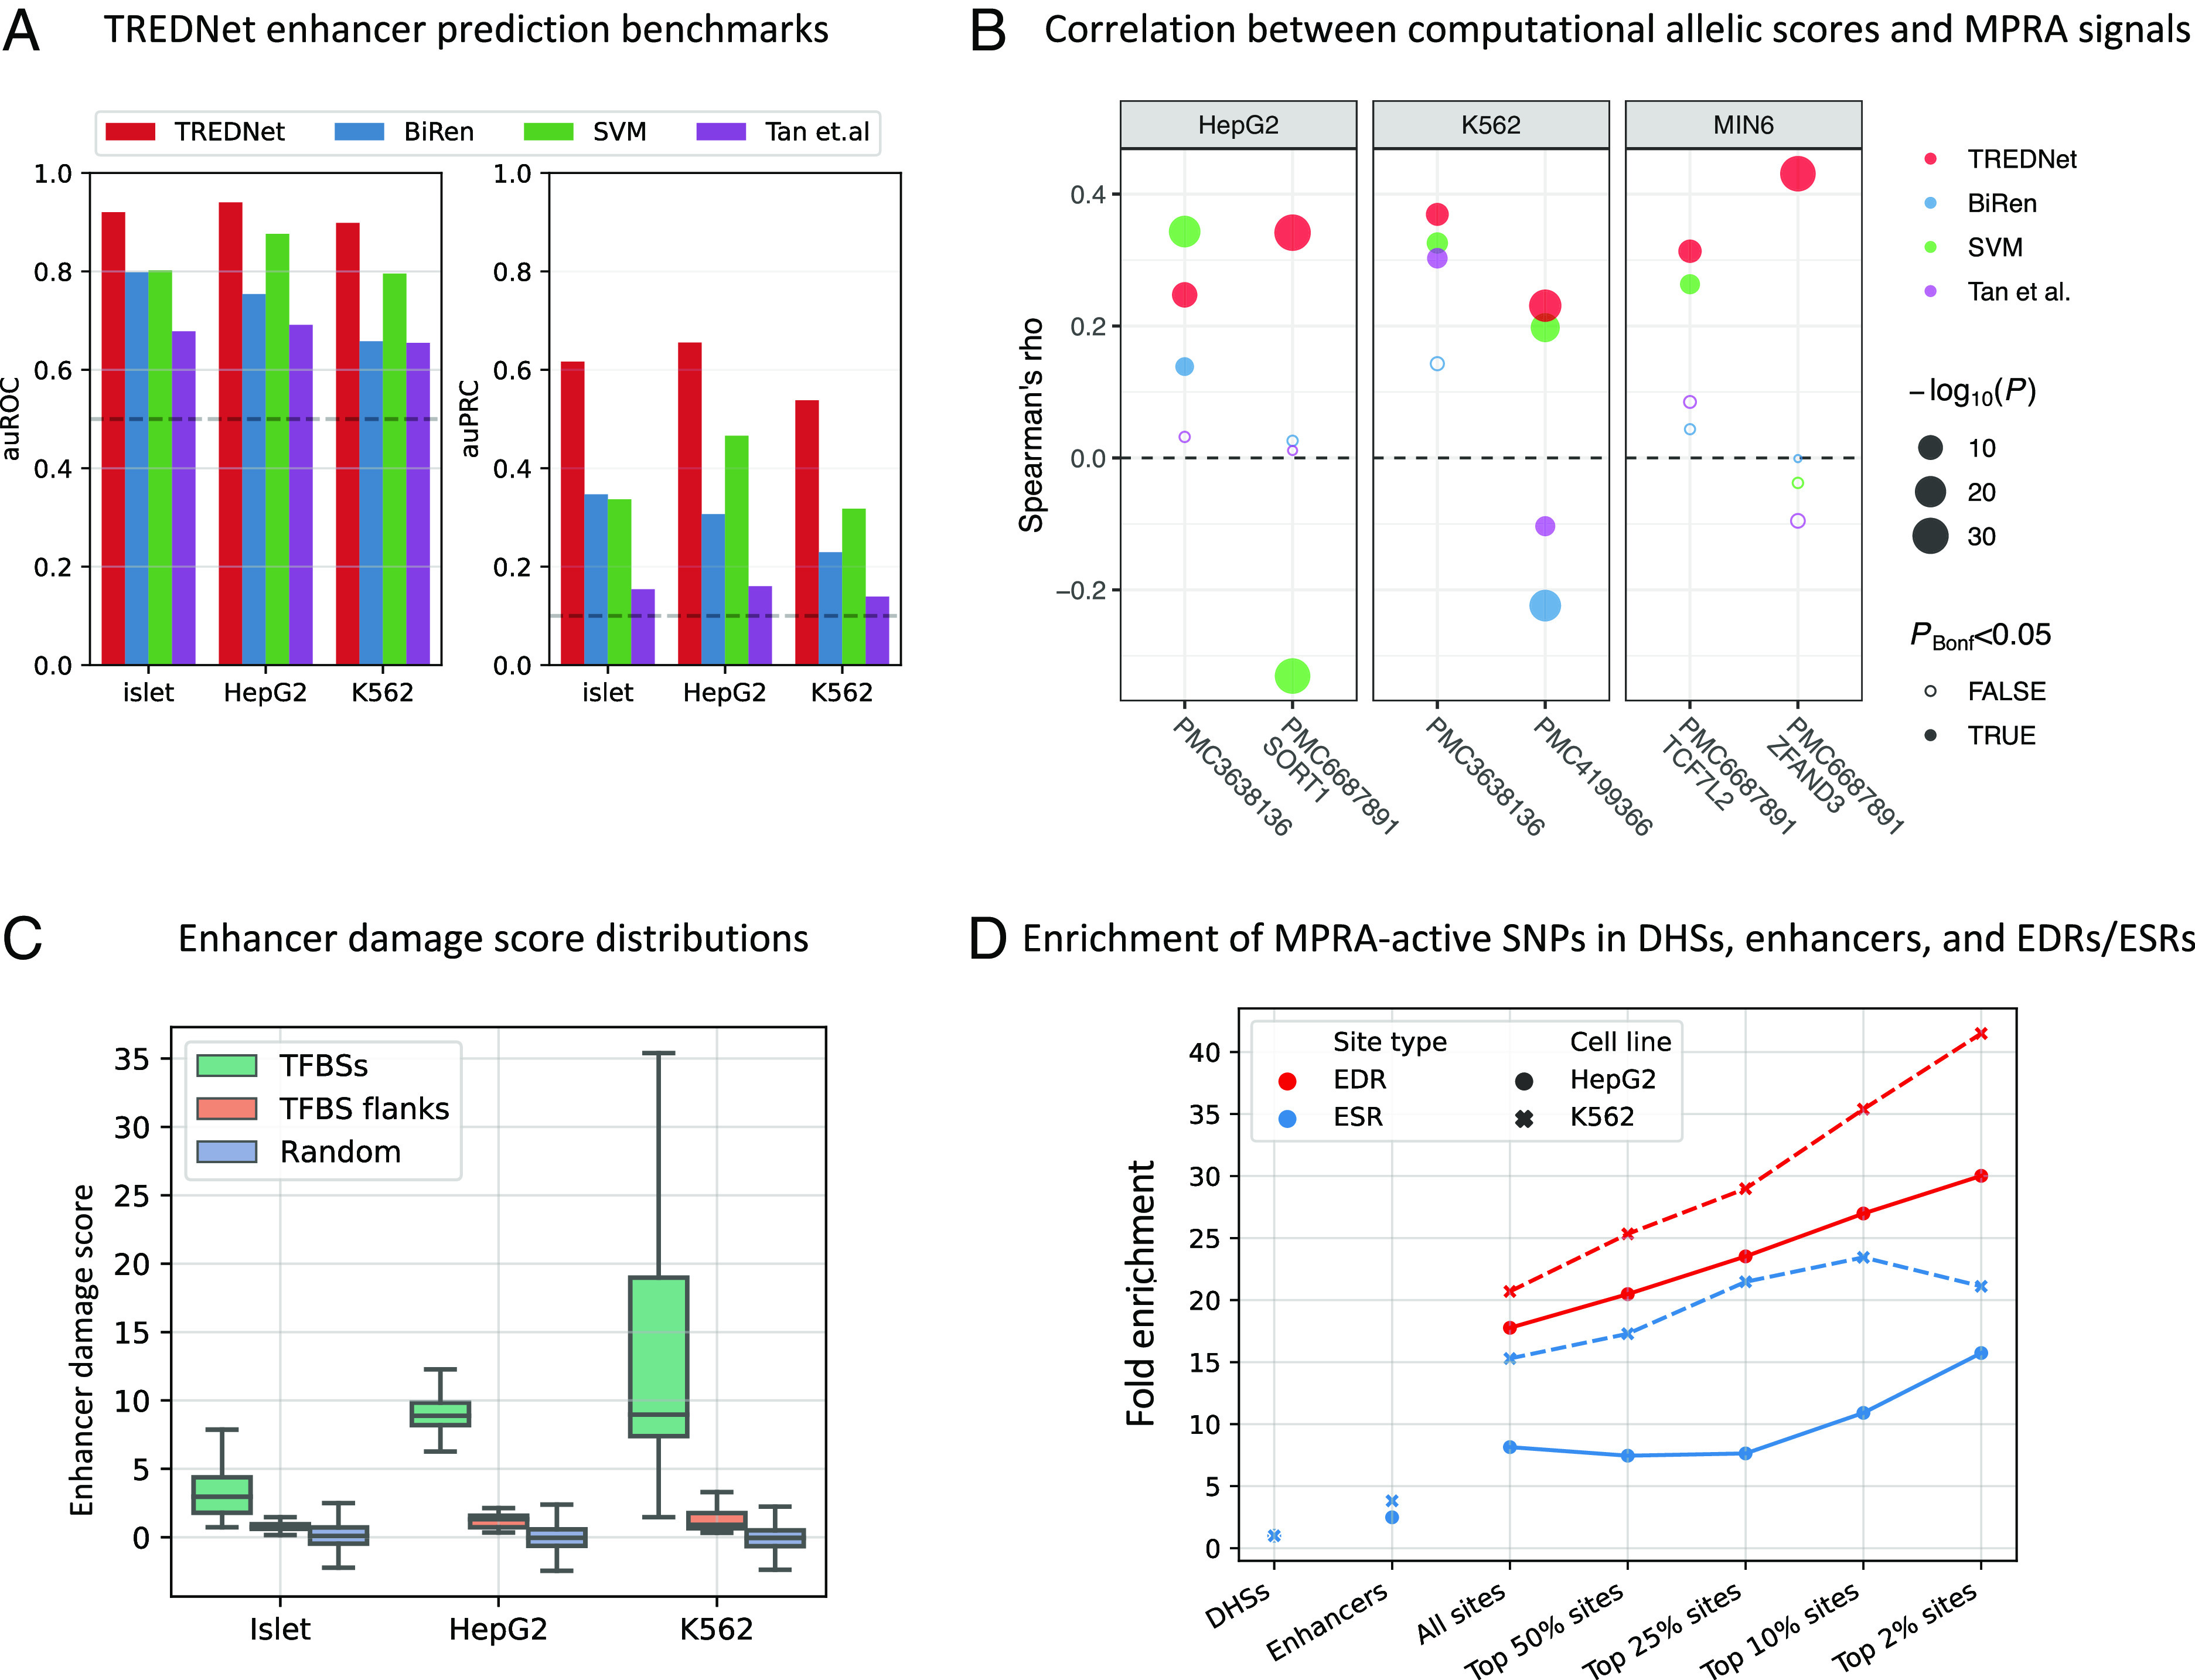
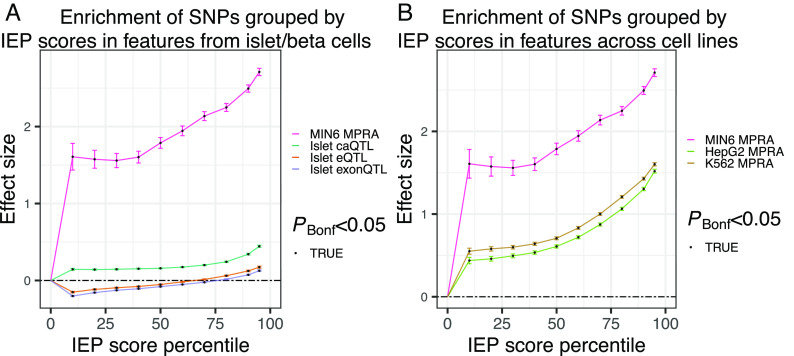
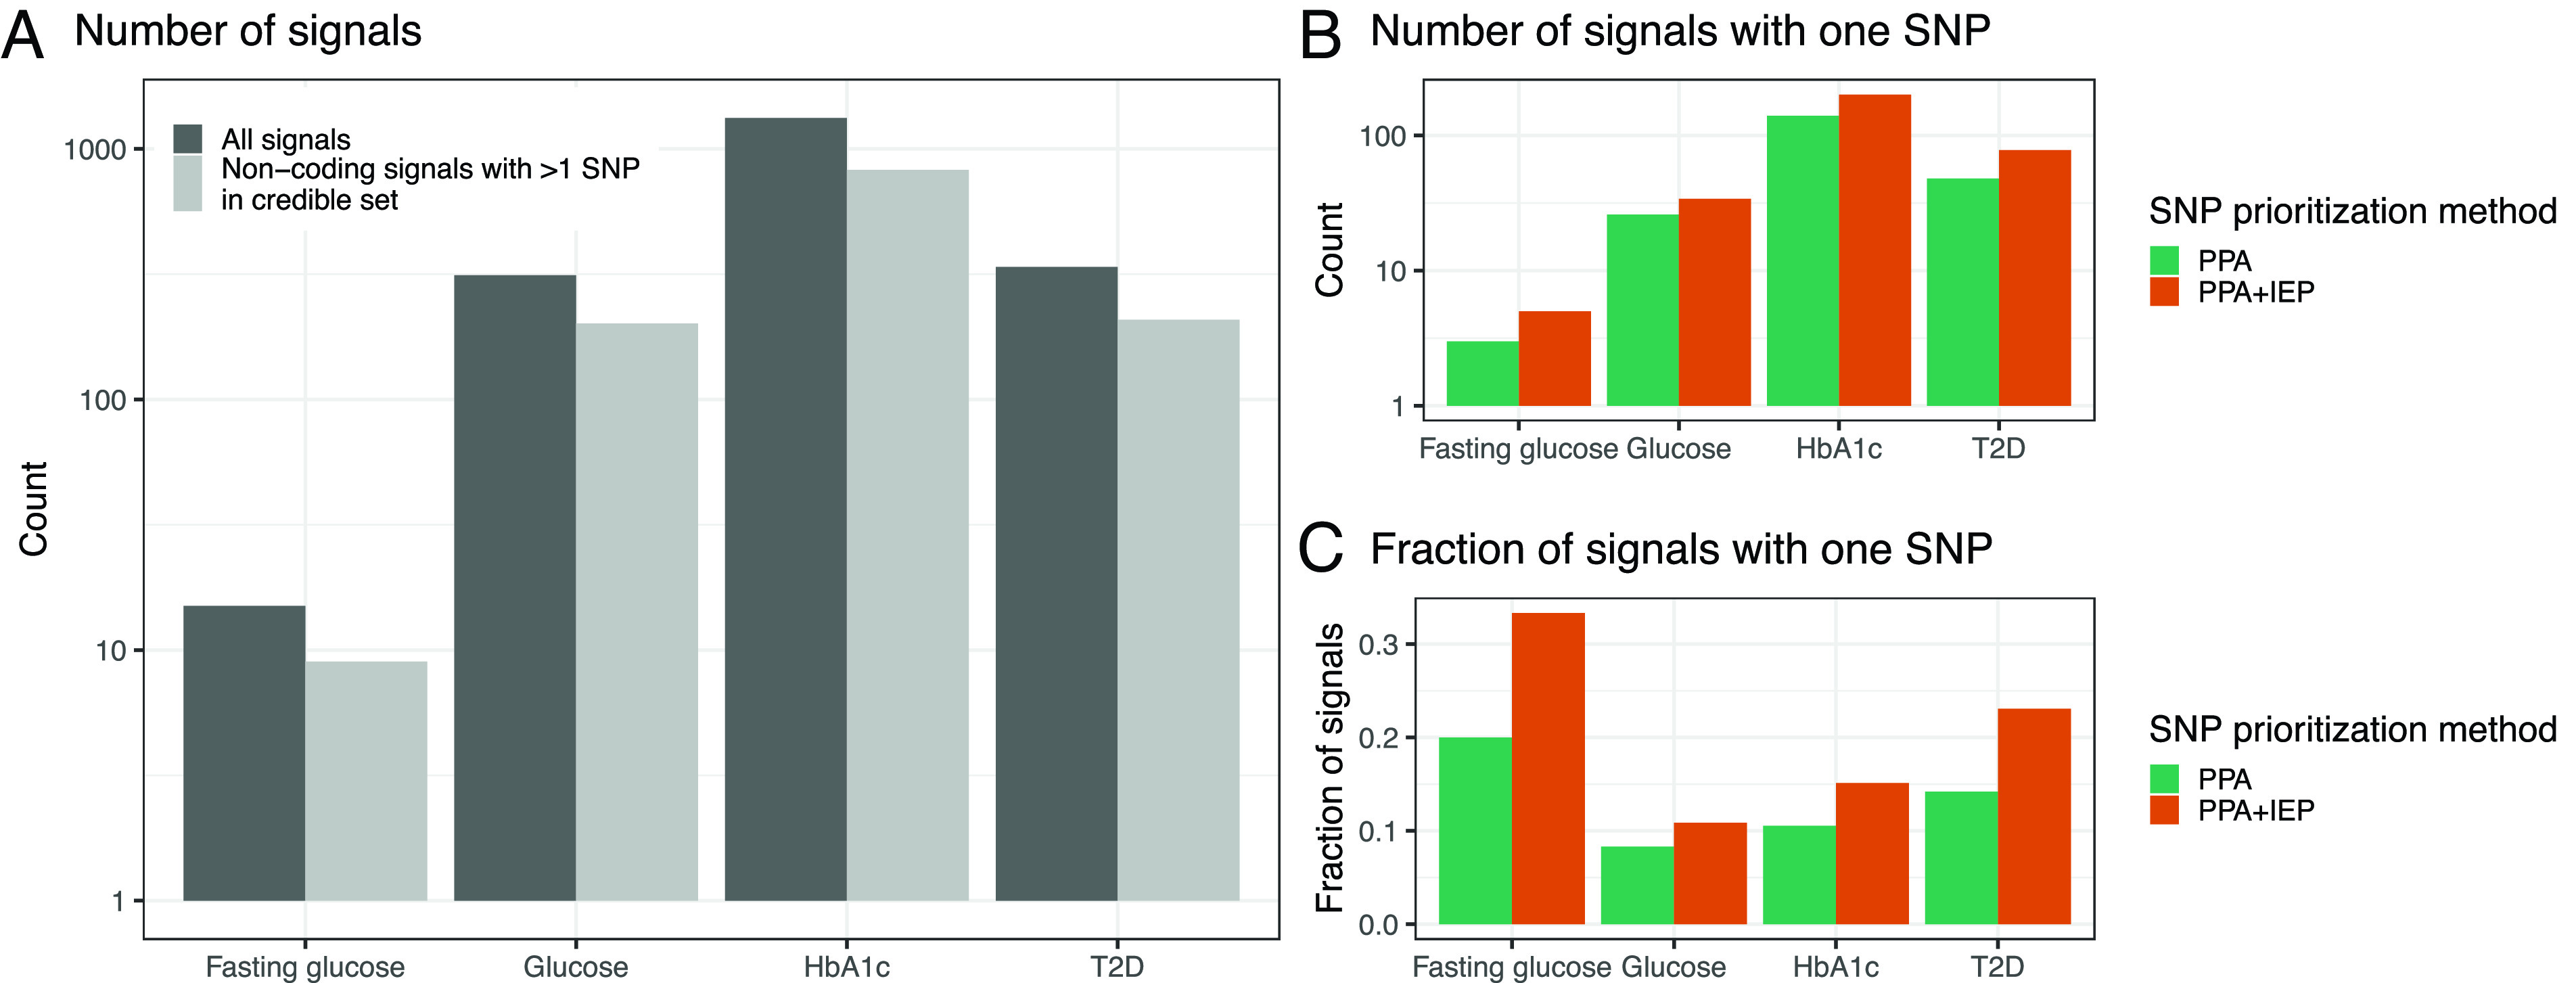
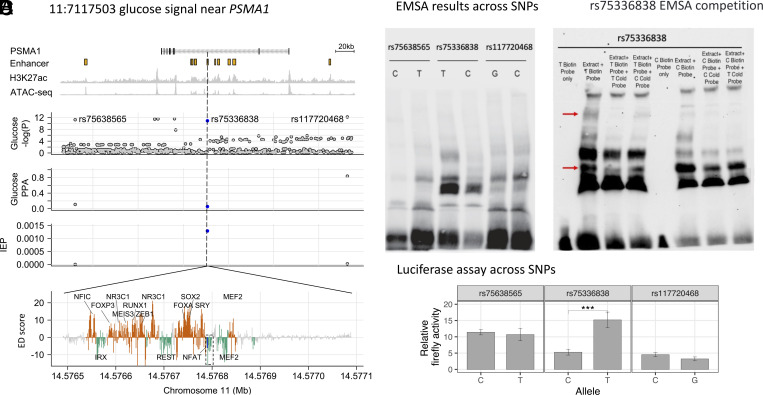
Genetic association studies have identified hundreds of independent signals associated with type 2 diabetes (T2D) and related traits. Despite these successes, the identification of specific causal variants underlying a genetic association signal remains challenging. In this study, we describe a deep learning (DL) method to analyze the impact of sequence variants on enhancers. Focusing on pancreatic islets, a T2D relevant tissue, we show that our model learns islet-specific transcription factor (TF) regulatory patterns and can be used to prioritize candidate causal variants. At 101 genetic signals associated with T2D and related glycemic traits where multiple variants occur in linkage disequilibrium, our method nominates a single causal variant for each association signal, including three variants previously shown to alter reporter activity in islet-relevant cell types. For another signal associated with blood glucose levels, we biochemically test all candidate causal variants from statistical fine-mapping using a pancreatic islet beta cell line and show biochemical evidence of allelic effects on TF binding for the model-prioritized variant. To aid in future research, we publicly distribute our model and islet enhancer perturbation scores across ~67 million genetic variants. We anticipate that DL methods like the one presented in this study will enhance the prioritization of candidate causal variants for functional studies.

Keywords: deep learning; enhancer; epigenomics; pancreatic islets; type 2 diabetes.


Conflict of interest statement

S.C. is the co-founders of OncoBeat, LLC. and a consultant of Vesalius Therapeutics. The other authors declare no competing interest.

Figures

Fig. 1.
Fig. 1.
Graphical overview of this study. (A) Overview of TREDNet. TREDNet consists of two convolutional neural networks (CNNs; mesh of gray lines and blue circles). The first CNN is trained on genomic regions in one-hot encoded representation to predict peaks of epigenomic features, including TFs, histone modifications (HMs), and DNase I hypersensitivity sites (DHSs). The second CNN is trained on the output from the first CNN to predict enhancer regions. Enhancer graphic created with BioRender.com. (B) Saturated mutagenesis analysis using TREDNet produces enhancer damage (ED) scores, which are used to predict TF-binding sites (TFBSs), corresponding to peaks (enhancer damaging regions; EDRs) and dips (enhancer strengthening regions; ESRs) in ED scores. Bars depict ED scores of each genomic position (x axis). Blue bars show positions corresponding to known TFBSs. Red bars show TFBSs predicted by a CNN (mesh of gray lines and blue circles) using ED scores. (C) Allelic differences in TREDNet enhancer probability scores are used to calculate islet enhancer perturbation (IEP) scores for each SNP. (D) Schematic locus zoom example at a genetic signal where a candidate causal SNP is identified. Green boxes depict gene coding regions along the genome (x axis). Subsequent facets show different signals for each SNP (points): the −log10(P) of the genetic association, the posterior probability of association (PPA) from statistical fine-mapping, IEP scores, and ED scores. Funnel schematic describes the framework used to identify candidate causal SNPs. SNPs from 95/99% credible sets are prioritized using IEP scores. Subsequently, SNPs are prioritized by EDR/ESR overlap.
Fig. 2.
Fig. 2.
Characterization of TREDNet, TREDNet ED scores, and EDRs/ESRs. (A) Phase two TREDNet enhancer prediction accuracy across biospecimens (x axis) compared to other models (colors) using auROC (Left) and area under the precision recall curve (auPRC; Right) metrics (y axis). Dashed horizontal lines show the performance of a random classifier: auROC = 0.5 and auPRC = 0.09. (B) Correlation (Spearman’s rho; y axis) between predictions of computational methods (colors) and MPRA signals from different experiments (x axis; coded using PubMed Central identifiers) across biospecimens (facets). (C) Distribution of TREDNet ED scores (y axis) in TFBSs, TFBS flanking regions, and random genomic regions outside of TFBSs (colors) across biospecimens (x axis). (D) Enrichment (y axis) of active SNPs from HepG2 and K562 MPRA experiments (point shape and linetype) in EDRs/ESRs (colors), enhancers, and DHSs (x axis). EDRs/ESRs are binned into five groups by their average ED scores.
Fig. 3.
Fig. 3.
Validation of IEP SNP scores. (A) Enrichment and SE (y axis) of SNPs grouped by IEP percentile (x axis) in islet/beta cell validation data (color). (B) Enrichment and SE (y axis) of SNPs grouped by IEP percentile (x axis) in MPRA signals from MIN6 beta cells, K562, and HepG2 (color).
Fig. 4.
Fig. 4.
Results of IEP ratio1:2 prioritization of credible set SNPs. (A) Total number of independent signals (y axis) for each disease/trait considered (x axis). (B) Number of signals with one SNP (y axis) in the 95/99% credible set before (green) and after applying the IEP ratio1:2 SNP prioritization method (orange) for each disease/trait considered (x axis). PPA stands for posterior probability of association. (C) Fraction of signals with one SNP (y axis) in the 95/99% credible set before (green) and after applying the IEP ratio1:2 SNP prioritization method (orange) for each disease/trait considered (x axis).
Fig. 5.
Fig. 5.
PSMA1 locus. (A) Locus zoom around the 11:7117503 glucose association [Glucose −log10(P) facet] near PSMA1. Top facet shows islet enhancers, called from islet H3K27ac ChIP-seq and ATAC-seq data. rs75336838 (blue) is one of three SNPs in the 95% glucose credible set (PPA facet), has a large IEP score (IEP facet), and occurs in an ESR region (green; EDR regions shown in orange), defined by ED scores from in silico saturated mutagenesis (ED score facet). Dashed box indicates the ESR containing the candidate SNP (blue line). (B) Electrophoretic mobility shift assay (EMSA) for all SNPs in the 95% credible set. (C) Competition EMSA for rs75336838. Red arrows indicate bands of interest. (D) Average luciferase activity across replicates for both alleles of candidate SNPs. Error bars correspond to SE. *** indicates Wilcoxon rank sum test P < 0.001.

Similar articles

Cited by

References

    1. Claussnitzer M., et al. , A brief history of human disease genetics. Nature 577, 179–189 (2020). - PMC - PubMed
    1. Orkin S. H., Bauer D. E., Emerging genetic therapy for sickle cell disease. Annu. Rev. Med. 70, 257–271 (2019). - PubMed
    1. Sabatine M. S., PCSK9 inhibitors: Clinical evidence and implementation. Nat. Rev. Cardiol. 16, 155–165 (2019). - PubMed
    1. Hutchinson A., Asimit J., Wallace C., Fine-mapping genetic associations. Hum. Mol. Genet. 29, R81–R88 (2020). - PMC - PubMed
    1. Kahn S. E., Cooper M. E., Del Prato S., Pathophysiology and treatment of type 2 diabetes: Perspectives on the past, present, and future. Lancet 383, 1068–1083 (2014). - PMC - PubMed

Publication types

MeSH terms