. 2023 Nov 1;11(11):1462-1479.
doi: 10.1158/2326-6066.CIR-23-0045.

Targeted Inhibition of lncRNA Malat1 Alters the Tumor Immune Microenvironment in Preclinical Syngeneic Mouse Models of Triple-Negative Breast Cancer

Affiliations

Targeted Inhibition of lncRNA Malat1 Alters the Tumor Immune Microenvironment in Preclinical Syngeneic Mouse Models of Triple-Negative Breast Cancer

Oluwatoyosi Adewunmi et al. Cancer Immunol Res. .

Abstract

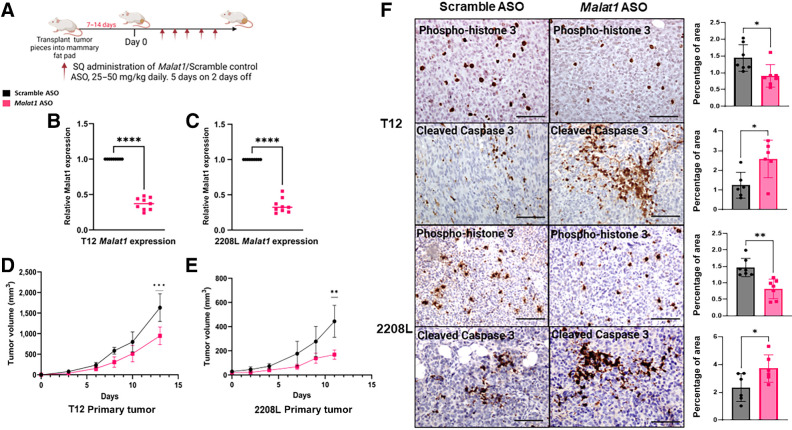
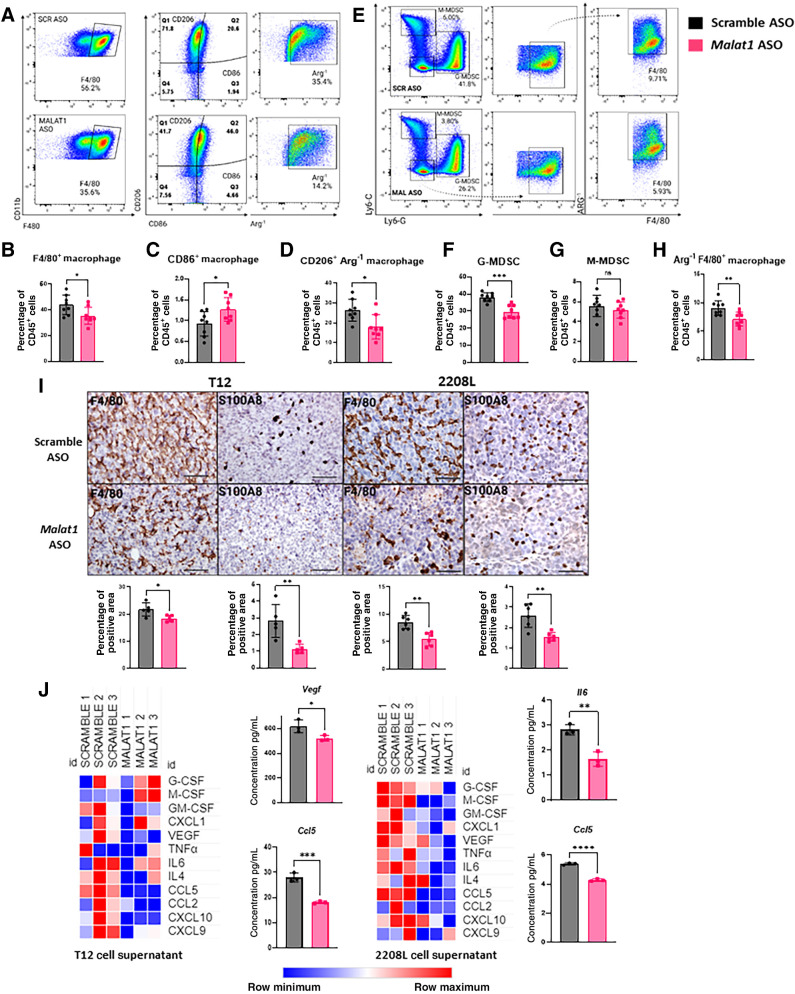
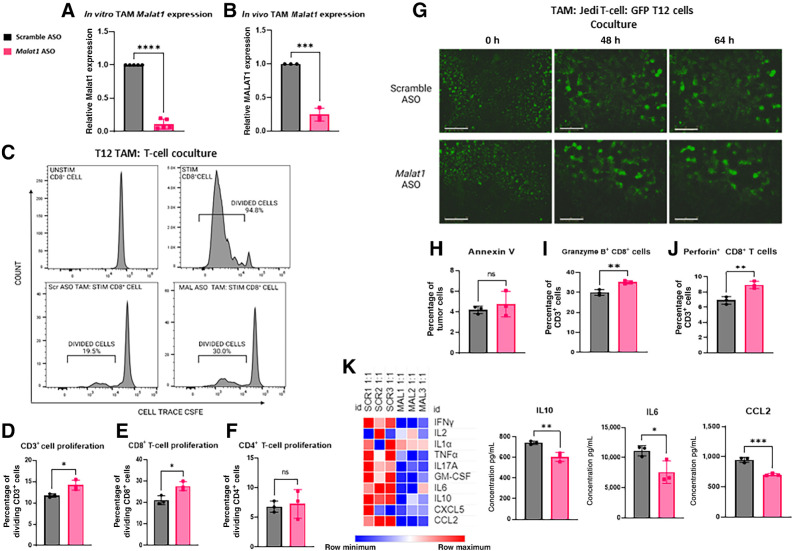
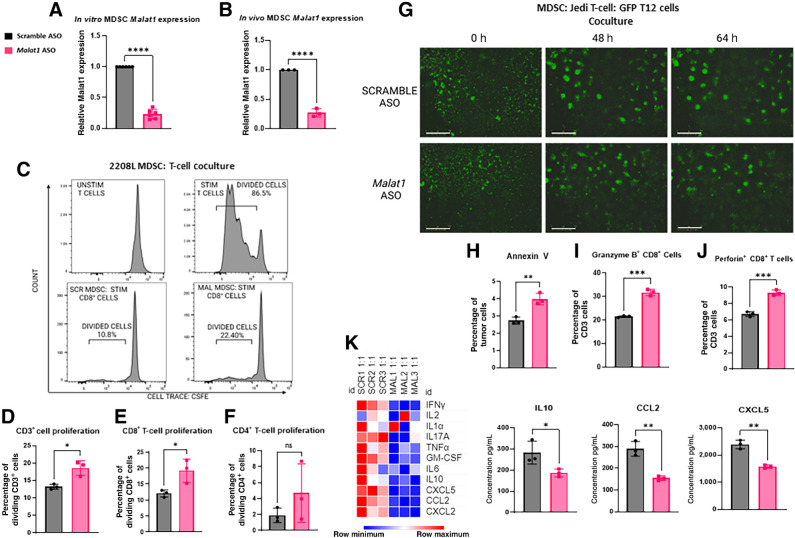
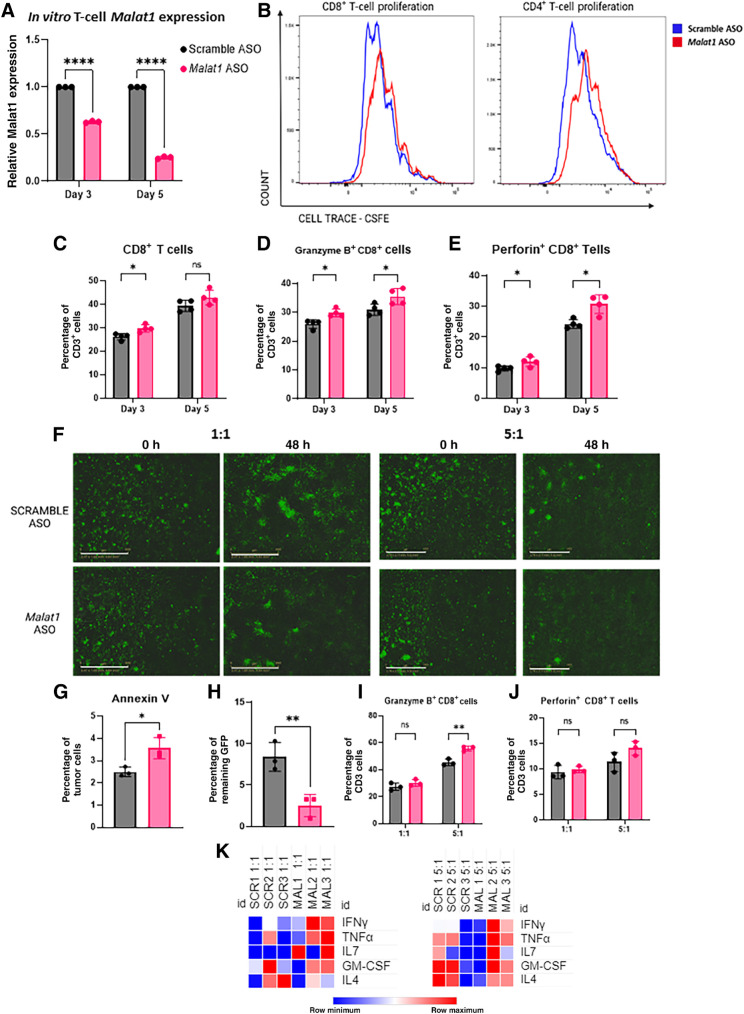
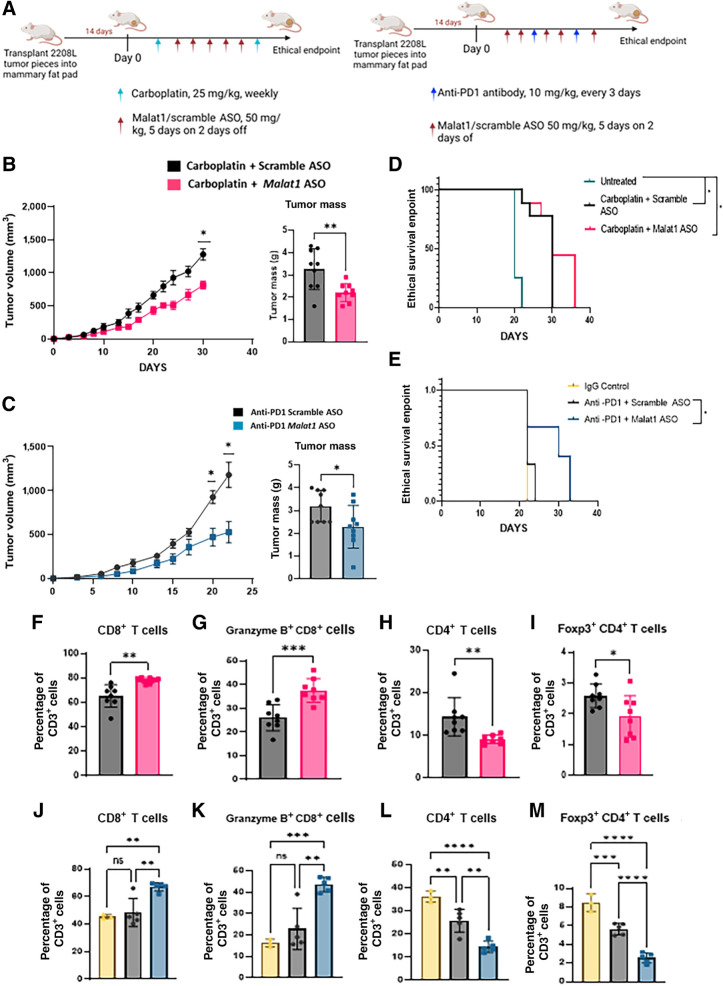
Long noncoding RNAs (lncRNA) play an important role in gene regulation in both normal tissues and cancer. Targeting lncRNAs is a promising therapeutic approach that has become feasible through the development of gapmer antisense oligonucleotides (ASO). Metastasis-associated lung adenocarcinoma transcript (Malat1) is an abundant lncRNA whose expression is upregulated in several cancers. Although Malat1 increases the migratory and invasive properties of tumor cells, its role in the tumor microenvironment (TME) is still not well defined. We explored the connection between Malat1 and the tumor immune microenvironment (TIME) using several immune-competent preclinical syngeneic Tp53-null triple-negative breast cancer (TNBC) mouse models that mimic the heterogeneity and immunosuppressive TME found in human breast cancer. Using a Malat1 ASO, we were able to knockdown Malat1 RNA expression resulting in a delay in primary tumor growth, decreased proliferation, and increased apoptosis. In addition, immunophenotyping of tumor-infiltrating lymphocytes revealed that Malat1 inhibition altered the TIME, with a decrease in immunosuppressive tumor-associated macrophages (TAM) and myeloid-derived suppressor cells (MDSC) as well as an increase in cytotoxic CD8+ T cells. Malat1 depletion in tumor cells, TAMs, and MDSCs decreased immunosuppressive cytokine/chemokine secretion whereas Malat1 inhibition in T cells increased inflammatory secretions and T-cell proliferation. Combination of a Malat1 ASO with chemotherapy or immune checkpoint blockade (ICB) improved the treatment responses in a preclinical model. These studies highlight the immunostimulatory effects of Malat1 inhibition in TNBC, the benefit of a Malat1 ASO therapeutic, and its potential use in combination with chemotherapies and immunotherapies.


Figures

Figure 1. Single-agent Malat1 ASO delays primary tumor growth in the TNBC preclinical mouse model. A, Experimental design of treatment study. WT BALB/c mice had T12 or 2208 L tumor pieces implanted into the mammary fat pad and were treated with either Scramble ASO or Malat1 ASO once tumor was palpable (≤50 mm3). B and C, qPCR analysis of RNA extracted from tumors display significant decrease of Malat1 expression in the Malat1 ASO treatment group. Relative fold change based on Gapdh RNA level. Error bars represent standard deviation (SD), ****, P < 0.0001 using the two-tailed unpaired Student t test. D and E, Tumor growth curves of T12 and 2208 L mice treated with Scramble ASO (n = 9) and Malat1 ASO (n = 9). Data points represented as the mean ± SD. **, P < 0.01; ***, P < 0.001 by two-way ANOVA and Sidak's multiple comparisons test. Treatment studies were performed once in T12 tumor and twice in 2208 L tumors. F, Representative IHC images of tumor sections stained for Phospho-histone 3 and Cleaved Caspase 3; scale bar, 80 μm. Quantifications of positive area of tumor sections using ImageJ using the geometric mean of 3 representative images from each tumor section, 6–7 tumor sections were used for each treatment group. Error bars represent SD, ****, P < 0.0001 using the two-tailed unpaired Student t test.
Figure 1.
Single-agent Malat1 ASO delays primary tumor growth in the TNBC preclinical mouse model. A, Experimental design of treatment study. WT BALB/c mice had T12 or 2208 L tumor pieces implanted into the mammary fat pad and were treated with either Scramble ASO or Malat1 ASO once tumor was palpable (≤50 mm3). B and C, qPCR analysis of RNA extracted from tumors display significant decrease of Malat1 expression in the Malat1 ASO treatment group. Relative fold change based on Gapdh RNA level. Error bars represent standard deviation (SD), ****, P < 0.0001 using the two-tailed unpaired Student t test. D and E, Tumor growth curves of T12 and 2208 L mice treated with Scramble ASO (n = 9) and Malat1 ASO (n = 9). Data points represented as the mean ± SD. **, P < 0.01; ***, P < 0.001 by two-way ANOVA and Sidak's multiple comparisons test. Treatment studies were performed once in T12 tumor and twice in 2208 L tumors. F, Representative IHC images of tumor sections stained for Phospho-histone 3 and Cleaved Caspase 3; scale bar, 80 μm. Quantifications of positive area of tumor sections using ImageJ using the geometric mean of 3 representative images from each tumor section, 6–7 tumor sections were used for each treatment group. Error bars represent SD, ****, P < 0.0001 using the two-tailed unpaired Student t test.
Figure 2. Malat1 inhibition decreases immunosuppressive myeloid cells in the TME. A, Gating strategy was used to identify macrophages in the TILs of T12 tumors using FlowJo 10.8.1. B–D, Flow cytometry quantification of macrophage populations as the percentage of CD45+ cells using GraphPad Prism 9.4.1. Eight tumors used for each treatment group. Error bars represent standard deviation (SD). *, P < 0.05; **, P < 0.01; ***, P < 0.001 using the two-tailed unpaired Student t test. E, Gating strategy used to identify neutrophils in the TILs of 2208 L tumors using FlowJo 10.8.1. F–H, Flow cytometry quantification of myeloid populations as the percentage of CD45+ populations using GraphPad Prism 9.4.1. Error bars represent SD. *, P < 0.05; **, P < 0.01; ***, P < 0.001 using the two-tailed unpaired Student t test. Eight tumors were used in each treatment group. The experiment was performed once with T12 primary tumors and twice with 2208 L primary tumors. I, Representative IHC images of tumor sections stained for F4/80 and S100a8; scale bar, 80 μm. Quantifications of positive area of tumor sections using ImageJ using the geometric mean of up to 3 representative images from each tumor section (n = 5–6 tumors). Error bars represent SD. *, P < 0.05; **, P < 0.01; ***, P < 0.001 using the two-tailed unpaired Student t test. J, Heat map of cytokine/chemokine array of supernatants collected from 2208 L and T12 tumor-derived cell lines after Malat1 knockdown. Quantification of immunosuppressive cytokine/chemokines. Error bars represent SD. *, P < 0.05; **, P < 0.01; ****, P < 0.0001 using the two-tailed unpaired Student t test.
Figure 2.
Malat1 inhibition decreases immunosuppressive myeloid cells in the TME. A, Gating strategy was used to identify macrophages in the TILs of T12 tumors using FlowJo 10.8.1. B–D, Flow cytometry quantification of macrophage populations as the percentage of CD45+ cells using GraphPad Prism 9.4.1. Eight tumors used for each treatment group. Error bars represent standard deviation (SD). *, P < 0.05; **, P < 0.01; ***, P < 0.001 using the two-tailed unpaired Student t test. E, Gating strategy used to identify neutrophils in the TILs of 2208 L tumors using FlowJo 10.8.1. F–H, Flow cytometry quantification of myeloid populations as the percentage of CD45+ populations using GraphPad Prism 9.4.1. Error bars represent SD. *, P < 0.05; **, P < 0.01; ***, P < 0.001 using the two-tailed unpaired Student t test. Eight tumors were used in each treatment group. The experiment was performed once with T12 primary tumors and twice with 2208 L primary tumors. I, Representative IHC images of tumor sections stained for F4/80 and S100a8; scale bar, 80 μm. Quantifications of positive area of tumor sections using ImageJ using the geometric mean of up to 3 representative images from each tumor section (n = 5–6 tumors). Error bars represent SD. *, P < 0.05; **, P < 0.01; ***, P < 0.001 using the two-tailed unpaired Student t test. J, Heat map of cytokine/chemokine array of supernatants collected from 2208 L and T12 tumor-derived cell lines after Malat1 knockdown. Quantification of immunosuppressive cytokine/chemokines. Error bars represent SD. *, P < 0.05; **, P < 0.01; ****, P < 0.0001 using the two-tailed unpaired Student t test.
Figure 3. Malat1 inhibition decreases TAM-immunosuppressive function. A, qPCR analysis of RNA extracted from TAMs extracted from a T12 primary tumors and cultured in vitro for 72 hours with 250 nmol/L ASO of Scramble/Malat1 ASO displays significant decrease of Malat1 RNA expression in the Malat1 ASO treatment group. Relative fold change based on Gapdh RNA level. Error bars represent standard deviation (SD), ****, P < 0.0001 using the two-tailed unpaired Student t test. Data are representative of 3 independent experiments. B, qPCR analysis of RNA extracted from isolated TAMs extracted from a T12 primary tumor after 5 days of subcutaneous treatment displays significant decrease of Malat1 expression in the Malat1 ASO treatment group. Relative fold change based on Gapdh RNA level. Error bars represent SD, ***, P < 0.001 using the two-tailed unpaired Student t test. C, Representative proliferation plots of isolated TAMs from T12 primary tumors cultured with T cells collected from naïve splenocytes of BALB/c mice and stained with CFSE and activated with CD3/CD28 Dynabeads at 0.5:1 TAM:T-cell ratio. Stained unstimulated control and stained stimulated T cells without TAMs were used to create appropriate gates. D–F, Flow cytometry quantification of CD3+, CD8+, and CD4 + T cells after 72 hours coculture with Malat1-depleted TAMs as the percentage of parent population. Experimental n = 3. Error bars represent SD, *, P < 0.05 using the two-tailed unpaired Student t test. G, Representative Incucyte images of the GFP-labeled T12 tumor-derived cell line cultured with isolated TAMs from a T12 primary tumor and GFP-specific T cells isolated from the splenocytes of a WT JEDI mouse at a 1:1:1 ratio. A total of 5,000 tumor cells were plated 24 hours before the addition of TAMs and T cells; scale bar, 800 μm. Images were taken at 0, 48, and 64 hours. Experimental n = 2. H and I, Flow cytometry quantification of Annexin V+ tumor cells and quantification of Granzyme B+ and Perforin+ T cells after 72 hours. Error bars represent SD. *, P < 0.05; **, P < 0.01; ***, P < 0.001 using the two-tailed unpaired Student t test. K, Heat map of cytokine/chemokine array of supernatant collected from cocultures with Malat1-depleted TAMs, GFP-labeled tumor, and GFP-specific T cells at a 1:1 TAM:T-cell ratio, where 25,000 TAMs and 25,000 T cells were added to wells containing 5,000 GFP positive tumor cells. Quantification of key immunosuppressive cytokine/chemokines. Error bars represent SD. *, P < 0.05; **, P < 0.01; ***, P < 0.001 using the two-tailed unpaired Student t test.
Figure 3.
Malat1 inhibition decreases TAM-immunosuppressive function. A, qPCR analysis of RNA extracted from TAMs extracted from a T12 primary tumors and cultured in vitro for 72 hours with 250 nmol/L ASO of Scramble/Malat1 ASO displays significant decrease of Malat1 RNA expression in the Malat1 ASO treatment group. Relative fold change based on Gapdh RNA level. Error bars represent standard deviation (SD), ****, P < 0.0001 using the two-tailed unpaired Student t test. Data are representative of 3 independent experiments. B, qPCR analysis of RNA extracted from isolated TAMs extracted from a T12 primary tumor after 5 days of subcutaneous treatment displays significant decrease of Malat1 expression in the Malat1 ASO treatment group. Relative fold change based on Gapdh RNA level. Error bars represent SD, ***, P < 0.001 using the two-tailed unpaired Student t test. C, Representative proliferation plots of isolated TAMs from T12 primary tumors cultured with T cells collected from naïve splenocytes of BALB/c mice and stained with CFSE and activated with CD3/CD28 Dynabeads at 0.5:1 TAM:T-cell ratio. Stained unstimulated control and stained stimulated T cells without TAMs were used to create appropriate gates. D–F, Flow cytometry quantification of CD3+, CD8+, and CD4 + T cells after 72 hours coculture with Malat1-depleted TAMs as the percentage of parent population. Experimental n = 3. Error bars represent SD, *, P < 0.05 using the two-tailed unpaired Student t test. G, Representative Incucyte images of the GFP-labeled T12 tumor-derived cell line cultured with isolated TAMs from a T12 primary tumor and GFP-specific T cells isolated from the splenocytes of a WT JEDI mouse at a 1:1:1 ratio. A total of 5,000 tumor cells were plated 24 hours before the addition of TAMs and T cells; scale bar, 800 μm. Images were taken at 0, 48, and 64 hours. Experimental n = 2. H and I, Flow cytometry quantification of Annexin V+ tumor cells and quantification of Granzyme B+ and Perforin+ T cells after 72 hours. Error bars represent SD. *, P < 0.05; **, P < 0.01; ***, P < 0.001 using the two-tailed unpaired Student t test. K, Heat map of cytokine/chemokine array of supernatant collected from cocultures with Malat1-depleted TAMs, GFP-labeled tumor, and GFP-specific T cells at a 1:1 TAM:T-cell ratio, where 25,000 TAMs and 25,000 T cells were added to wells containing 5,000 GFP positive tumor cells. Quantification of key immunosuppressive cytokine/chemokines. Error bars represent SD. *, P < 0.05; **, P < 0.01; ***, P < 0.001 using the two-tailed unpaired Student t test.
Figure 4. Malat1 inhibition decreases MDSC-immunosuppressive function. A, qPCR analysis of RNA extracted from GR1+ cells, extracted from a 2208 L primary tumor, and cultured in vitro for 72 hours with 250 nmol/L of Scramble/Malat1 ASO displays significant decrease of Malat1 expression in the Malat1 ASO treatment group. Relative fold change based on GAPDH RNA level. Error bars represent standard deviation (SD) ****, P < 0.0001 using the two-tailed unpaired Student t test. B, qPCR analysis of RNA extracted from isolated Gr1+ cells from 2208 L primary tumors after 5 days of subcutaneous ASO treatment displays significant decrease of Malat1 expression in the Malat1 ASO treatment group. Relative fold change based on Gapdh RNA level. Error bars represent SD, ***, P < 0.001 using the two-tailed unpaired Student t test. C, Representative proliferation plots of isolated MDSCs from 2208 L primary tumors cultured with T cells isolated from naïve splenocytes of BALB/c mice and stained with CFSE and activated with CD3/CD28 Dynabeads at 0.5:1 MDSC:T-cell ratio. 25,000 2208 L tumor cells were added to culture to improve MDSC cell viability. Stained unstimulated control and stained stimulated T cells without MDSCs were used to create appropriate gates. D–F, Flow cytometry quantification of CD3+, CD8+, and CD4 + T cells as the percentage of parent population after 72 hours coculture with Malat1-depleted MDSCs. Experimental n = 2. Error bars represent SD, *, P < 0.05 using the two-tailed unpaired Student t test. G, Representative Incucyte images of GFP-labeled T12 tumor-derived cell line cultured with isolated Gr1+ cells isolated from a T12 primary tumor and GFP-specific T cells isolated from the splenocytes of a WT JEDI mouse at a 1:1:1 ratio. A total of 5,000 tumor cells were plated 24 hours before the addition of MDSCs and T cells; scale bar, 800 μm. Images were taken at 0, 48, and 64 hours. H–J, Flow cytometry quantification of Annexin V+ tumor cells and quantification of Granzyme B+ and Perforin+ T cells after 72 hours. Error bars represent SD. *, P < 0.05; **, P < 0.01; ***, P < 0.001 using the two-tailed unpaired Student t test. K, Heat map of cytokine/chemokine array of supernatant collected from cocultures with Malat1-depleted MDSCs, GFP-labeled tumor cells, and GFP-specific T cells at a 1:1 MDSC:T-cell ratio where a total of 5,000 MDSCs and 5,000 T cells were added to wells containing 5,000 GFP-positive tumor cells. Quantification of key immunosuppressive cytokine/chemokines. Error bars represent SD. *, P < 0.05; ***, P < 0.001 using the two-tailed unpaired Student t test.
Figure 4.
Malat1 inhibition decreases MDSC-immunosuppressive function. A, qPCR analysis of RNA extracted from GR1+ cells, extracted from a 2208 L primary tumor, and cultured in vitro for 72 hours with 250 nmol/L of Scramble/Malat1 ASO displays significant decrease of Malat1 expression in the Malat1 ASO treatment group. Relative fold change based on GAPDH RNA level. Error bars represent standard deviation (SD) ****, P < 0.0001 using the two-tailed unpaired Student t test. B, qPCR analysis of RNA extracted from isolated Gr1+ cells from 2208 L primary tumors after 5 days of subcutaneous ASO treatment displays significant decrease of Malat1 expression in the Malat1 ASO treatment group. Relative fold change based on Gapdh RNA level. Error bars represent SD, ***, P < 0.001 using the two-tailed unpaired Student t test. C, Representative proliferation plots of isolated MDSCs from 2208 L primary tumors cultured with T cells isolated from naïve splenocytes of BALB/c mice and stained with CFSE and activated with CD3/CD28 Dynabeads at 0.5:1 MDSC:T-cell ratio. 25,000 2208 L tumor cells were added to culture to improve MDSC cell viability. Stained unstimulated control and stained stimulated T cells without MDSCs were used to create appropriate gates. D–F, Flow cytometry quantification of CD3+, CD8+, and CD4 + T cells as the percentage of parent population after 72 hours coculture with Malat1-depleted MDSCs. Experimental n = 2. Error bars represent SD, *, P < 0.05 using the two-tailed unpaired Student t test. G, Representative Incucyte images of GFP-labeled T12 tumor-derived cell line cultured with isolated Gr1+ cells isolated from a T12 primary tumor and GFP-specific T cells isolated from the splenocytes of a WT JEDI mouse at a 1:1:1 ratio. A total of 5,000 tumor cells were plated 24 hours before the addition of MDSCs and T cells; scale bar, 800 μm. Images were taken at 0, 48, and 64 hours. H–J, Flow cytometry quantification of Annexin V+ tumor cells and quantification of Granzyme B+ and Perforin+ T cells after 72 hours. Error bars represent SD. *, P < 0.05; **, P < 0.01; ***, P < 0.001 using the two-tailed unpaired Student t test. K, Heat map of cytokine/chemokine array of supernatant collected from cocultures with Malat1-depleted MDSCs, GFP-labeled tumor cells, and GFP-specific T cells at a 1:1 MDSC:T-cell ratio where a total of 5,000 MDSCs and 5,000 T cells were added to wells containing 5,000 GFP-positive tumor cells. Quantification of key immunosuppressive cytokine/chemokines. Error bars represent SD. *, P < 0.05; ***, P < 0.001 using the two-tailed unpaired Student t test.
Figure 5. Malat1 inhibition increases T-cell infiltration in the TME. A, Gating strategy used to identify cytotoxic CD8+ T cells and regulatory CD4+ T cells in the TILs of 2208 L tumors using FlowJo 10.8.1. B–J, Flow cytometry quantification of T cells as the percentage of CD45+ populations in 2208 L and T12 tumors using GraphPad Prism 9.4.1. Error bars represent standard deviation (SD), *, P < 0.05; **, P < 0.01; ***, P < 0.001 using the two-tailed unpaired Student t test. Eight tumors were used for each treatment group. The experiment was performed once with T12 primary tumors and twice with 2208 L primary tumors. K, Representative IHC images of tumor sections stained for CD8α and Foxp3; bar, 80 μm. Quantifications of positive area of tumor sections with ImageJ using the geometric mean of up to 3 representative images from each tumor section, with n = 3–4 tumor sections for each experimental group. Error bars represent SD, *, P < 0.05; **, P< 0.01; ***, P < 0.001 using the two-tailed unpaired Student t test.
Figure 5.
Malat1 inhibition increases T-cell infiltration in the TME. A, Gating strategy used to identify cytotoxic CD8+ T cells and regulatory CD4+ T cells in the TILs of 2208 L tumors using FlowJo 10.8.1. B–J, Flow cytometry quantification of T cells as the percentage of CD45+ populations in 2208 L and T12 tumors using GraphPad Prism 9.4.1. Error bars represent standard deviation (SD), *, P < 0.05; **, P < 0.01; ***, P < 0.001 using the two-tailed unpaired Student t test. Eight tumors were used for each treatment group. The experiment was performed once with T12 primary tumors and twice with 2208 L primary tumors. K, Representative IHC images of tumor sections stained for CD8α and Foxp3; bar, 80 μm. Quantifications of positive area of tumor sections with ImageJ using the geometric mean of up to 3 representative images from each tumor section, with n = 3–4 tumor sections for each experimental group. Error bars represent SD, *, P < 0.05; **, P< 0.01; ***, P < 0.001 using the two-tailed unpaired Student t test.
Figure 6. Malat1 inhibition in T cells increases proliferation and cell cytotoxicity. A, qPCR analysis of RNA extracted from T cells isolated from splenocytes from a WT BALB/c mouse cultured in vitro for 3–5 days in 500 nmol/L of Scramble/Malat1 ASO display significant decrease of Malat1 expression in the Malat1 ASO treatment group. Relative fold change based on Gapdh RNA level. Experimental n = 3. Error bars represent standard deviation (SD). ****, P < 0.0001 using the two-tailed unpaired Student t test. B, Representative proliferation plot of T cells isolated from splenocytes from a WT BALB/c mouse stained with CFSE and activated with CD3/CD28 Dynabeads for 72 hours. C–E, Flow cytometry quantification of CD8+, Granzyme B+ and Perforin+ T cells after 3 and 5 days. Data are representative of at least 2 independent experiments. Error bars represent SD. *, P < 0.05; **, P < 0.01 using the multiple Student t tests and the Holm–Šídák method for multiple comparisons. F, Representative Incucyte images of T cells isolated from the splenocytes of a WT JEDI mouse and GFP-labeled T12 tumor cell line at a 1:1 and 5:1 E:T ratio; scale bar, 800 μm. Image was taken at 0 and 48 hours. Experimental n = 3. G, Flow cytometry quantification of residual Annexin V+ tumor cells at the 1:1 effector ratio. Error bars represent SD. *, P < 0.05 using the two-tailed unpaired Student t test. H, Remaining GFP signal of 5:1 T-cell:tumor cell cocultures. The percentage was calculated by dividing the total green object integrated intensity (GCU x μm2/image) at 48 hours by the starting green object–integrated intensity (GCU × μm2/image) × 100. GFP signal calculated using Incucyte S3. Error bars represent SD, **, P < 0.01 using the two-tailed unpaired Student t test. I and J, Flow cytometry quantification of Granzyme B+ and Perforin+ T cells after 48 hours. Error bars represent SD. *, P < 0.05; **, P < 0.01, using the multiple Student t tests and the Holm–Šídák method for multiple comparisons. J, Heat map of cytokine/chemokine array of supernatant collected from cocultures with Malat1-depleted Jedi T cells.
Figure 6.
Malat1 inhibition in T cells increases proliferation and cell cytotoxicity. A, qPCR analysis of RNA extracted from T cells isolated from splenocytes from a WT BALB/c mouse cultured in vitro for 3–5 days in 500 nmol/L of Scramble/Malat1 ASO display significant decrease of Malat1 expression in the Malat1 ASO treatment group. Relative fold change based on Gapdh RNA level. Experimental n = 3. Error bars represent standard deviation (SD). ****, P < 0.0001 using the two-tailed unpaired Student t test. B, Representative proliferation plot of T cells isolated from splenocytes from a WT BALB/c mouse stained with CFSE and activated with CD3/CD28 Dynabeads for 72 hours. C–E, Flow cytometry quantification of CD8+, Granzyme B+ and Perforin+ T cells after 3 and 5 days. Data are representative of at least 2 independent experiments. Error bars represent SD. *, P < 0.05; **, P < 0.01 using the multiple Student t tests and the Holm–Šídák method for multiple comparisons. F, Representative Incucyte images of T cells isolated from the splenocytes of a WT JEDI mouse and GFP-labeled T12 tumor cell line at a 1:1 and 5:1 E:T ratio; scale bar, 800 μm. Image was taken at 0 and 48 hours. Experimental n = 3. G, Flow cytometry quantification of residual Annexin V+ tumor cells at the 1:1 effector ratio. Error bars represent SD. *, P < 0.05 using the two-tailed unpaired Student t test. H, Remaining GFP signal of 5:1 T-cell:tumor cell cocultures. The percentage was calculated by dividing the total green object integrated intensity (GCU x μm2/image) at 48 hours by the starting green object–integrated intensity (GCU × μm2/image) × 100. GFP signal calculated using Incucyte S3. Error bars represent SD, **, P < 0.01 using the two-tailed unpaired Student t test. I and J, Flow cytometry quantification of Granzyme B+ and Perforin+ T cells after 48 hours. Error bars represent SD. *, P < 0.05; **, P < 0.01, using the multiple Student t tests and the Holm–Šídák method for multiple comparisons. J, Heat map of cytokine/chemokine array of supernatant collected from cocultures with Malat1-depleted Jedi T cells.
Figure 7. Combination of Malat1 ASO with chemotherapy or ICB improves response in preclinical mouse models. A, Experimental design of combination treatment studies. WT BALB/c mice had 2208 L tumor pieces implanted into the mammary fat pad and were treated with either 25 mg/kg carboplatin and ASO or 10 mg/kg anti-PD1 and ASO, once tumor was palpable (≤50 mm3). B, Tumor growth curves of 2208 L tumors treated with single-agent carboplatin (n = 9) or in combination with Malat1 ASO (n = 9) and comparison of tumor weight after harvest. *, P < 0.05 using mixed effects analysis to account for missing values that occurred when mouse reached ethical endpoint, with the Sidak multiple comparisons test for tumor volumes. The two-tailed unpaired Student t test was used for tumor weights. C, Tumor growth curves of 2208 L tumors treated with single-agent anti-PD1 (n = 9) or in combination with Malat1 ASO (n = 9) and comparison of tumor weight after harvest. *, P < 0.05 using mixed effects analysis with the Sidak multiple comparisons test for tumor volumes and the two-tailed unpaired Student t test for tumor weights. D and E, Kaplan–Meier survivor curves of tumors that reach ethical endpoint (≥1,500 mm3). *, P < 0.05 using a log-rank (Mantel–Cox) test. F–I, Flow cytometry quantification of T cells isolated from single-agent carboplatin (n = 8) and combination of carboplatin and Malat1 ASO (n = 8) as the percentage of CD3+ populations using GraphPad Prism 9.4.1. Error bars represent standard deviation (SD). *, P < 0.05; **, P < 0.01; ***, P < 0.001 using the two-tailed unpaired Student t test. J–M, Flow cytometry quantification of T cells isolated from IgG control (n = 3) single-agent anti-PD1 (n = 5) and combination anti-PD1 and Malat1 ASO (n = 5) as the percentage of CD3+ populations using GraphPad Prism 9.4.1. Error bars represent SD. *, P < 0.05; **, P < 0.01; ***, P < 0.001; ****, P < 0.0001 using one-way ANOVA and Dunnett's multiple comparisons test with an adjusted P value for multiple comparison.
Figure 7.
Combination of Malat1 ASO with chemotherapy or ICB improves response in preclinical mouse models. A, Experimental design of combination treatment studies. WT BALB/c mice had 2208 L tumor pieces implanted into the mammary fat pad and were treated with either 25 mg/kg carboplatin and ASO or 10 mg/kg anti-PD1 and ASO, once tumor was palpable (≤50 mm3). B, Tumor growth curves of 2208 L tumors treated with single-agent carboplatin (n = 9) or in combination with Malat1 ASO (n = 9) and comparison of tumor weight after harvest. *, P < 0.05 using mixed effects analysis to account for missing values that occurred when mouse reached ethical endpoint, with the Sidak multiple comparisons test for tumor volumes. The two-tailed unpaired Student t test was used for tumor weights. C, Tumor growth curves of 2208 L tumors treated with single-agent anti-PD1 (n = 9) or in combination with Malat1 ASO (n = 9) and comparison of tumor weight after harvest. *, P < 0.05 using mixed effects analysis with the Sidak multiple comparisons test for tumor volumes and the two-tailed unpaired Student t test for tumor weights. D and E, Kaplan–Meier survivor curves of tumors that reach ethical endpoint (≥1,500 mm3). *, P < 0.05 using a log-rank (Mantel–Cox) test. F–I, Flow cytometry quantification of T cells isolated from single-agent carboplatin (n = 8) and combination of carboplatin and Malat1 ASO (n = 8) as the percentage of CD3+ populations using GraphPad Prism 9.4.1. Error bars represent standard deviation (SD). *, P < 0.05; **, P < 0.01; ***, P < 0.001 using the two-tailed unpaired Student t test. J–M, Flow cytometry quantification of T cells isolated from IgG control (n = 3) single-agent anti-PD1 (n = 5) and combination anti-PD1 and Malat1 ASO (n = 5) as the percentage of CD3+ populations using GraphPad Prism 9.4.1. Error bars represent SD. *, P < 0.05; **, P < 0.01; ***, P < 0.001; ****, P < 0.0001 using one-way ANOVA and Dunnett's multiple comparisons test with an adjusted P value for multiple comparison.

Similar articles

Cited by

References

    1. Bergmann JH, Spector DL. Long non-coding RNAs: modulators of nuclear structure and function. Curr Opin Cell Biol 2014;26:10–8. - PMC - PubMed
    1. Khalil AM, Guttman M, Huarte M, Garber M, Raj A, Rivea Morales D, et al. . Many human large intergenic non-coding RNAs associate with chromatin-modifying complexes and affect gene expression. Proc Natl Acad Sci USA 2009;106:11667–72. - PMC - PubMed
    1. Lai F, Orom UA, Cesaroni M, Beringer M, Taatjes DJ, Blobel GA, et al. . Activating RNAs associate with Mediator to enhance chromatin architecture and transcription. Nature 2013;494:497–501. - PMC - PubMed
    1. Li W, Notani D, Ma Q, Tanasa B, Nunez E, Chen AY, et al. . Functional roles of enhancer RNAs for oestrogen-dependent transcriptional activation. Nature 2013;498:516–20. - PMC - PubMed
    1. Shin VY, Chen J, Cheuk IW-Y, Siu M-T, Ho C-W, Wang X, et al. . Long non-coding RNA NEAT1 confers oncogenic role in triple-negative breast cancer through modulating chemoresistance and cancer stemness. Cell Death Dis 2019;10:270. - PMC - PubMed

Publication types

Substances