

Evaluation of crowdsourced mortality prediction models as a framework for assessing artificial intelligence in medicine
- PMID: 37604111
- PMCID: PMC10746301
- DOI: 10.1093/jamia/ocad159
Evaluation of crowdsourced mortality prediction models as a framework for assessing artificial intelligence in medicine
Erratum in
-
Correction to: Evaluation of crowdsourced mortality prediction models as a framework for assessing artificial intelligence in medicine.J Am Med Inform Assoc. 2024 Nov 1;31(11):2772. doi: 10.1093/jamia/ocae219. J Am Med Inform Assoc. 2024. PMID: 39150868 Free PMC article. No abstract available.
Abstract
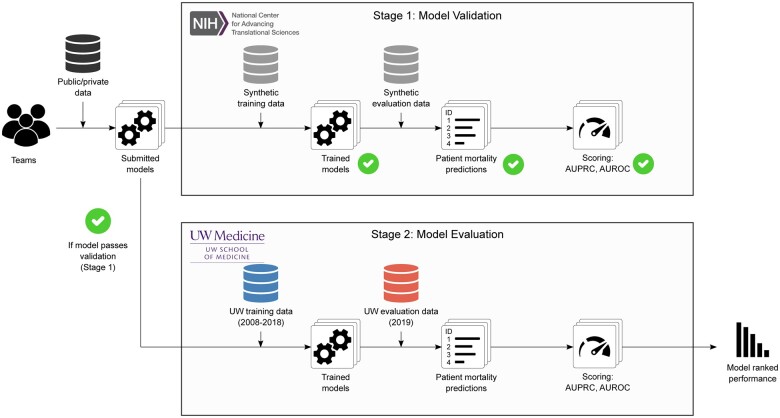
Objective: Applications of machine learning in healthcare are of high interest and have the potential to improve patient care. Yet, the real-world accuracy of these models in clinical practice and on different patient subpopulations remains unclear. To address these important questions, we hosted a community challenge to evaluate methods that predict healthcare outcomes. We focused on the prediction of all-cause mortality as the community challenge question.
Materials and methods: Using a Model-to-Data framework, 345 registered participants, coalescing into 25 independent teams, spread over 3 continents and 10 countries, generated 25 accurate models all trained on a dataset of over 1.1 million patients and evaluated on patients prospectively collected over a 1-year observation of a large health system.
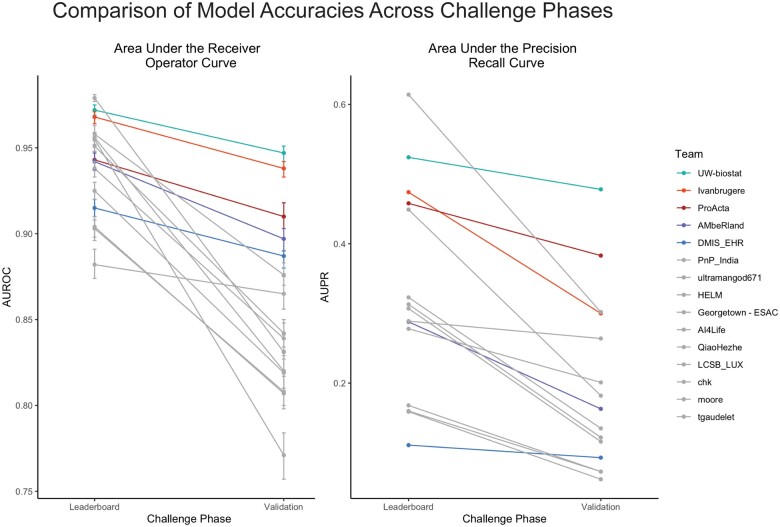
Results: The top performing team achieved a final area under the receiver operator curve of 0.947 (95% CI, 0.942-0.951) and an area under the precision-recall curve of 0.487 (95% CI, 0.458-0.499) on a prospectively collected patient cohort.
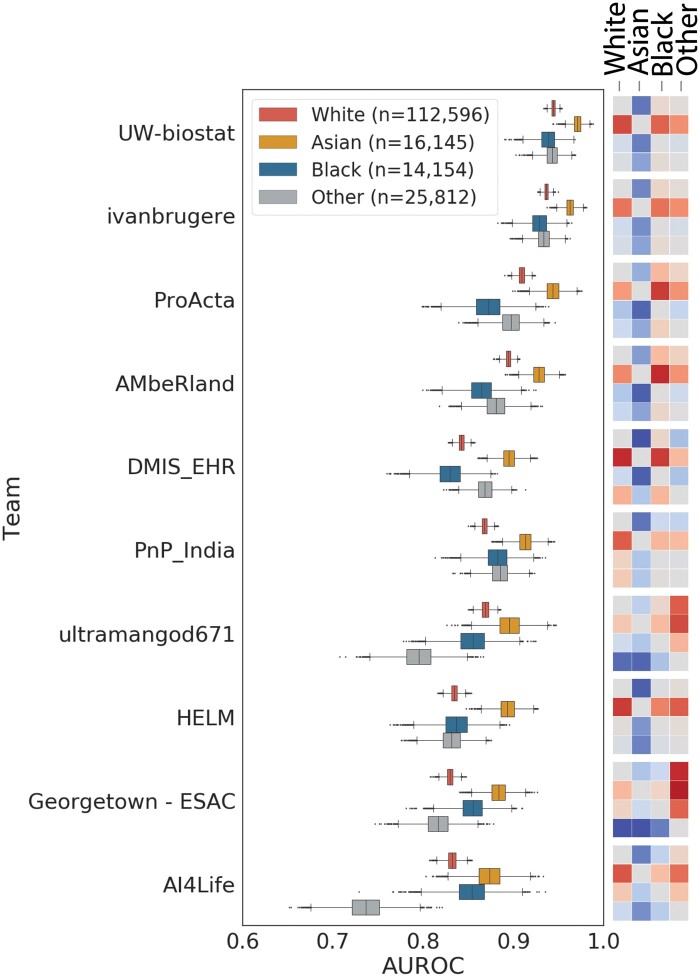
Discussion: Post hoc analysis after the challenge revealed that models differ in accuracy on subpopulations, delineated by race or gender, even when they are trained on the same data.
Conclusion: This is the largest community challenge focused on the evaluation of state-of-the-art machine learning methods in a healthcare system performed to date, revealing both opportunities and pitfalls of clinical AI.
Keywords: evaluation; health informatics; machine learning.
© The Author(s) 2023. Published by Oxford University Press on behalf of the American Medical Informatics Association. All rights reserved. For permissions, please email: journals.permissions@oup.com.
Conflict of interest statement
None declared.
Figures
References
-
- Hammarlund N. Racial treatment disparities after machine learning surgical risk-adjustment. Health Serv Outcomes Res Method. 2021;21(2):248-286.
Publication types
MeSH terms
Grants and funding
LinkOut - more resources
Full Text Sources
