

An in vitro assay to investigate venom neurotoxin activity on muscle-type nicotinic acetylcholine receptor activation and for the discovery of toxin-inhibitory molecules
- PMID: 37604290
- PMCID: PMC10570928
- DOI: 10.1016/j.bcp.2023.115758
An in vitro assay to investigate venom neurotoxin activity on muscle-type nicotinic acetylcholine receptor activation and for the discovery of toxin-inhibitory molecules
Abstract
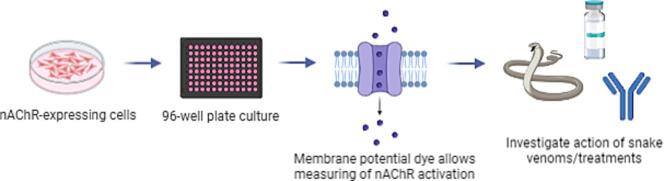
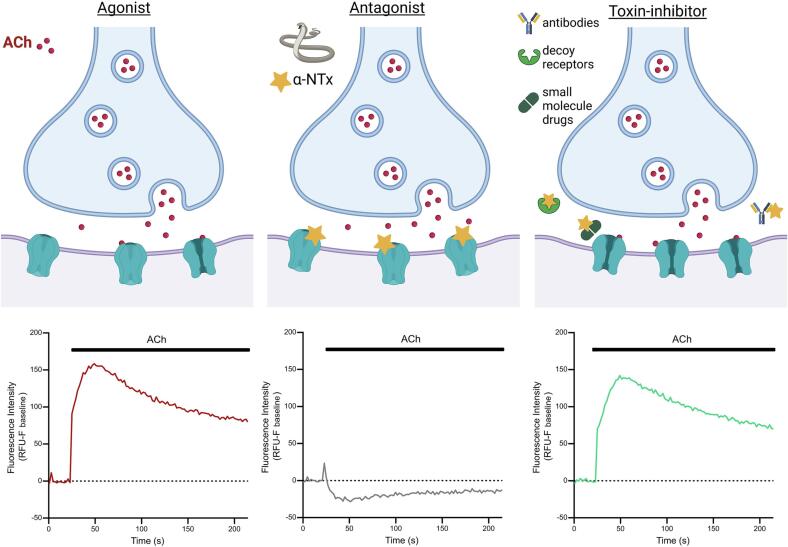
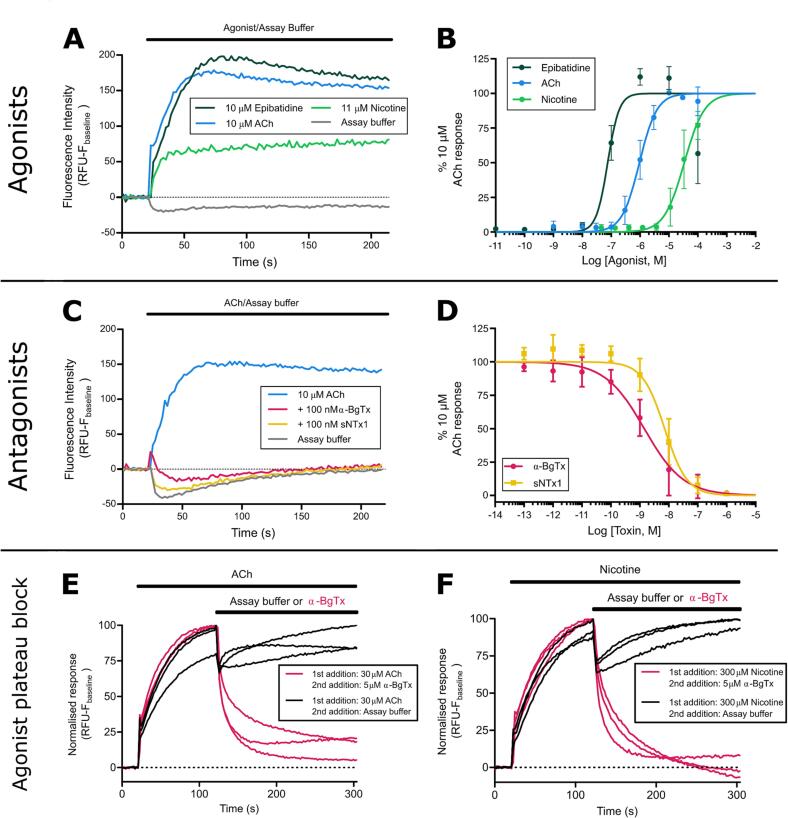
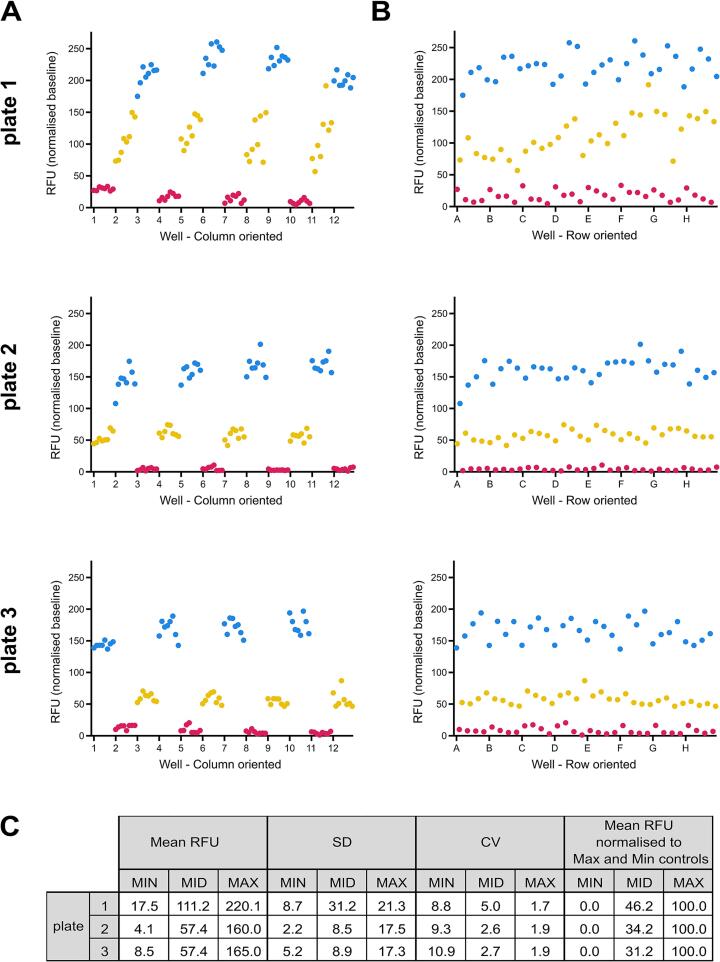
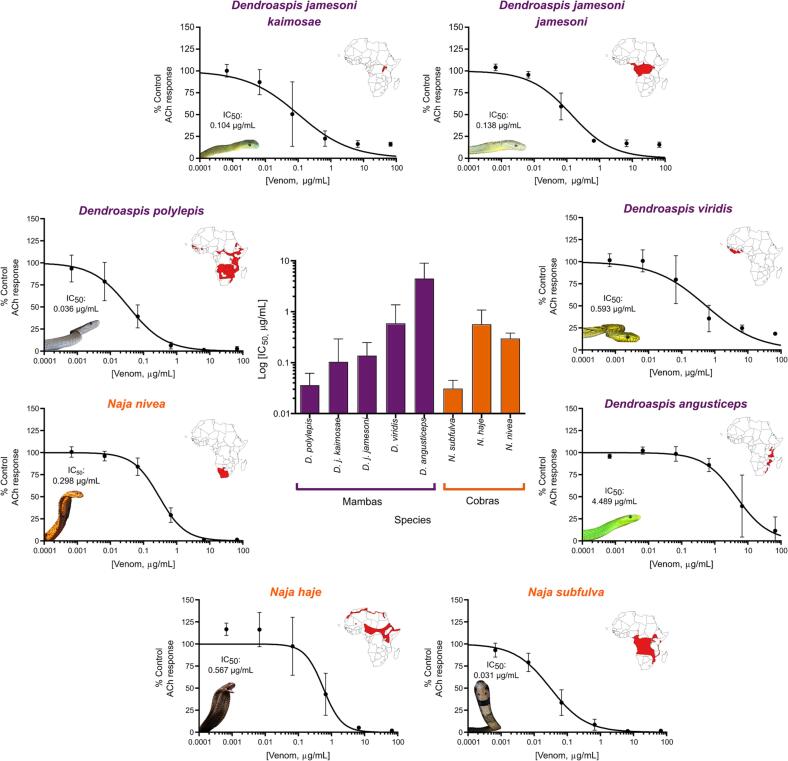
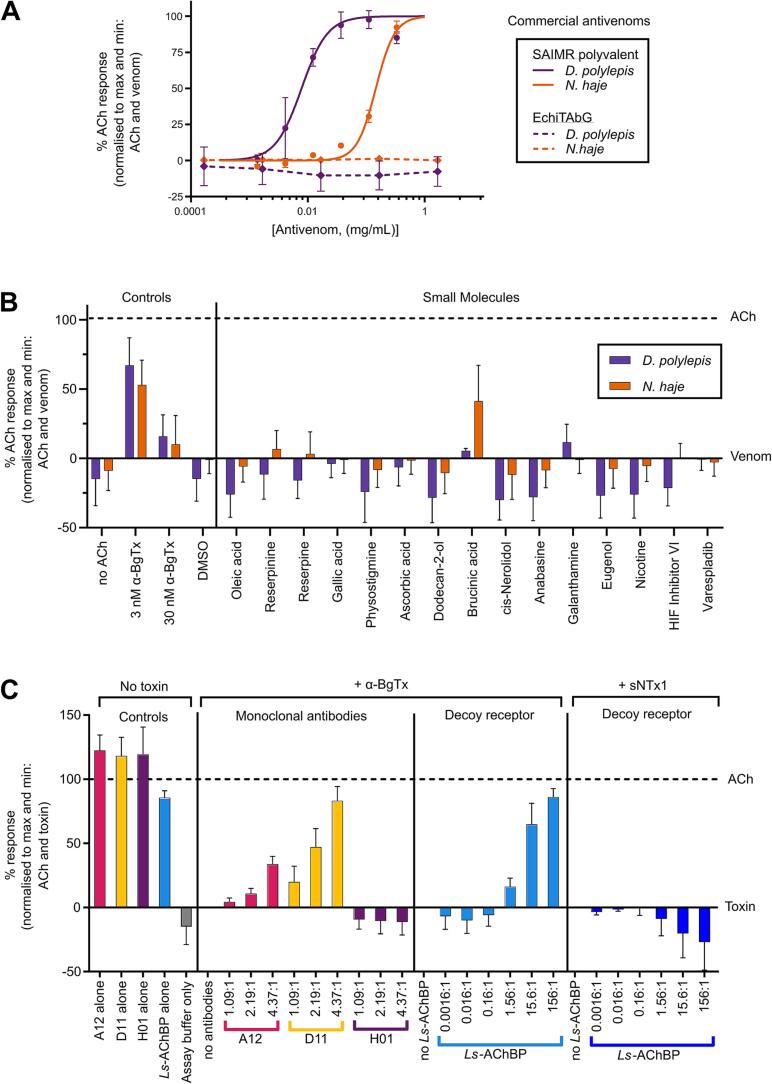
Snakebite envenoming is a neglected tropical disease that causes over 100,000 deaths annually. Envenomings result in variable pathologies, but systemic neurotoxicity is among the most serious and is currently only treated with difficult to access and variably efficacious commercial antivenoms. Venom-induced neurotoxicity is often caused by α-neurotoxins antagonising the muscle-type nicotinic acetylcholine receptor (nAChR), a ligand-gated ion channel. Discovery of therapeutics targeting α-neurotoxins is hampered by relying on binding assays that do not reveal restoration of receptor activity or more costly and/or lower throughput electrophysiology-based approaches. Here, we report the validation of a screening assay for nAChR activation using immortalised TE671 cells expressing the γ-subunit containing muscle-type nAChR and a fluorescent dye that reports changes in cell membrane potential. Assay validation using traditional nAChR agonists and antagonists, which either activate or block ion fluxes, was consistent with previous studies. We then characterised antagonism of the nAChR by a variety of elapid snake venoms that cause muscle paralysis in snakebite victims, before defining the toxin-inhibiting activities of commercial antivenoms, and new types of snakebite therapeutic candidates, namely monoclonal antibodies, decoy receptors, and small molecules. Our findings show robust evidence of assay uniformity across 96-well plates and highlight the amenability of this approach for the future discovery of new snakebite therapeutics via screening campaigns. The described assay therefore represents a useful first-step approach for identifying α-neurotoxins and their inhibitors in the context of snakebite envenoming, and it should provide wider value for studying modulators of nAChR activity from other sources.
Keywords: Antibody discovery; Antivenom; Drug discovery; Snake venom neurotoxin; Three-finger toxin; nicotinic acetylcholine receptor (nAChR); α-neurotoxins.
Copyright © 2023 The Authors. Published by Elsevier Inc. All rights reserved.
Conflict of interest statement
Declaration of Competing Interest The authors declare that they have no known competing financial interests or personal relationships that could have appeared to influence the work reported in this paper.
Figures
Similar articles
-
An in vitro α-neurotoxin-nAChR binding assay correlates with lethality and in vivo neutralization of a large number of elapid neurotoxic snake venoms from four continents.PLoS Negl Trop Dis. 2020 Aug 28;14(8):e0008581. doi: 10.1371/journal.pntd.0008581. eCollection 2020 Aug. PLoS Negl Trop Dis. 2020. PMID: 32857757 Free PMC article.
-
Pharmacological characterization of α-elapitoxin-Al2a from the venom of the Australian pygmy copperhead (Austrelaps labialis): an atypical long-chain α-neurotoxin with only weak affinity for α7 nicotinic receptors.Biochem Pharmacol. 2012 Sep 15;84(6):851-63. doi: 10.1016/j.bcp.2012.06.024. Epub 2012 Jul 4. Biochem Pharmacol. 2012. PMID: 22771828
-
Snake three-finger α-neurotoxins and nicotinic acetylcholine receptors: molecules, mechanisms and medicine.Biochem Pharmacol. 2020 Nov;181:114168. doi: 10.1016/j.bcp.2020.114168. Epub 2020 Jul 23. Biochem Pharmacol. 2020. PMID: 32710970 Review.
-
A Decoy-Receptor Approach Using Nicotinic Acetylcholine Receptor Mimics Reveals Their Potential as Novel Therapeutics Against Neurotoxic Snakebite.Front Pharmacol. 2019 Jul 30;10:848. doi: 10.3389/fphar.2019.00848. eCollection 2019. Front Pharmacol. 2019. PMID: 31417406 Free PMC article.
-
A Review of the Proteomic Profiling of African Viperidae and Elapidae Snake Venoms and Their Antivenom Neutralisation.Toxins (Basel). 2022 Oct 22;14(11):723. doi: 10.3390/toxins14110723. Toxins (Basel). 2022. PMID: 36355973 Free PMC article. Review.
Cited by
-
Synthetic development of a broadly neutralizing antibody against snake venom long-chain α-neurotoxins.Sci Transl Med. 2024 Feb 21;16(735):eadk1867. doi: 10.1126/scitranslmed.adk1867. Epub 2024 Feb 21. Sci Transl Med. 2024. PMID: 38381847 Free PMC article.
-
ADDovenom: Thermostable Protein-Based ADDomer Nanoparticles as New Therapeutics for Snakebite Envenoming.Toxins (Basel). 2023 Nov 28;15(12):673. doi: 10.3390/toxins15120673. Toxins (Basel). 2023. PMID: 38133177 Free PMC article.
-
Improving in vivo assays in snake venom and antivenom research: A community discussion.F1000Res. 2024 Mar 15;13:192. doi: 10.12688/f1000research.148223.1. eCollection 2024. F1000Res. 2024. PMID: 38708289 Free PMC article.
-
Metabolomics and proteomics: synergistic tools for understanding snake venom inhibition.Arch Toxicol. 2025 Mar;99(3):915-934. doi: 10.1007/s00204-024-03947-4. Epub 2025 Jan 6. Arch Toxicol. 2025. PMID: 39760869 Review.
-
Towards better antivenoms: navigating the road to new types of snakebite envenoming therapies.J Venom Anim Toxins Incl Trop Dis. 2023 Dec 18;29:e20230057. doi: 10.1590/1678-9199-JVATITD-2023-0057. eCollection 2023. J Venom Anim Toxins Incl Trop Dis. 2023. PMID: 38116472 Free PMC article.
References
-
- Williams D.J., Faiz M.A., Abela-Ridder B., Ainsworth S., Bulfone T.C., Nickerson A.D., Habib A.G., Junghanss T., Fan H.W., Turner M., Harrison R.A., Warrell D.A., Gutiérrez J.M. Strategy for a globally coordinated response to a priority neglected tropical disease: Snakebite envenoming. PLoS Negl. Trop. Dis. 2019;13(2):e0007059. - PMC - PubMed
-
- Ferraz C.R., Arrahman A., Xie C., Casewell N.R., Lewis R.J., Kool J., Cardoso F.C. Multifunctional Toxins in Snake Venoms and Therapeutic Implications: From Pain to Hemorrhage and Necrosis. Front. Ecol. Evol. 2019;7:1–19.
Publication types
MeSH terms
Substances
Grants and funding
LinkOut - more resources
Full Text Sources
