. 2023 Aug 21;14(1):5072.
doi: 10.1038/s41467-023-40514-4.

A mechanistic reinterpretation of fast inactivation in voltage-gated Na+ channels

Affiliations

A mechanistic reinterpretation of fast inactivation in voltage-gated Na+ channels

Yichen Liu et al. Nat Commun. .

Abstract

The hinged-lid model was long accepted as the canonical model for fast inactivation in Nav channels. It predicts that the hydrophobic IFM motif acts intracellularly as the gating particle that binds and occludes the pore during fast inactivation. However, the observation in recent high-resolution structures that the bound IFM motif is located far from the pore, contradicts this preconception. Here, we provide a mechanistic reinterpretation of fast inactivation based on structural analysis and ionic/gating current measurements. We demonstrate that in Nav1.4 the final inactivation gate is comprised of two hydrophobic rings at the bottom of S6 helices. These rings function in series and close downstream of IFM binding. Reducing the volume of the sidechain in both rings leads to a partially conductive, leaky inactivated state and decreases the selectivity for Na+ ion. Altogether, we present an alternative molecular framework to describe fast inactivation.


Conflict of interest statement

The authors declare no competing interests.

Figures

Fig. 1
Fig. 1. Pore radius profiles of NavPas and Nav1.7 show two layers of hydrophobic barriers.
A Structure of NavPas (PDB:6A95). B Structure of Nav1.7 M11 (PDB:7XVF). The IFM motif is highlighted in red. The pore radius was calculated using HOLE. NavPas and Nav1.7 structures show similar pore profiles at the bottom of S6, where two layers of the hydrophobic barrier are identified (shadowed regions). Identified top (extracellular view) and bottom (intracellular view) hydrophobic layers in NavPas and Nav1.7 are shown. In NavPas, the top layer is formed by residues L412 (DI), I737 (DII), V1108 (DIII), A1407 (DIV), and the bottom layer by V416 (DI), L741 (DII), I1112 (DIII), L1411 (DIV). In Nav1.7, the top layer is formed by residues L398 (DI), L964 (DII), I1453 (DIII), I1756 (DIV), and the bottom layer by A402 (DI), L968 (DII), I1457 (DIII), L1760 (DIV). C) Sequence alignments of the S6 region among rNav1.4, Nav1.7, and NavPas. The residues identified to form the narrowest part of the channel were highlighted in cyan for NavPas and purple for Nav1.7, and they are colored in red for rNav1.4.
Fig. 2
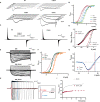
Fig. 2. Double alanine mutation of the identified hydrophobic residues in DIII S6 creates a leaky inactivated state in rNav1.4.
A Sequence alignment of DIII S6 showing identified residues (I1284 and I1288) and their positions in the Nav1.7 structure. B Representative ionic traces for the wild-type (WT), single (I1284A and I1288A), and double alanine (I1284A_I1288A, named DIIIAA) mutations of the identified residues on rNav1.4. The ionic conditions used were 57.5 mM Na+ outside and 12 mM Na+ inside. Inset shows the voltage protocol. WT, N = 4; I1284A N = 5; I1288A, N = 6; DIIIAA, N = 7. C Ratio of steady state current (Iss, black circle) at the end of 30 ms depolarization over the peak current (Ipeak, black square) taken at +60 mV. D Voltage-dependence of inactivation (h—infinity curve) for WT (black), I1284A (green), I1288A (blue), and DIIIAA (red). Inset shows the voltage protocol. The lines represent the fit to a two-state model (Eq. 1). WT, N = 8; I1284A, N = 6, I1288A, N = 6; DIIIAA, N = 4. E, F Representative traces of gating current for WT (E) and DIIIAA (F). Inset shows the voltage protocol. The black square top inset shows the comparison of the normalized gating current after 0.5 ms and 23 ms depolarization pulse. G Fraction of immobilized charge vs. depolarization time for WT (black) and DIIIAA mutant (red). The inset illustrates the method used for the determination of the off-gating components using exponential fitting (Detailed in methods). WT, N = 4; DIIIAA, N = 4. H DIIIAA currents in response to a depolarized voltage step to +60 mV with variable duration followed by a hyperpolarized voltage step to −80 mV. The inset shows the normalized tail currents at 3 depolarization times. I Weighted tail currents time constant vs. depolarization time for DIIIAA mutant, fitted with two-component exponential association (Details in methods), N = 4. J Comparison of the fast time constant of the slowing down of the tail current and the fast time constant of fast inactivation at +60 mV, N = 4 for both measurements. No significant difference was found (unpaired t-test with two-sided Welch’s correction, p > 0.5). The whisk shows the maxima and minima, the center shows the mean, and the box shows the 25th to 75th percentiles. All data are shown as mean ± SEM.
Fig. 3
Fig. 3. Time-dependent selectivity changes in DIIIAA.
DIIIAA currents at different voltages (range shown on top) using 57.5 mM external Na+ (A), N = 3, 90 mM external Na+ (B), N = 3 or 120 mM external K+ (C), N = 2 with 120 mM internal K+; on the right IV curves for the peak (red) and steady state (blue) current. The reversal potential for each component is denoted with a corresponding dashed line. D Instantaneous IV protocol obtained at different times during depolarization. E Example of the changes in direction for the tail currents. F Example instantaneous IV curves after a 0.6 (red), 1 (blue), 5 (green), and 20 (black) milliseconds depolarization times of a single oocyte. The solid lines represent a linear fit used to obtain the reversal potential (indicated by vertical dashed lines). G Relative Na+/K+ permeability vs. time for DIIIAA under different ionic conditions (red, 57.5 mM Na+ external and green, N = 4, 90 mM Na+ external concentration, N = 3). Internal solution 120 mM K+. The dashed line shows the WT permeability, and solid lines represent a two-component exponential fit to obtain the time constants. H Fast time constants for the change in selectivity (DIIIAA Tauperm, N = 6) and fast inactivation time constants obtained from the ionic current at +60 mV (DIIIAA TauFI, N = 4) show no significant difference (unpaired t-test with two-sided Welch’s correction, p > 0.5). The whisk shows the maxima and minima, the center shows the mean, and the box shows the 25th to 75th percentiles. Data are shown as mean ± SEM.
Fig. 4
Fig. 4. Preventing IFM binding avoids the DIIIAA phenotypes.
A Example traces of WT, I1284A, I1288A, and DIIIAA. Early current in DIIIAA developed in more hyperpolarized voltages and showed no clear fast inactivation. B GV curves for WT (black dashed line), I1284A (green), I1288A (blue), and DIIIAA (red). GV curves were calculated from the peak for WT, I1284A and I1288A, whereas for DIIIAA it was calculated from the steady state currents (WT, N = 4; I1284A, N = 4; I1288A. N = 6; DIIIAA, N = 4). C Representative gating current traces for WT and DIIIAA. Inset is the voltage protocol. D QV curves for WT (black, N = 6) and DIIIAA (red, N = 6). The dashed lines indicate the corresponding GV curves. E Representative ionic current traces for IQM and IQM_DIIIAA. F GV curves for IQM (green, N = 4) and IQM_DIIIAA (orange, N = 4). Dashed lines show the WT and DIIIAA for comparison. G IQM_DIIIAA IV curves for the peak (red N = 4) and steady state (blue, N = 4) current. The reversal potential for each component is denoted with a corresponding dashed line. H IQM_DIIIAA currents in response to a depolarized voltage step to +60 mV with variable duration followed by a hyperpolarized voltage step to −80 mV. The inset shows the normalized tail currents at 3 different depolarization times. I Weighted tail currents time constant vs. depolarization time for IQM_DIIIAA (red points, N = 5) compared to DIIIAA (dashed line, N = 4). Data are shown as mean ± SEM.
Fig. 5
Fig. 5. Double Alanine mutations in DIV also produced a leaky inactivated state.
A Sequence alignment of DIV S6 showing identified residues (I1587 and L1591, highlighted in red) and their respective positions in the Nav1.7 structure. B Representative ionic traces for single (I1587A and L1591A) and double alanine (I1587A_L1591A—DIVAA) mutations. The ionic conditions used were 57.5 mM Na+ outside and 12 mM Na+ inside. C Ratio of steady state current (Iss) at the end of depolarization over the peak current (Ipeak) taken at +60 mV. WT, N = 4; I1587A, N = 5; L1591A, N = 6; DIVAA, N = 5. D Voltage-dependence of inactivation (h—infinity curve) for WT (black, N = 8), I1587A (green, N = 5), L1591A (blue, N = 5), and DIVAA (red, N = 8). E Representative gating current traces for charge immobilization measurements for DIVAA. F Fraction of immobilized charge vs. depolarization time for WT (black, N = 4) and DIVAA mutant (red, N = 7). G Representative ionic currents trace in bi-ionic environment. H IV curves for the peak (red, N = 5) and steady state (blue, N = 5) current for DIVAA. The reversal potential for each component is denoted with the corresponding dashed line. I Relative Na+/K+ permeability vs. time for DIVAA (57.5 mM Na+ external and 120 mM K+ internal, N = 4). Dashed gray and blue lines show the WT and DIIIAA permeability, respectively. The solid red line represents an exponential fit to obtain the time constant. J Fast time constants for the change in selectivity (DIVAA Tauperm, N = 4) and fast inactivation time constant obtained from the ionic current at +60 mV (DIVAA TauFI, N = 5) show no significant difference (unpaired t-test with two-sided Welch’s correction, p > 0.5). The whisk shows the maxima and minima, the center shows the mean, and the box shows the 25th to 75th percentiles. Data are shown as mean ± SEM.
Fig. 6
Fig. 6. Quadruple alanine mutation of the identified residues in DIII & DIV S6 enhanced the phenotype seen in DIIIAA and DIVAA.
A Sequence alignment of DIII, DIV S6 showing identified residues (highlighted in red) and their positions in the Nav1.7 structure. B Representative current traces elicited at different voltages (−10 to 40 mV) for the quadruple alanine mutation (I1284A_I1288A_I1587A_L1591A, DIII_IVAA) in 57.5 mM external Na+ and 120 mM internal K+. C IV curves for the peak (red, N = 4) and steady state (blue, N = 4) current. The reversal potential for each component is denoted with a corresponding dashed line. D h—infinity curve for DIII_IVAA (green), DIIIAA (red), and DIVAA (blue). E Relative Na+/K+ permeability vs. time for DIII_IVAA (57.5 mM Na+ external and 120 mM K+ internal). Dashed gray, blue, and red lines show the WT, DIIIIAA and DIVAA permeability, respectively. The solid green line represents an exponential fit to obtain the time constant. Data are shown as mean ± SEM.
Fig. 7
Fig. 7. Effects of alanine mutations in DI and DII S6 are different from the ones in DIII and DIV S6.
A Top: sequence alignment of DI and DII S6 showing identified residues (L437 and A441 in DI, L792 and L796 in DII, highlighted in red) and their positions in the Nav1.7 structure. B Representative ionic traces for L437A. The ionic conditions used were 57.5 mM Na+ outside and 12 mM Na+ inside. C GV curves for WT (black dashed line, N = 4) and L437A (red, N = 8). GV curves were calculated from the peak. D h—infinity curve for WT (black, N = 4) and L437A (red, N = 4). E Representative current traces for L792A_L796A (DIIAA). The ionic conditions used were 57.5 mM Na+ outside and 12 mM Na+ inside. F Details of DIIAA gating and ionic current components. The red and blue shadowing indicates the presence of gating and ionic currents, respectively. G Current from DIIAA collected before (black trace) and after (red) external application of TTX. Data are shown as mean ± SEM.
Fig. 8
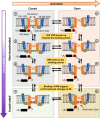
Fig. 8. A general model for fast inactivation from open or closed states.
For simplicity, the multi-step activation is shown as a single transition between the last closed state and the open state in the horizontal direction (rightward), and vertical transitions represent the fast inactivation pathway (downward). ① represents the Nav channel in the last closed state. ② represents the channel with the VSD of DI–DIII in the active (up) position, DIV VSD in the resting (down) position, and a conducting pore: an open channel. Transitions from ① to ③ and ② to ④ occur when DIV VSD moves up, exposing the binding pocket for the IFM motif outside the pore region. Once the binding pocket becomes available, the IFM motif binds and transitions from ③ to ⑤ and ④ to ⑥ occur. The binding of the IFM motif triggers conformational changes that are conducted to the pore region closing the two-layered fast inactivation gate, leading to the closed inactivated state in ⑦ or the open inactivated state in ⑧. Please note that DIII VSD is also involved, and this diagram aims to provide a simplified general model for the fast inactivation process.

Update of

Similar articles

Cited by

References

    1. Hille, B. Ion Channels of Excitable Membranes. 3rd ed. (Sinauer Associates, 2001).
    1. Noda M, et al. Primary structure of Electrophorus electricus sodium channel deduced from cDNA sequence. Nature. 1984;312:121–127. - PubMed
    1. Hodgkin AL, Huxley AF. A quantitative description of membrane current and its application to conduction and excitation in nerve. J. Physiol. 1952;117:500–544. - PMC - PubMed
    1. Hodgkin AL, Huxley AF. The components of membrane conductance in the giant axon of Loligo. J. Physiol. 1952;116:473–496. - PMC - PubMed
    1. Hodgkin AL, Huxley AF. Currents carried by sodium and potassium ions through the membrane of the giant axon of Loligo. J. Physiol. 1952;116:449–472. - PMC - PubMed

Publication types