. 2023 Aug 21;14(1):5073.
doi: 10.1038/s41467-023-40517-1.

Linking emotional valence and anxiety in a mouse insula-amygdala circuit

Affiliations

Linking emotional valence and anxiety in a mouse insula-amygdala circuit

C Nicolas et al. Nat Commun. .

Abstract

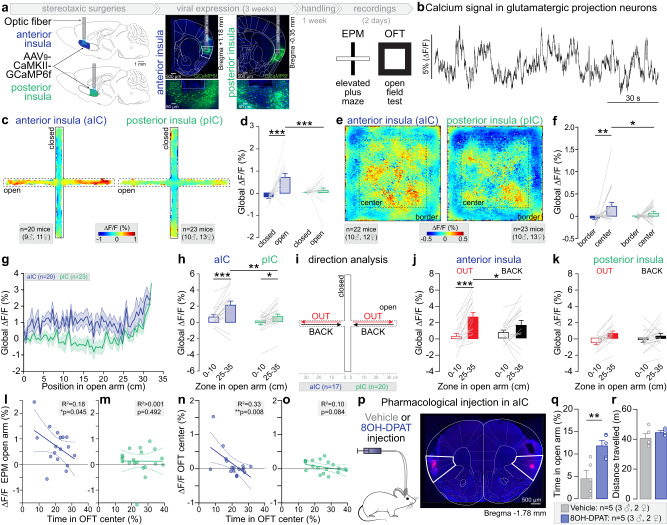
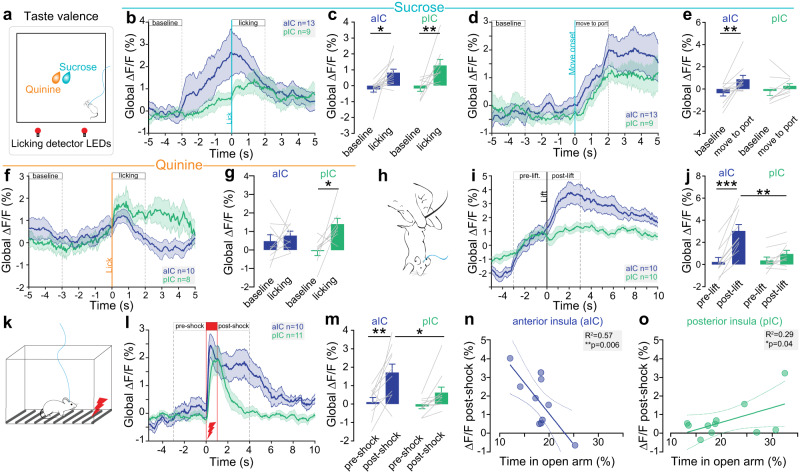
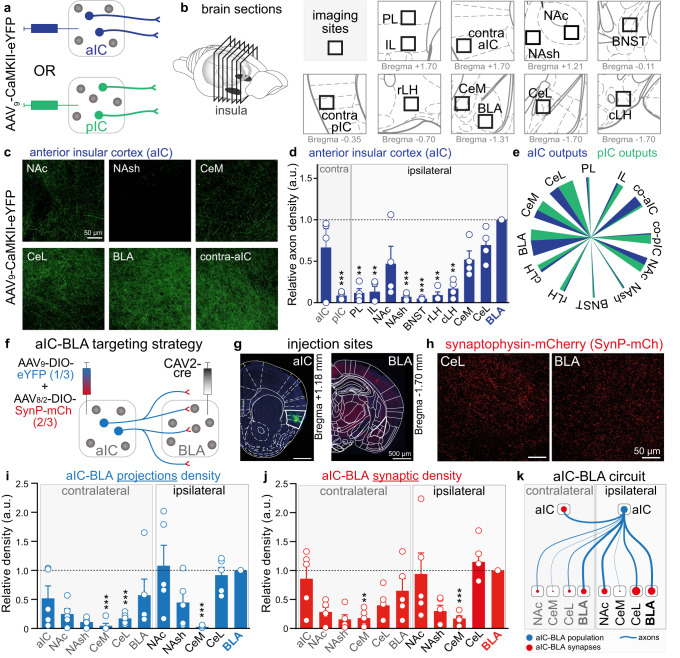
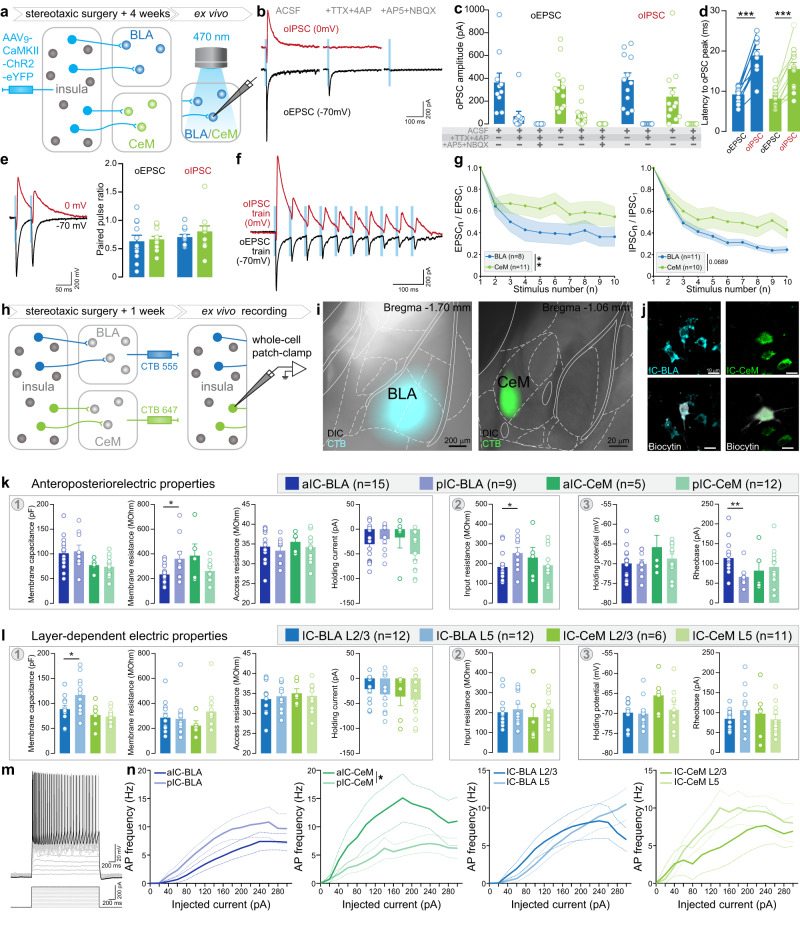
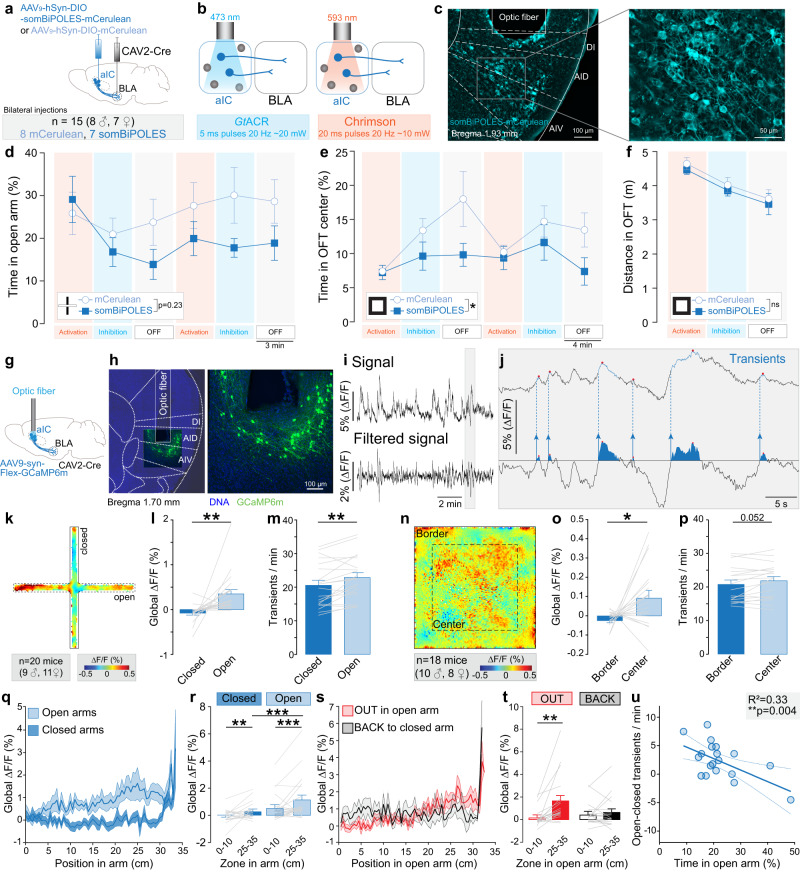
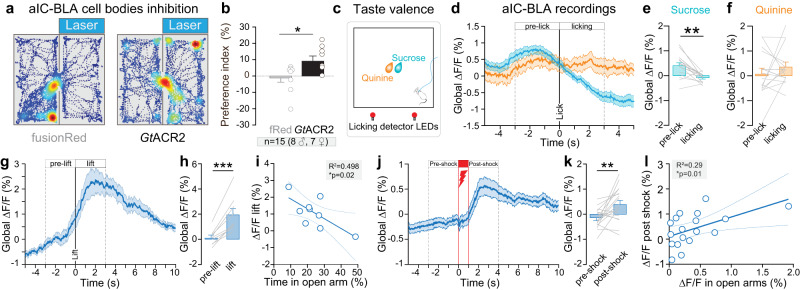
Responses of the insular cortex (IC) and amygdala to stimuli of positive and negative valence are altered in patients with anxiety disorders. However, neural coding of both anxiety and valence by IC neurons remains unknown. Using fiber photometry recordings in mice, we uncover a selective increase of activity in IC projection neurons of the anterior (aIC), but not posterior (pIC) section, when animals are exploring anxiogenic spaces, and this activity is proportional to the level of anxiety of mice. Neurons in aIC also respond to stimuli of positive and negative valence, and the strength of response to strong negative stimuli is proportional to mice levels of anxiety. Using ex vivo electrophysiology, we characterized the IC connection to the basolateral amygdala (BLA), and employed projection-specific optogenetics to reveal anxiogenic properties of aIC-BLA neurons. Finally, we identified that aIC-BLA neurons are activated in anxiogenic spaces, as well as in response to aversive stimuli, and that both activities are positively correlated. Altogether, we identified a common neurobiological substrate linking negative valence with anxiety-related information and behaviors, which provides a starting point to understand how alterations of these neural populations contribute to psychiatric disorders.


Conflict of interest statement

The authors declare that they do not have any competing interests or conflicts of interest (financial or non-financial) related to the material presented in this manuscript.

Figures

Fig. 1
Fig. 1. Anxiety-related activity in aIC and pIC glutamatergic neurons.
a Strategy to record aIC or pIC glutamatergic neurons expressing GCaMP6f through a fiber implant. Representative confocal images of aIC and pIC neurons expressing GCaMP6f (in green). b Bulk GCaMP6f signal recorded from aIC glutamatergic neurons. ∆F/F represents the fluorescence changes from the mean level of the entire recording time series. c Averaged heat map of the calcium signal recorded from aIC and pIC neurons during 15 min of EPM test. d Average calcium signal recorded in aIC (n = 20 mice) and pIC (n = 22 mice) glutamatergic neurons in open and closed arms of the EPM (Two-way ANOVA, F(1,41) = 9.59, **p = 0.004 for the brain region (aIC, pIC), F(1,41) = 22.07, ***p < 0.001 for the zone (arms), F(1,41) = 13.19, ***p = 0.0008 for region×zone interaction). The calcium signal is higher when mice are in the open compared to closed arms for aIC neurons (Bonferroni test ***p < 0.0001) and is higher for aIC than pIC neurons when mice are in the open arms (Bonferroni test ***p < 0.001). e Averaged heat map of the calcium signal recorded from aIC or pIC neurons during the OFT test. f Average calcium signal recorded in aIC (n = 22 mice) and pIC (n = 23 mice) glutamatergic neurons in the OFT border and center (Two-way ANOVA, F(1,43) = 11.36, **p = 0.002 for the zone (arms), without effect of the brain region (aIC, pIC), and no interaction). The calcium signal in aIC neurons is higher when mice are in the center compared to the border (Bonferroni test ***p = 0.002), and is higher in aIC than pIC when mice are in the center (Bonferroni test *p = 0.043). g Average calcium signal recorded from aIC (n = 20 mice) and pIC (n = 23 mice) depending on the mice position in open arms of the EPM. h For both aIC and pIC neurons, the average calcium signal is higher when mice are at the end (25–35 cm) compared to the beginning (0–10 cm) of the open arms (Two-way ANOVA, F(1,37) = 29.60, ***p < 0.0001 for the position, F(1,37) = 9.11, **p = 0.005 for the brain region, without interaction; Bonferroni test for aIC ***p < 0.0001 and pIC *p = 0.015). The average calcium signal is higher in aIC than pIC neurons when mice are at the end of the open arms (Bonferroni test **p = 0.002, n = 18 mice for aIC, n = 21 mice for pIC). i Calcium signal analysis during open arm exploration (OUT) and retreat (BACK) in the EPM. j In aIC neurons, the calcium signal is higher when mice are at the end compared to the beginning of the open arms, only for the OUT direction (n = 17 mice, Two-way ANOVA, F(1,16) = 19.69, ***p = 0.004 for the position in the open arms, without effect of the direction and F(1,16) = 8.94, **p = 0.009 for position x direction interaction; Bonferroni test for OUT ***p < 0.0001) and the calcium signal at the end of the open arms is higher for the OUT than the BACK direction (Bonferroni test *p = 0.015). k In pIC neurons, the signal is not different depending on the mouse direction (n = 20 mice, Two-way ANOVA, F(1,19) = 21.72, ***p = 0.0002 for the position in the open arms, without effect of direction (OUT, BACK) and without interaction). l Calcium signal of aIC glutamatergic neurons when mice are in the open arms negatively correlates with the time mice spent in the OFT center (One-tailed Pearson correlation: R2 = 0.18, *p = 0.045, n = 17 mice). m Correlation of pIC glutamatergic neurons calcium signal when mice are in the open arms, with the time mice spent in the OFT center (One-tailed Pearson correlation: R2 < 0.0001, p = 0.49, n = 20 mice). n Calcium signal of aIC glutamatergic neurons in the OFT center correlates negatively with the time mice spent in the OFT center (One-tailed Pearson correlation: R2 = 0.33, **p = 0.008, n = 17 mice). o Correlation of the calcium signal of pIC glutamatergic neurons when mice are in open arms with the time spent in the OFT center (One-tailed Pearson correlation: R2 = 0.10, p = 0.08, n = 20 mice). p Representative image of a pharmacological injection in the aIC. q The time spent in the open arms is higher in mice who received 8-OH-DPAT intra-insula injection compared to the vehicle group (Two-tailed unpaired t-test, **p = 0.008, n = 5 mice). r Total distance travelled in the EPM is similar between 8-OH-DPAT and vehicle groups. All results are represented as mean ± SEM.
Fig. 2
Fig. 2. Valence-related activity in aIC and pIC glutamatergic neurons.
a Schematic of sucrose/quinine consumption test. b Peri-sucrose licking time course of calcium signal in the aIC (n = 13 mice) and pIC (n = 9 mice). c Calcium signal increases during sucrose licking in aIC (n = 13 mice) and pIC (n = 9 mice) glutamatergic neurons compared to baseline (Two-way ANOVA, F(1,20) = 19.57, ***p = 0.0003 for the event (baseline, licking) with no effect of the region (aIC, pIC) and no interaction; Bonferroni test for aIC *p = 0.017, and for pIC **p = 0.007). d Peri-event analysis of the calcium signal between baseline and movement onset toward the sucrose port in the aIC and pIC (aIC n = 13 mice, pIC n = 9 mice). e Calcium signal increased after movement towards the sucrose port in aIC neurons compared to baseline without changes for pIC neurons (n = 13 and n = 9 mice, Two-way ANOVA, F(1,20) = 8.802, **p = 0.008 for the event (baseline, move to port) with no effect of the region (aIC, pIC) and no interaction; Bonferroni test for aIC **p = 0.007). f Peri-quinine licking time course of calcium signal in the aIC (n = 10 mice) and pIC (n = 8 mice). g Calcium signal increases during quinine licking in pIC neurons (n = 8 mice), but not aIC neurons (n = 10 mice) compared to baseline (Two-way ANOVA, F(1,16) = 6.957, *p = 0.018 for the event (baseline, licking), with no effect of region and no interaction; Bonferroni test for pIC *p = 0.019). h Schematic of the tail suspension test. i Peri-event calcium signal in the aIC (n = 10 mice) and pIC (n = 10 mice) before and during tail suspension. j Calcium signal increases post-lift in aIC (n = 10 mice), but not pIC (n = 10 mice) neurons, compared to pre-lift (Two-way ANOVA, F(1,18) = 49.54, ***p < 0.001 for the event (pre- vs post-lift), no effect of the region (aIC, pIC), and F(1,18) = 21.04, ***p = 0.0002 for event x region interaction; Bonferroni test for aIC, ***p < 0.0001) and is higher in aIC compared to pIC post-lift (Bonferroni test **p = 0.003). k Schematic of the footshocks test. l Peri-shock time course of calcium signal in the aIC (n = 10 mice) and pIC (n = 11 mice). m Calcium signal increases post-shock in aIC (n = 10 mice), but not pIC (n = 11mice) neurons compared to pre-shock (Two-way ANOVA, F(1,19) = 17.84, ***p = 0.005 for the event (pre- vs post-shock) with no effect of the region (aIC, pIC) and no interaction; Bonferroni test for aIC **p = 0.002), and is higher in aIC compared to pIC post-shock (Bonferroni test *p = 0.032). n Post-shock calcium signal in aIC neurons negatively correlates with the time mice spent in open arms of the EPM (One-tailed Pearson correlation: R2 = 0.57, **p = 0.006, n = 10 mice). o Post-shock calcium signal in pIC neurons positively correlates with the time mice spent in open arms of the EPM (One-tailed Pearson correlation: R2 = 0.29, *p = 0.043, n = 11 mice). All the results are represented as mean ± SEM.
Fig. 3
Fig. 3. Downstream projections of anterior insula neurons and aIC-BLA collaterals.
a, b Experimental scheme of viral expression a and imaging downstream regions b, including prelimbic (PL), infralimbic (IL) cortices of the medial prefrontal cortex, contralateral aIC (contra-aIC), contralateral pIC (contra-pIC), nucleus accumbens core (NAc), nucleus accumbens shell (NAsh), bed nucleus of the stria terminalis (BNST), rostral lateral hypothalamus (rLH), caudal lateral hypothalamus (cLH), basolateral amygdala (BLA), medial (CeM) and lateral (CeL) subdivisions of central amygdala. c Representative images of axonal projections from one mouse expressing eYFP in glutamatergic aIC neurons. d Number of fluorescent pixels normalized to the average value of the maximal projection region (BLA) per image from aIC neurons (n = 4 mice). The two bar graphs on the left represent the contralateral aIC and pIC relative axonal density (One-way ANOVA, *p = 0.0198, Bonferroni test compared to BLA image **p < 0.01, ***p < 0.001). e Summary pie chart of relative fluorescent intensity in projecting regions from aIC (blue) and pIC (green). f Viral vector strategy to target aIC to BLA collaterals with eYFP labelling the axonal density and synaptophysin-mCherry (SynP-mCh) targeting synaptic inputs. g Representative images of aIC (left) and BLA (right) transfected with a cre-dependent dual-viral vector and CAV2-cre respectively. h Representative confocal images of SynP-mCherry in the CeL and the BLA. i, j. Number of fluorescent pixels representing aIC to BLA axonal i and synaptic j density normalized to the average value of the ipsilateral BLA image (n = 5 mice). (One-way ANOVA, i *p = 0.0193, Bonferroni test compared to ipsi-BLA image **p < 0.01, ***p < 0.001; j **p = 0.0095, Bonferroni test compared to ipsi-BLA image **p < 0.01, ***p < 0.001). k Summary of the aIC-BLA circuit including ipsilateral and contralateral projections. Blue represents the aIC-BLA population and the red dots represent aIC-BLA synapses. The width of the lines is proportional to the axonal density and the size of the red dots is proportional to the number of synaptic inputs. All the results are represented as mean ± SEM.
Fig. 4
Fig. 4. Properties of IC-BLA and IC-CeM synapses, and of IC-BLA and IC-CeM neurons.
a Experimental strategy of expressing ChR2-eYFP in the insular neurons to confirm the monosynaptic connection of the insular neurons to basolateral amygdala (BLA, IC-BLA) and medial subdivision of central amygdala (CeM, IC-CeM) and record the dynamic properties of insular synapses on BLA and CeM neurons upon the optogenetic activation of insular terminals. b Representative traces of synaptic responses upon the application of ACSF, +TTX + 4AP and +AP5 + NBQX in order to prove the monosynaptic connection of the insular neurons to the BLA and CeM neurons. c Quantification of optogenetic-induced excitatory/inhibitory postsynaptic currents (oEPSC/oIPSC) of BLA and CeM neurons upon optogenetic activations of insular axonal terminals during the application of ACSF, +TTX + 4AP and +AP5 + NBQX (Two-way ANOVA: drug effect for oEPSC: F(2,40) = 44.08, p < 0.0001 from BLA n = 10 cells, CeM n = 12 cells; drug effect for oIPSC: F(1,22) = 39.34, p < 0.0001 for BLA n = 12 cells, CeM n = 12 cells). d Latency to the peak of oEPSC or oIPSC (Two-tailed paired t-test, t = 9.111 ***p < 0.0001 for BLA n = 10 cells, t = 5.467, ***p = 0.0003 for CeM n = 11 cells). e Representative traces and summary data of paired pulse ratio at -70 mV (excitatory PPR) and 0 mV (inhibitory PPR) at the IC-BLA and IC-CeM synapses. (oEPSC: BLA n = 11 cells, CeM n = 12 cells, oIPSC: BLA n = 11 cells, CeM n = 11 cells). f, g Representative traces f and summary data g of excitatory or inhibitory responses of BLA and CeM neurons upon the 10 train stimulations of ChR2 in insular terminals (Repeated measures of ANOVA: Interaction effect for EPSC: F(9,153) = 2.563, **p < 0.01, Interaction effect for IPSC: F(9, 180) = 1.843, p = 0.0634). h. Experimental plan for CTB labeling and whole-cell patch recording of IC-BLA and IC-CeM. i. Representative images of CTB injection sites in BLA and CeM. j. Representative images of biocytin-filled neurons labelled by CTB. k, l Analysis of intrinsic properties from IC-BLA and IC-CeM neurons depending on their anterior-posterior k and layer l position. Measures were obtained from the membrane seal test [1], the IV curve [2], and the Ramp test [3]. See Supplementary Fig. 4a for example traces. k Membrane and input resistances were higher for pIC-BLA compared to aIC-BLA neurons (Two-tailed t-test, t = 2.415, *p = 0.025, and t = 2.154, *p = 0.042 respectively). The rheobase was higher in aIC-BLA neurons (Two-tailed t-test, t = 3.164, **p = 0.005). For aIC-BLA n = 15 cells, pIC-BLA n = 9 cells, aIC-CeM n = 5 cells and pIC-CeM n = 12 cells. l Membrane capacitance is higher for L5 than L2/3 IC-BLA neurons (Two-tailed t-test, t = 2.219, *p = 0.037). For IC-BLA L2/3 and L5 n = 12 cells, IC-CeM L2/3 n = 6 cells and IC-CeM L5 n = 11 cells. m Representative trace of output firing in response to input current steps, analyzed in the following panel. n aIC-CeM neurons are more excitable than pIC-CeM neurons (Two-way ANOVA, F(1,15) = 5.958, *p = 0.023). All results are represented as mean ± SEM.
Fig. 5
Fig. 5. Role of aIC-BLA neurons during anxiety-related behaviors.
a Experimental design including an injection of a cre-dependent viral vector to express somBiPOLES-mCerrulean (or mCerulean) in cell bodies of the aIC, and the injection of the CAV2-Cre vector in the BLA. b Pattern of somBiPOLES experimental manipulation, in which blue light (473 nm) is used to inhibit neuronal population through the soma-targeted GtACR2 component of somBiPOLES, while orange (593 nm) light is used to stimulate neuronal population through the Chrimson component of somBiPOLES. c Representative images of a coronal brain section containing aIC neurons expressing somBiPOLES below the fiber implant. d Percentage of time spent in open arms of EPM, across the 6 epochs of 3 mins. Independently of the stimulation epoch procedure, somBiPOLES group tend to spend less time in open arms compared to control mCerulean (Two-way ANOVA, time: F(3.061, 39.79) = 2.28, p = 0.09, opsin: F(1,13) = 1.596, p = 0.228, time x opsin interaction: F(5,65) = 1.610, p = 0.170, somBiPOLES n = 7 mice, mCerulean n = 8 mice). e Percentage of time spent in the center of OFT, across each epoch. Independently of the stimulation epoch procedure, somBiPOLES group spent less time in the center compared to control mCerulean (Two-way ANOVA, time: F(2.58, 33.58) = 2.792, p = 0.06, opsin: F(1,13) = 5.632, *p = 0.03, time x opsin interaction: F(5,65) = 1.132, p = 0.35, somBiPOLES n = 7 mice, mCerulean n = 8 mice). f Locomotion in open field test, as distance travelled in the arena in meters, epochs are averaged. (Two-way ANOVA, time: F(1.73, 22.47) = 19.63, *p < 0.001, opsin: F(1,13) = 0.454, p = 0.51, time x opsin interaction: F(2,26) = 0.003, p = 0.997, somBiPOLES n = 7 mice, mCerulean n = 8 mice). g Strategy for recording neuronal activity from aIC-BLA neurons in wild-type mice. AAV9-DIO-GCaMP6m was injected in aIC and CAV2-Cre in BLA and an optical fiber was implanted into aIC. h Representative images of GCaMP6m expression in aIC neurons projecting to BLA. i Fiber photometry signal recorded from aIC-BLA neurons, (Top) Bulk GCaMP6m signal, and (Bottom) filtered GCaMP6m signal for calcium transient detection. ∆F/F represents the fluorescent changes from the mean level of the entire recording time series. j Representation of automated transient detection. Filtered GCaMP6m peaks exceeding the threshold (horizontal line in the lower trace) were identified as transients. k Averaged heat map of global calcium signal recorded from aIC-BLA neurons during EPM test. l Global calcium signal is increased in the open arms compared to the closed arms (Two-tailed paired t-test, t = 3.174, **p = 0.005, n = 20 mice). m Calcium transients frequency is increased in open arms compared to closed arms (Two-tailed paired t-test, t = 3.249, **p = 0.004, n = 20 mice). n. Averaged heat map of global calcium signal recorded from aIC-BLA neurons during OFT test (n = 18 mice). o Global calcium signal is increased in the center compared to the border of the OFT (Two-tailed paired t-test, t = 2.249, *p = 0.021, n = 18 mice). p Calcium transient frequency tends to increase in the center compared to the border of the OFT (Two-tailed paired t-test, t = 2.091, p = 0.052, n = 18 mice). q Average calcium signal along the position in the open and closed arms of the EPM. r Calcium signal in the open and closed arms increases at the extremity (25-35 cm) compared to the beginning (0–10 cm) of the arms (n = 20 mice, Two-way ANOVA, F(1,19) = 6.301, *p = 0.02 for the arms (Open, Closed), F(1,19) = 6.8, *p = 0.017 for the position (0–10 vs 25–35 cm) and F(1,19) = 4.509, *p = 0.047 for arms x position interaction; Bonferroni test for open arms ***p < 0.0001 and for closed arms **p = 0.006), and the signal is higher at the extremity of the open than the closed arms (Bonferroni test ***p < 0.0001). s Average calcium signal along the position in the open arms of the EPM while the animal is navigating OUT to the end of the arms or BACK to the center. t Average signal is higher when mice are at the extremity compared to the beginning of the open arm only for the OUT direction (n = 18 mice, Two-way ANOVA, F(1,17) = 8.42, **p = 0.01 for the position (0–10 vs 25–35 cm), no effect of direction (OUT, BACK), and F(1,17) = 7.95, *p = 0.012 for position x direction interaction; Bonferroni test for OUT **p = 0.0015). u Differential calcium transients frequency (open-closed) correlates with the time mice spent in open arms (One-tailed Pearson correlation: R2 = 0.3288, **p = 0.0041, n = 20 mice). All the results are represented as mean ± SEM.
Fig. 6
Fig. 6. Role of aIC-BLA neurons in valence-related behaviors.
a Two representative traces showing an occupancy heatmap of the time spent in the non-stimulated (left) or stimulated (right) side for a control eYFP mouse (left) and GtACR2 mouse (right). b Preference index is increased in GtACR2 group where aIC-BLA glutamatergic neurons are inhibited compared to fRed control group (Two-tailed unpaired t-test, t = 2.345, *p = 0.035, fRed n = 8 mice, GtACR2 n = 7 mice). c Schematic of sucrose or quinine consumption test. d Peri-licking analysis of the calcium signal between sucrose (blue) or quinine (orange) pre-lick and after licking onset. e Global calcium signal after sucrose licking onset is decreased compared to pre-lick (Two-tailed paired t-test, t = 4.077, **p = 0.001, n = 15 mice). f Bar plot of global calcium signal during quinine pre-lick and after licking onset (n = 15 mice). g Peri-event analysis of the calcium signal between pre-suspension and suspension. h Global calcium signal is increased during the suspension compared to pre-tail suspension (Two-tailed paired t-test, t = 6.196, ***p = 0.0003, n = 9 mice). i The intensity of calcium signal during tail suspension is negatively correlated with the time mice spent in the open arms of the EPM (One-tailed Pearson correlation: R2 = 0.498, *p = 0.02, n = 9 mice). j Peri-event analysis of the calcium signal between pre- and post-shock (n = 18 mice). k Global calcium signal is increased during post-shock compared to pre-shock (Two-tailed paired t-test, t = 3.281, **p = 0.0044, n = 18 mice). l Global signal post-shock correlates positively with global signal in the open arms of the EPM (One-tailed Pearson correlation: R2 = 0.2846, *p = 0.01, n = 18 mice). All the results are represented as mean ± SEM.

Similar articles

Cited by

References

    1. American Psychiatric Association. Diagnostic and Statistical Manual of Mental Disorders (DSM-5®). (American Psychiatric Pub, 2013).
    1. Daviu N, Bruchas MR, Moghaddam B, Sandi C, Beyeler A. Neurobiological links between stress and anxiety. Neurobiol. Stress. 2019;11:100191. - PMC - PubMed
    1. Steimer T. The biology of fear- and anxiety-related behaviors. Dialogues Clin. Neurosci. 2002;4:231–249. - PMC - PubMed
    1. Belzung C, Griebel G. Measuring normal and pathological anxiety-like behaviour in mice: a review. Behav. Brain Res. 2001;125:141–149. - PubMed
    1. Sailer U, et al. Altered reward processing in the nucleus accumbens and mesial prefrontal cortex of patients with posttraumatic stress disorder. Neuropsychologia. 2008;46:2836–2844. - PubMed

Publication types