. 2023 Aug 21;14(1):5065.
doi: 10.1038/s41467-023-40592-4.

Omicron infection following vaccination enhances a broad spectrum of immune responses dependent on infection history

Affiliations

Omicron infection following vaccination enhances a broad spectrum of immune responses dependent on infection history

Hailey Hornsby et al. Nat Commun. .

Abstract

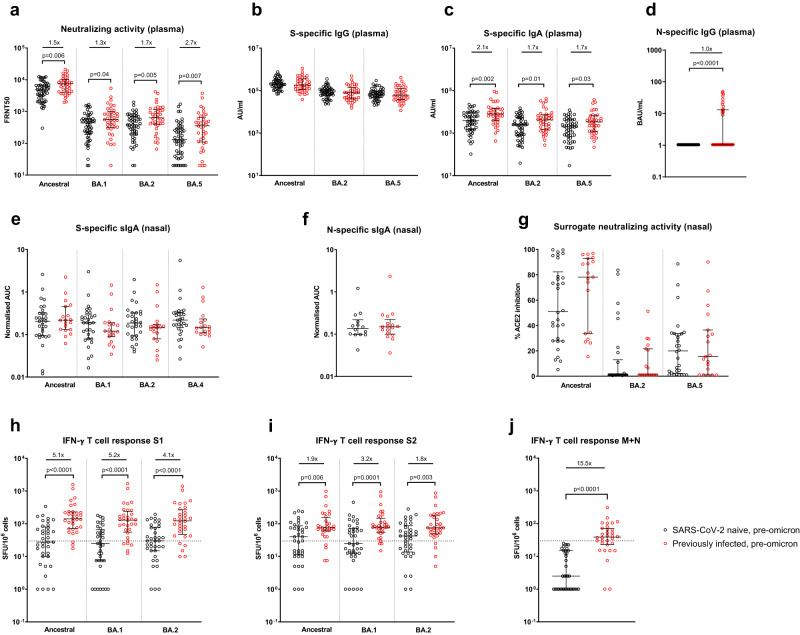
Pronounced immune escape by the SARS-CoV-2 Omicron variant has resulted in many individuals possessing hybrid immunity, generated through a combination of vaccination and infection. Concerns have been raised that omicron breakthrough infections in triple-vaccinated individuals result in poor induction of omicron-specific immunity, and that prior SARS-CoV-2 infection is associated with immune dampening. Taking a broad and comprehensive approach, we characterize mucosal and blood immunity to spike and non-spike antigens following BA.1/BA.2 infections in triple mRNA-vaccinated individuals, with and without prior SARS-CoV-2 infection. We find that most individuals increase BA.1/BA.2/BA.5-specific neutralizing antibodies following infection, but confirm that the magnitude of increase and post-omicron titres are higher in the infection-naive. In contrast, significant increases in nasal responses, including neutralizing activity against BA.5 spike, are seen regardless of infection history. Spike-specific T cells increase only in infection-naive vaccinees; however, post-omicron T cell responses are significantly higher in the previously-infected, who display a maximally induced response with a highly cytotoxic CD8+ phenotype following their 3rd mRNA vaccine dose. Responses to non-spike antigens increase significantly regardless of prior infection status. These findings suggest that hybrid immunity induced by omicron breakthrough infections is characterized by significant immune enhancement that can help protect against future omicron variants.


Conflict of interest statement

S.J.D. is a Scientific Advisor to the Scottish Parliament on COVID-19 for which she receives a fee. Oxford University has entered a joint COVID-19 vaccine development partnership with AstraZeneca. G.S. sits on the GSK Vaccines Scientific Advisory Board and is a founder member of RQ Biotechnology. The remaining authors declare no competing interests.

Figures

Fig. 1
Fig. 1. Comparison of immune responses prior to omicron infection in vaccinated SARS-CoV-2-naive and previously-infected individuals.
Samples were taken a median of 32 days (IQR 28-42.3) after 3rd mRNA dose. a Live-virus neutralizing activity of plasma against ancestral, BA.1, BA.2, and BA.5 viruses, expressed as the reciprocal of the dilution showing 50% reduction in focus forming units (FRNT50); SARS-CoV-2 spike-specific binding IgG (b) and IgA (c) in plasma against ancestral, BA.2 and BA.5 spike proteins (AU/mL = arbitrary antibody units/mL in MesoScale Discovery (MSD) assay); d nucleocapsid-specific IgG in plasma, assessed by ELISA and expressed in WHO International units, BAU/mL; Secretory IgA (sIgA) in nasal lining fluid targeting (e) ancestral, BA.1, BA.2, and BA.4 spike proteins and f nucleocapsid-specific sIgA, expressed as area under the curve (AUC) normalized to total sIgA; g ability of nasal lining fluid to inhibit ACE2 binding to ancestral, BA.2 and BA.5 spike proteins, assessed by MSD assay; IFN-γ ELISpot responses to overlapping peptide pools representing the S1 (h) and S2 (i) spike subunits of ancestral, BA.1 and BA.2 viruses, and j a single-pool-containing peptides of both the ancestral membrane (M) and nucleocapsid (N) proteins. Results are expressed as spot-forming units per million cells (SFU/106). The dashed line represents a positivity threshold of the mean + 2 SD of the background response. Data are shown with median and interquartile range. Median fold-difference between infection-naive and previously-infected individuals is displayed. All comparisons were made with two-sided Mann–Whitney U-test. p-values are displayed where <0.05. For ad, responses were evaluated in 53 SARS-CoV-2-naive and 37 previously-infected individuals for whom samples were available. For eg, responses were evaluated in 32 SARS-CoV-2-naive and 19 previously-infected individuals for whom samples were available. For hj, responses were evaluated in 37 SARS-CoV-2-naive and 32 previously-infected individuals for whom samples were available. Source data are provided as a Source Data file.
Fig. 2
Fig. 2. Impact of omicron infection on plasma neutralizing and binding antibodies in vaccinated SARS-CoV-2-naive and previously-infected individuals.
a Live-virus neutralizing activity of plasma against ancestral, BA.1, BA.2 and BA.5 viruses, expressed as the reciprocal of the dilution showing 50% reduction in focus forming units (FRNT50); b Pair-wise depiction of pre- and post-omicron FRNT as individual participant trajectories for BA.1, BA.2, and BA.5 neutralizing antibodies; c Nucleocapsid-specific IgG in plasma, assessed by ELISA and expressed in WHO International units, BAU/mL; SARS-CoV-2 spike-specific binding IgG (d) and IgA (e) in plasma against ancestral, BA.2 and BA.5 spike proteins (AU/mL = arbitrary antibody units/mL in MSD assay). Data are shown with median and interquartile range. Median fold-change from pre- to post-infection is displayed. Statistical comparisons of paired pre- and post-infection samples made with two-sided Wilcoxon-signed-rank test, and between post-infection levels in previously-infected and SARS-CoV-2 naive individuals made with two-sided Mann–Whitney U-test. P-values are displayed where <0.05. Responses were evaluated in 53 SARS-CoV-2-naive and 37 previously-infected individuals for whom samples were available. Source data are provided as a Source Data file.
Fig. 3
Fig. 3. Impact of omicron infection on secretory IgA and ability to inhibit ACE2 binding to spike proteins in nasal lining fluid in vaccinated SARS-CoV-2-naive and previously-infected individuals.
Secretory IgA (sIgA) in nasal lining fluid targeting a ancestral, BA.1, BA.2, and BA.4 spike proteins and b nucleocapsid protein, expressed as area under the curve (AUC) normalized to total sIgA; c ability of nasal lining fluid to inhibit ACE2 binding to ancestral, BA.2 and BA.5 spike proteins, assessed by MSD assay. Data are shown with median and interquartile range. Median fold-change from pre- to post-infection is displayed. Statistical comparisons of paired pre- and post-infection samples made with two-sided Wilcoxon-signed-rank test, and between post-infection levels in previously-infected and SARS-CoV-2 naive individuals made with two-sided Mann–Whitney U-test. p-values are displayed where <0.05. Responses were evaluated in 32 SARS-CoV-2-naive and 19 previously-infected individuals for whom samples were available. Source data are provided as a Source Data file.
Fig. 4
Fig. 4. Impact of omicron infection on T-cell response to SARS-CoV-2 proteins in vaccinated SARS-CoV-2-naive and previously-infected individuals.
IFN-γ ELISpot responses to overlapping peptide pools representing the S1 (a) and S2 (b) spike subunits of ancestral, BA.1 and BA.2 viruses, and c a single-pool containing peptides of both the ancestral membrane (M) and nucleocapsid (N) proteins. Results are expressed as spot-forming units per million cells (SFU/106). The dashed line represents a positivity threshold of the mean + 2 SD of the background response. Data are shown with median and interquartile range. Median fold-change from pre- to post-infection is displayed. Statistical comparisons of paired pre- and post-infection samples made with two-sided Wilcoxon-signed-rank test, and between post-infection levels in previously-infected and SARS-CoV-2 naive individuals made with two-sided Mann–Whitney U-test. p-values are displayed where <0.05. Responses were evaluated in 37 SARS-CoV-2-naive and 32 previously-infected individuals for whom samples were available. Source data are provided as a Source Data file.
Fig. 5
Fig. 5. Principal component analysis (PCA) of immune responses before and after SARS-CoV-2 omicron infection in vaccinated SARS-CoV-2-naive and previously-infected individuals.
PCA plot representing integrated immunological data, representing components 1 (PC1) and 2 (PC2) annotated by samples from pre- and post-omicron infection (a) and from SARS-CoV-2 naive and previously-infected individuals (b). Percentages indicate the variance explained by PC1 and PC2. c Variable correlation plot, where positively correlated immune responses are grouped together and negatively correlated variables are found in opposite quadrants. The color indicates the quality of representation of the variable on the principal component (cos2), with higher cos2 equating to greater representation. d Quality of variable representations colored by cos2 and contributions of variables to PC1 and PC2 (size of circle, larger circle = greater contribution). e All variables included in the PCA, ordered by degree of representation on PC1 and PC2 (cos2).
Fig. 6
Fig. 6. Epitope-specific CD8+ T-cell magnitude before and after omicron infection in vaccinated SARS-CoV-2-naive and previously-infected individuals.
a Magnitude of multimer-specific CD8+ T cells expressed as a % of total CD8+ cells following mRNA vaccine dose 3 (pre-omicron) and after omicron infection (pooled data from Sheffield and Newcastle). Shown are 63 spike-specific multimer populations from 45 individuals (23 naive, 22 previously-infected), 24 non-spike populations from 20 individuals (10 naive, 10 previously-infected), 15 CMV-specific populations from 15 individuals, and 41 EBV-specific populations from 32 individuals. A value of 0.0001% is assigned to negative samples for the purpose of display on a log10 axis. b Representative flow cytometry plots showing multimer-specific spike- and non-spike CD8+ populations from naive and previously-infected individuals before and after omicron infection. Data are shown with median and interquartile range. Statistical comparisons of paired pre- and post-infection samples where available from the same participants were made with two-sided Wilcoxon-signed-rank test, and between unpaired groups using the Kruskal–Wallis test with Dunn’s post hoc test for multiple pairwise comparisons. p-values are >0.05 unless displayed. Source data are provided as a Source Data file.
Fig. 7
Fig. 7. Epitope-specific CD8+ T-cell phenotypes before and after omicron infection in vaccinated SARS-CoV-2-naive and previously-infected individuals.
a Memory phenotypes of spike-specific CD8+ T cells in 11 SARS-CoV-2 naive and 14 previously-infected individuals (pooled data from Sheffield and Newcastle). b Memory phenotypes of non-spike CD8+ T cells in 7 SARS-CoV-2 naive and 10 previously-infected individuals (pooled data from Sheffield and Newcastle). c Granzyme B expression in epitope-specific CD8+ T cells (data from Sheffield). Shown are spike-specific populations from 8 naive and 12 previously-infected individuals, non-spike populations from 6 naive and 8 previously-infected individuals, and CMV- and EBV-specific populations from 8 and 5 individuals, respectively. Data are shown with median and interquartile range. Statistical comparisons of paired pre- and post-infection samples where available from the same participants were made with two-sided Wilcoxon-signed-rank test, and between unpaired groups using the Kruskal–Wallis test with Dunn’s post hoc test for multiple pairwise comparisons. p-values are >0.05 unless displayed. TNV naive T cells, TSCM stem cell memory T cells, TCM central memory T cells, TTM transitional memory T cells, TEM effector memory T cells, TTE terminal effector T cells. Source data are provided as a Source Data file.

References

    1. Elliott P, et al. Rapid increase in Omicron infections in England during December 2021: REACT-1 study. Science. 2022;375:1406–1411. doi: 10.1126/science.abn8347. - DOI - PMC - PubMed
    1. Viana R, et al. Rapid epidemic expansion of the SARS-CoV-2 Omicron variant in southern Africa. Nature. 2022;603:679–686. doi: 10.1038/s41586-022-04411-y. - DOI - PMC - PubMed
    1. UKHSA. UK Health Security Agency SARS-CoV-2 variants of concern and variants under investigation in England. Technical Briefing 48. (UKHSA, 2022).
    1. Bowen JE, et al. Omicron spike function and neutralizing activity elicited by a comprehensive panel of vaccines. Science. 2022;377:890–894. doi: 10.1126/science.abq0203. - DOI - PMC - PubMed
    1. Planas D, et al. Considerable escape of SARS-CoV-2 Omicron to antibody neutralization. Nature. 2022;602:671–675. doi: 10.1038/s41586-021-04389-z. - DOI - PubMed

Publication types