. 2023 Aug 21;14(1):4777.
doi: 10.1038/s41467-023-40332-8.

Erythropoietin re-wires cognition-associated transcriptional networks

Affiliations

Erythropoietin re-wires cognition-associated transcriptional networks

Manvendra Singh et al. Nat Commun. .

Abstract

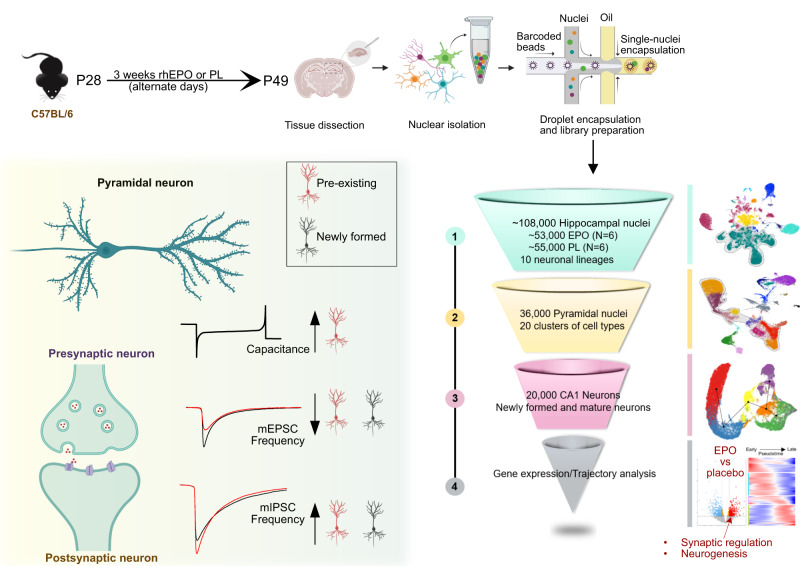
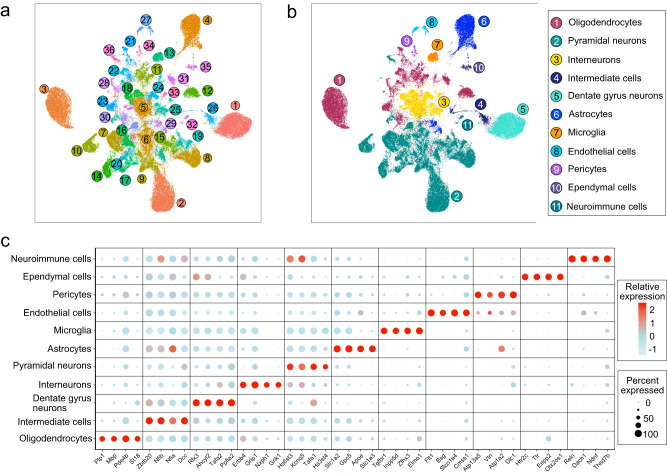
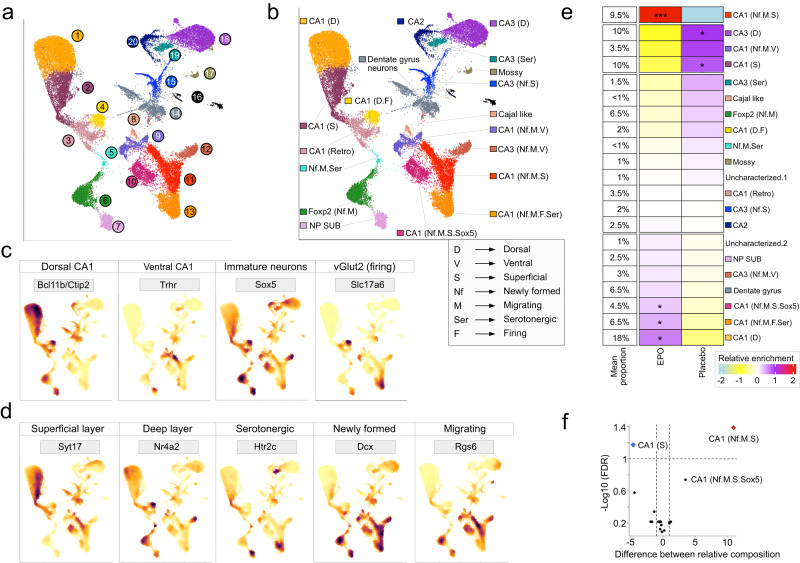
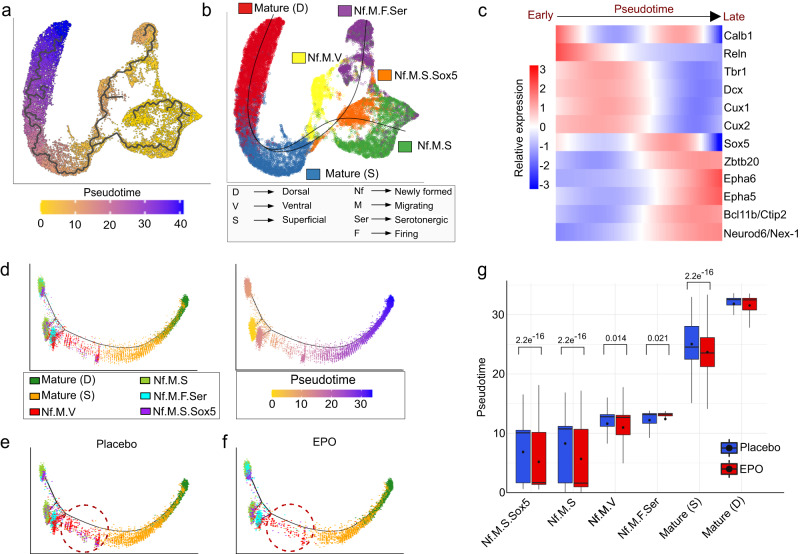
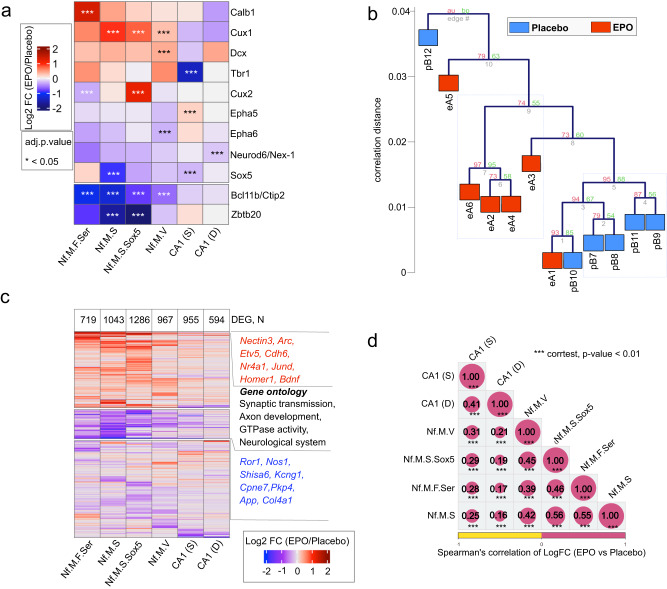
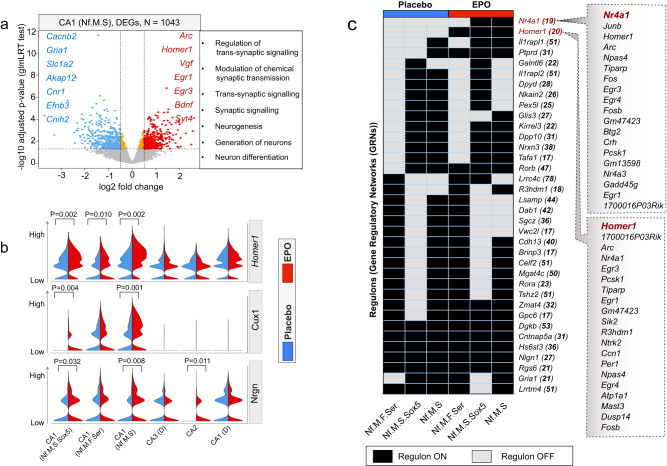
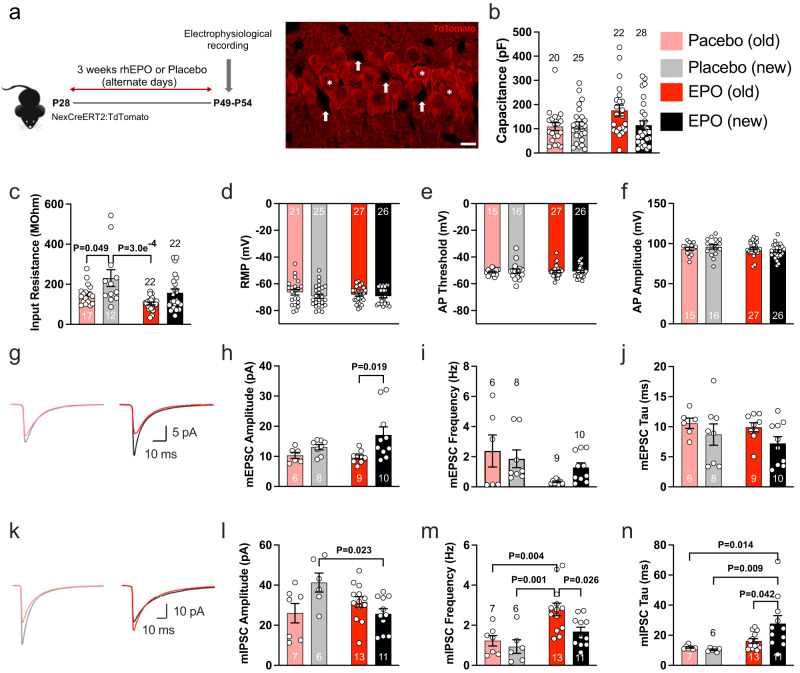
Recombinant human erythropoietin (rhEPO) has potent procognitive effects, likely hematopoiesis-independent, but underlying mechanisms and physiological role of brain-expressed EPO remained obscure. Here, we provide transcriptional hippocampal profiling of male mice treated with rhEPO. Based on ~108,000 single nuclei, we unmask multiple pyramidal lineages with their comprehensive molecular signatures. By temporal profiling and gene regulatory analysis, we build developmental trajectory of CA1 pyramidal neurons derived from multiple predecessor lineages and elucidate gene regulatory networks underlying their fate determination. With EPO as 'tool', we discover populations of newly differentiating pyramidal neurons, overpopulating to ~200% upon rhEPO with upregulation of genes crucial for neurodifferentiation, dendrite growth, synaptogenesis, memory formation, and cognition. Using a Cre-based approach to visually distinguish pre-existing from newly formed pyramidal neurons for patch-clamp recordings, we learn that rhEPO treatment differentially affects excitatory and inhibitory inputs. Our findings provide mechanistic insight into how EPO modulates neuronal functions and networks.


Conflict of interest statement

The authors declare no competing interests.

Figures

Fig. 1
Fig. 1. Cartoon illustration of the present study design, workflow schematics, and overview of our findings.
Our study commences with the 3-week rhEPO (N = 6) and PL (N = 6) treatments in male C57BL/6 mice. After the last injection, we processed 12 samples, 6 each from EPO and PL mice, each a pool of 2 right hippocampi (i.e., a pool of 2 mice). These samples were then subjected to snRNA-seq, and the resulting data were strategically analyzed to investigate the molecular, pseudo-temporal, and empirical changes that occur in pyramidal lineages following EPO treatment. Finally, we performed a series of single-cell electrophysiology experiments to demonstrate that EPO affects excitatory and inhibitory input to newly formed and pre-existing pyramidal neurons in mouse hippocampi. Drop-seq design created with BioRender.com.
Fig. 2
Fig. 2. Classification of neuronal and non-neuronal subpopulations from the mouse hippocampal nuclei landscape.
a Two-dimensional Uniform Manifold Approximation Plot (UMAP) resolving ~108,000 single nuclei, merged from each of 12 adult hippocampal samples treated with either EPO (N = 6) or PL (N = 6) into 36 different clusters. Colors indicate an unbiased classification of these nuclei via graph-based clustering, where each dot represents a single nucleus (see Supplementary Data 1 and Supplementary Fig. 1 for integrating EPO and PL samples). b The above 36 clusters on UMAP are consolidated into 11 major cell types based on distinct expression patterns of known marker genes (see Supplementary Data 2 and Supplementary Fig. 2 for the clusters corresponding to each cell type). c DotPlot illustrates the intensity and abundance of mouse gene expression between the hippocampal lineage shown above. Colors represent an average Log2 expression level scaled to the number of unique molecular identification (UMI) values in single nuclei. The color scale ranges from light blue to red, corresponding to lower and to higher expression. Dot size is proportional to the percent of cells expressing that gene. Source data are provided on a repository and as a Source Data file.
Fig. 3
Fig. 3. Composition and classification of pyramidal cell types in the hippocampus from EPO and PL samples.
a Two-dimensional UMAP reveals ~36,000 single nuclei reanalyzed, classified as a pyramidal lineage in Fig. 2b. Using 2000 most variable genes, the top 30 principal components, our graph-based clustering resolves the 20 distinct cell populations shown in manually assigned color scales. Each dot represents a single nucleus. b Each cluster is shown in (a) is manually annotated based on the most discriminatory gene expression marking CA1, CA2, CA3, Dentate gyrus, and near-project subiculum (NP SUB) neurons. These clusters are further annotated based on marker genes for dorsal, ventral, superficial, and deep regions, or the markers of newly formed, migrating, serotonergic neurons shown inside the gray box. Clusters that expressed a detectible level of vGlut2 were classified as “firing” neurons. c Feature plots based on UMAP from (b) visualizing the expression of selected lineage-specific markers, e.g., Bcl11b/Ctip2 (mature-dorsal CA1), Trhr (ventral CA1), Sox5 (immature/progenitor neurons), and vGlut2/Slc17a6 (neurons with firing potential). d Feature plots based on UMAP from (b) visualizing the expression of genes marking superficial and deep layers (Syt17 and Nr4a2). The serotonergic, newly formed, and migrating neurons are labeled by Htr2c, Dcx, and Rgs6, respectively. e Heatmap illustrating the relative abundance of each pyramidal cell type shown in (b) in EPO and PL samples. The relative abundance was calculated by determining the observed fraction of each cell type compared to the expected fraction and using a two-sided Fisher exact test to identify cell types that were significantly enriched in EPO samples. Stars denote the P values, adjusted using the Bonferroni correction (P < 0.05= *P < 0.01= **P < 2.2e−16 = ***). Note: the changes in neuronal composition are scaled values. f The linear model test over the relative composition of the lineages using the voom method in the limma R package. Volcano plot illustrating the average difference and false discovery rate (FDR) of each lineage shown in (b) between EPO and PL samples. FDR, here, is calculated by the Benjamini–Hochberg method. Source data are provided on a repository and as a Source Data file.
Fig. 4
Fig. 4. EPO modulates the overpopulation of newly formed-migrating-superficial pyramidal neurons.
a Monocle2 single-nuclei trajectory analysis and nuclei ordering along an artificial temporal continuum using the differentially expressed genes between the pyramidal lineages shown in (b). The transcriptome from every single nucleus represents a pseudotime point along an artificial time vector that denotes the progression of newly formed to mature CA1 neurons. b Slingshot trajectory of analyzed pyramidal lineages that defines the branching out of newly formed neurons towards the mature CA1 neurons. Note that the artificial time point progression inferred from both Monocle2 and Slingshot agrees with the biological time points (also see panel c). c Heatmap showing the kinetics of genes changing gradually over the trajectory of newly formed to mature CA1 neurons. Genes (row) and nuclei (column) are ordered according to the pseudotime progression. Genes projected in early stages are associated with neuronal differentiation (Tbr1, Dcx, Calb1), neuronal migration (Reln), dendritic formation (Cux1, Cux2), and Sox5 being the progenitor marker. The late stage is determined by mature neuron and synapse formation genes Epha5, Epha6, Bcl11b, Zbtb20, and Neurod6/NEX1. d Pseudotime trajectory of the above pyramidal lineages shown on multifurcation tree obtained by default DDRTree parameters of Monocle2, colored from low (gold) to high (purple) pseudotime (right panel). Pyramidal lineage cell types clustered using the top 2000 differentially expressed genes and projected into a two-dimensional space (left). e For clarity, we show the above trajectory in two facets. Plot denotes PL. f Same as (e), except this plot denotes EPO samples. g Boxplot demonstrates the distribution of pseudotime values of the above lineages between EPO (n = 6) and PL (n = 6) samples. The colored boxes represent the interquartile range (IQR) divided by the median, and whiskers extend from minima to maxima of data by 1.5-fold of IQR beyond the box. EPO and PL samples were compared using the Wilcoxon Rank-Sum test, and Bonferroni adjusted P values are indicated for significant pairs only. Source data are provided on a repository and as a Source Data file.
Fig. 5
Fig. 5. EPO and PL samples reflect distinct transcriptomes.
a Heatmap representing the differential expression of selected genes (for clarity, see Fig. 4c) between EPO and PL samples in the individual CA1 pyramidal lineages shown in Fig. 3b. Data were presented as log2 fold change, n = 5, for each condition, stars denote the significant P value < 0.01, adjusted using GLMLRTest from edgeR package and stars are indicated for significant P values only. Exact P values are provided in Supplementary Data 6 and in the Source data file. b Hierarchical clustering (Spearman rank correlation, average linkage) and bootstrapping (1000 replicates) of the transcriptomes of individual EPO (A01-A06) and PL (B07-B12) samples. Note that the clustering of A01 and B10 coincides with a similar proportion of lineages in those two samples (compare Supplementary Fig. 7a). c Heatmap representing the differential expression of genes between EPO and PL samples in the individual lineages shown in Fig. 4b. Total n  =  5, for each condition, only those genes are presented that have significant P value < 0.01, adjusted using GLMLRTest from edgeR package. The number of detected differentially expressed genes in each lineage is shown on the right side of the heatmap. d Correlation matrix displaying the pairwise comparison of differentially expressed genes between the comparisons shown in (c). The size of the circles is directly proportional to Spearman correlation strength (see the encircled values). Stars denote the significance levels of correlation at a P value scale ***<0.05. P values are obtained after “holm” adjustment for multiple tests of the pairwise Spearman correlation, tested using the corr.test function in R. Source data are provided on a repository and as a Source Data file.
Fig. 6
Fig. 6. EPO affects the trajectory and expression of genes involved in synaptogenesis and synapse function.
a Volcano plot showing genes that are differentially expressed between EPO and PL samples in newly formed and mature CA1 neurons. The horizontal dashed line indicates −Log10P = 2 (P value, adjusted using GLMLRTest). Boxed text beside the volcano plot corresponds to gene ontologies in which genes that are differentially expressed between EPO and PL cells are enriched. Exact P values are provided in Supplementary Data 6 and in the Source data file. b Violin plots showing the expression distribution of Homer1, Cux1, and Nrgn genes between PL (n = 5) and EPO (n = 5) samples in a pairwise fashion. P values are the results of GLMLRTest from edgeR package (see Supplementary Data 6), Adjusted P values are obtained by Benjamini–Hochberg (BH) correction. c Barcoding the newly formed progenitor lineages in EPO and PL samples with regulons (gene sets that are inferred as GRNs). Heatmap shows the binary activity matrices obtained after applying the SCENIC tool. The activity status of the regulon in a particular lineage is presented as either active (black) or not active (white). Every row is a regulon where the master regulators are represented by their gene names. The number of genes enlisted in a respective regulon is in brackets. The full list of genes is provided in Supplementary Data 7. Source data are provided on a repository and as a Source Data file.
Fig. 7
Fig. 7. EPO treatment differentially affects excitatory and inhibitory input to pre-existing and newly formed neurons.
a Schematic showing EPO/PL treatment regimen and immunohistochemical presentation of newly formed (arrows) and pre-existing (stars; tdTomato-expressing) CA1 neurons as used for the identification in patch-clamp recordings (scale bar: 10 µm). The identity of visually identified CA1 pyramidal cells was confirmed based on their passive membrane properties and their discharge behavior in response to depolarizing current steps. b Comparison of capacitance for newly formed and pre-existing CA1 neurons from PL (PL)- and EPO-treated mice. Bar graphs show pre-existing (old) neurons in light red under PL treatment and in dark red under EPO treatment, and newly formed (new) neurons in gray (PL) and black (EPO) for (bn). c Comparison of input resistance, which is inversely proportional to cell surface area. d Resting membrane potential (RMP) was not affected by EPO treatment or neuron age. e AP threshold was not affected by EPO treatment or neuron age. f AP amplitude was not affected by EPO treatment or neuron age. g Averaged traces of mEPSCs from PL-treated (left) and EPO-treated (right) mice. h New neurons receive excitatory inputs generating larger mEPSC amplitudes under EPO than old neurons. i Comparison of mEPSC frequencies. j Comparison of mEPSC decay times. k Averaged traces of mIPSCs from PL-treated (left) and EPO-treated (right) mice. l New neurons receive inhibitory inputs generating smaller mIPSC amplitudes under EPO treatment than under PL. m New neurons receive lesser increase in mIPSC frequency on EPO than old neurons. n mIPSC decay time constants increase under EPO treatment. Bar graphs show mean values with SEM as error bars, the number of cells analyzed is listed within each bar. Statistical analysis was two-way ANOVA (PL vs EPO and old vs new) with Tukey’s method for multiple comparison correction. P values of the two-way ANOVA are reported in the text, and P values from Tukey’s method are represented in the figure panels. Source data are provided as a Source Data file.

Similar articles

Cited by

References

    1. Baranova O, et al. Neuron-specific inactivation of the hypoxia inducible factor 1 increases brain injury in a mouse model of transient focal cerebral ischemia. J. Neurosci. 2007;27:6320–6332. doi: 10.1523/JNEUROSCI.0449-07.2007. - DOI - PMC - PubMed
    1. Butt UJ, et al. Hippocampal neurons respond to brain activity with functional hypoxia. Mol. Psychiatry. 2021;26:1790–1807. doi: 10.1038/s41380-020-00988-w. - DOI - PMC - PubMed
    1. Dillon GH, Waldrop TG. In vitro responses of caudal hypothalamic neurons to hypoxia and hypercapnia. Neuroscience. 1992;51:941–950. doi: 10.1016/0306-4522(92)90531-6. - DOI - PubMed
    1. Kaur C, Sivakumar V, Foulds WS. Early response of neurons and glial cells to hypoxia in the retina. Investig. Ophthalmol. Vis. Sci. 2006;47:1126. doi: 10.1167/iovs.05-0518. - DOI - PubMed
    1. Revah O, Lasser-Katz E, Fleidervish IA, Gutnick MJ. The earliest neuronal responses to hypoxia in the neocortical circuit are glutamate-dependent. Neurobiol. Dis. 2016;95:158–167. doi: 10.1016/j.nbd.2016.07.019. - DOI - PubMed

Publication types