. 2023 Aug 21;14(1):4941.
doi: 10.1038/s41467-023-40566-6.

Environmental and genetic predictors of human cardiovascular ageing

Affiliations

Environmental and genetic predictors of human cardiovascular ageing

Mit Shah et al. Nat Commun. .

Abstract

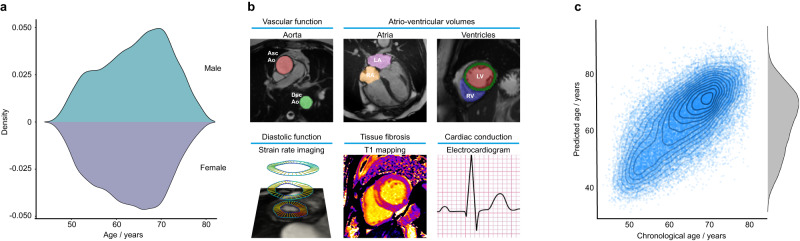
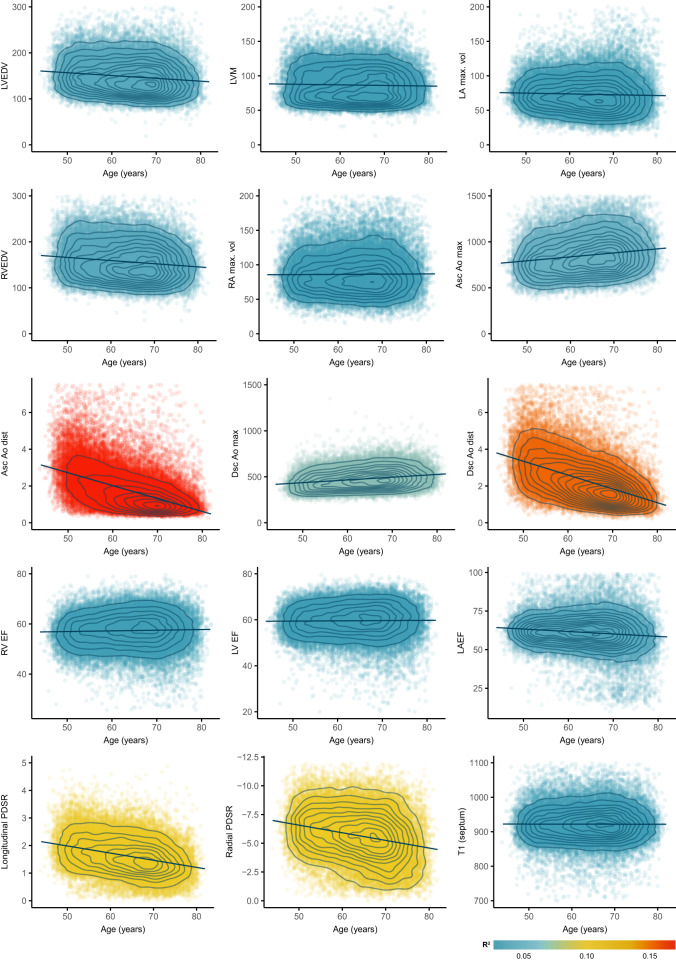
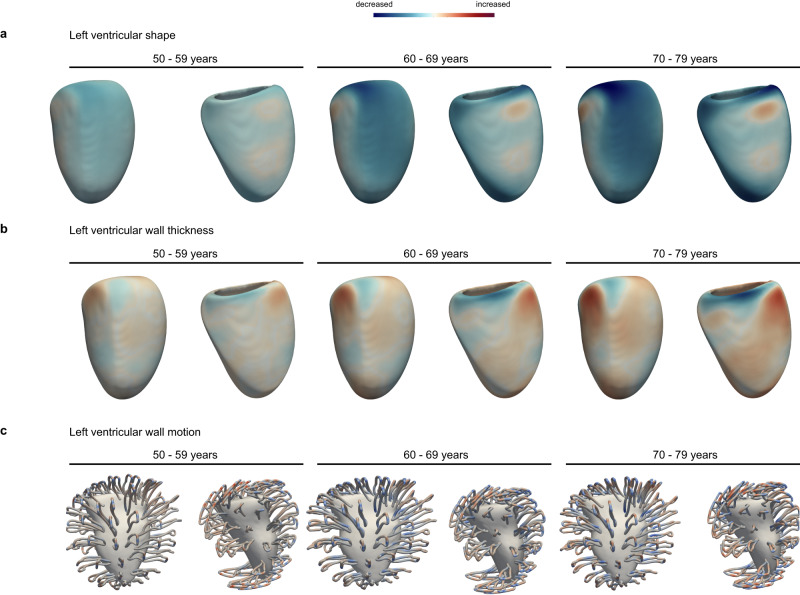
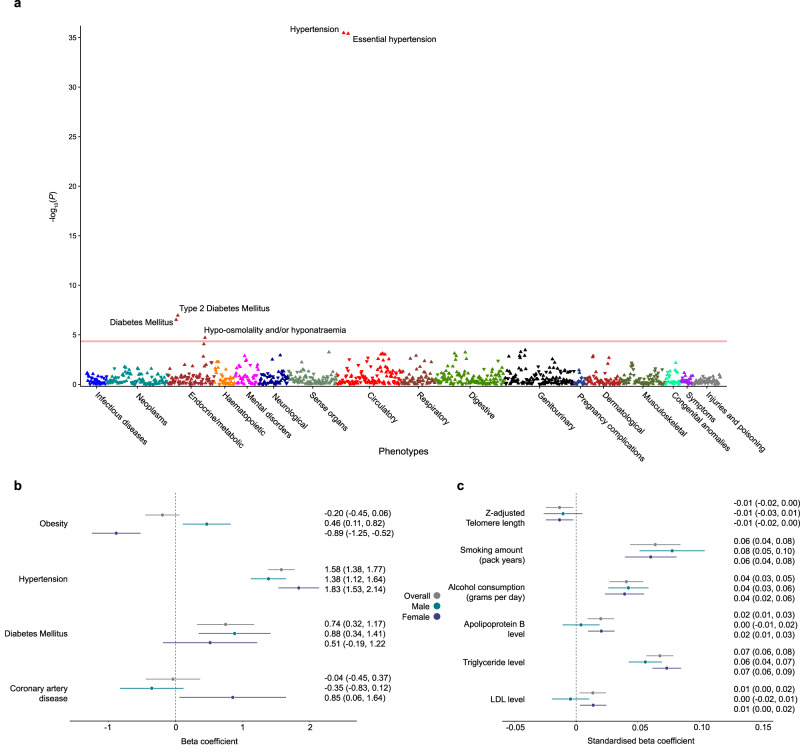
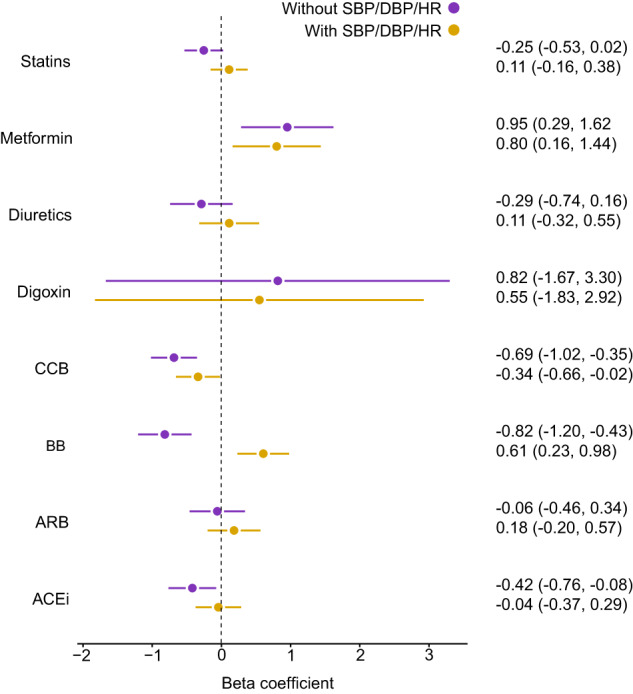
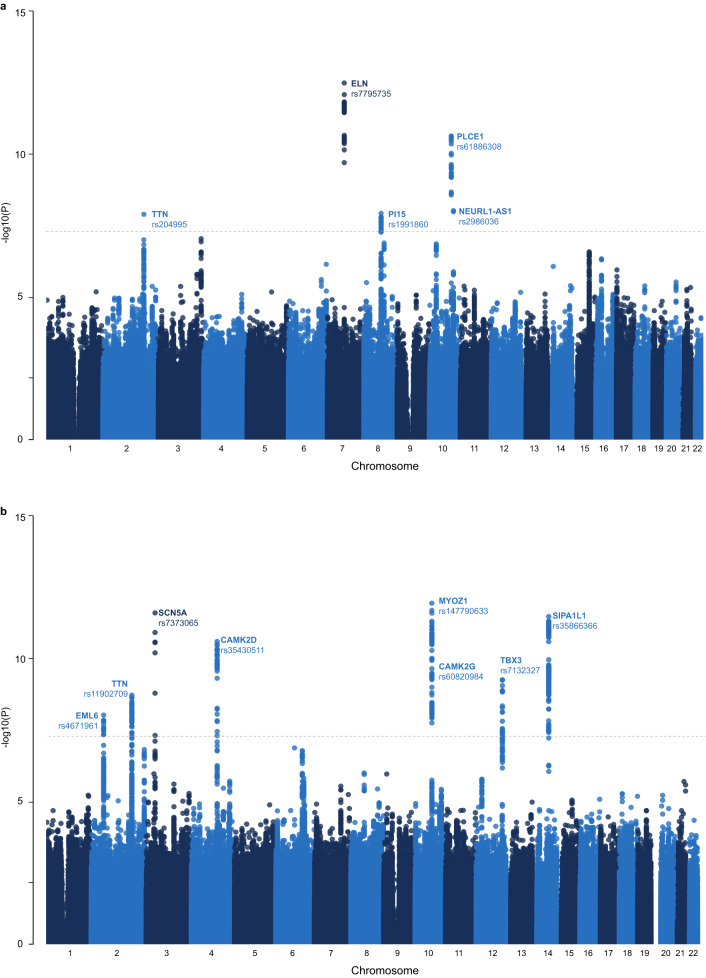
Cardiovascular ageing is a process that begins early in life and leads to a progressive change in structure and decline in function due to accumulated damage across diverse cell types, tissues and organs contributing to multi-morbidity. Damaging biophysical, metabolic and immunological factors exceed endogenous repair mechanisms resulting in a pro-fibrotic state, cellular senescence and end-organ damage, however the genetic architecture of cardiovascular ageing is not known. Here we use machine learning approaches to quantify cardiovascular age from image-derived traits of vascular function, cardiac motion and myocardial fibrosis, as well as conduction traits from electrocardiograms, in 39,559 participants of UK Biobank. Cardiovascular ageing is found to be significantly associated with common or rare variants in genes regulating sarcomere homeostasis, myocardial immunomodulation, and tissue responses to biophysical stress. Ageing is accelerated by cardiometabolic risk factors and we also identify prescribed medications that are potential modifiers of ageing. Through large-scale modelling of ageing across multiple traits our results reveal insights into the mechanisms driving premature cardiovascular ageing and reveal potential molecular targets to attenuate age-related processes.


Conflict of interest statement

J.M., E.E., I.K., C.B. and D.F.F. are full-time employees of Bayer AG, Germany. D.P.O’R. has received research support and consultancy fees from Bayer AG. The remaining authors declare no competing interests.

Figures

Fig. 1
Fig. 1. Summary of data used for cardiovascular age prediction in UK Biobank.
a Age distributions of participants by sex (kernel density estimates, 20,502 females, and 18,947 males). b Phenotypes used for prediction. The top row shows cardiac magnetic resonance images with automated time-resolved segmentation of the aorta and cardiac chambers. The bottom row shows an example of left ventricular motion analysis to derive radial strain rate and a parametric T1 map of the left ventricular myocardium. Resting electrocardiograms (ECGs) were used in an independent model for age prediction. LA left atrium, LV left ventricle, RA right atrium, RV right ventricle, Asc Ao ascending aorta, Dsc Ao descending aorta. c The relationship between predicted and chronological cardiovascular age (n = 34,137, ages jittered, density contours, and a marginal density plot.).
Fig. 2
Fig. 2. A summary of non-imaging and imaging features used in the cardiovascular age prediction model.
a Heatmap for the features, with colours representing the Pearson correlation coefficient (n = 39,559). b Ridge plots summarising the distribution densities of features, normalised for visualisation purposes (n = 39,559). Asc Ao dist ascending aortic distensibility, Asc Ao min./max. area ascending aortic minimum/maximum cross-sectional area, Dsc Ao dist descending aortic distensibility, Dsc Ao min./max. area descending aortic minimum/maximum cross-sectional area, LA left atrium LASV left atrial stroke volume, LAEF left atrial ejection fraction, LVESV left ventricular end-systolic volume, LVEDV left ventricular end-diastolic volume, LVCO left ventricular cardiac output, LVM left ventricular mass, LV left ventricle, PC principal component, RA right atrium, RV right ventricle, Radial/Long SR radial/longitudinal strain rates (numbers in bracket referring to frame number in cardiac cycle), RA max. vol right atrial maximum volume, RVESV right ventricular end-systolic volume.
Fig. 3
Fig. 3. Image phenotype associations with chronological age.
In total, we measured 126 image-derived phenotypes, including temporal motion analysis of cine imaging. A selection of 15 representative phenotypes of volumes, function, and tissue characterisation are shown with their relationship to chronological age at the time of imaging. (n = 39,443, ages jittered, density contours, point colours represent coefficient of determination (R2)). LVEDV left ventricular end-diastolic volume, LVM left ventricular mass, LA max. vol left atrial maximum volume, RVEDV right ventricular end-diastolic volume, RA max. vol right atrial maximum volume, Asc/Dsc Ao max. ascending/descending aortic maximal cross-sectional area, Asc/Dsc Ao dist. ascending/descending aortic distensibility, RV/LVEF right/left ventricular ejection fraction, LAEF left atrial ejection fraction, PDSR peak diastolic strain rate, T1 longitudinal relaxation time of the tissue.
Fig. 4
Fig. 4. Features associated with cardiovascular ageing.
a Radial plot of log-transformed, normalised feature importance in cardiovascular age prediction using CatBoost grouped by category (aortic structure and function (Aorta), left atrial (LA) and left ventricular (LV) structure and function, right atrial (RA) and right ventricular (RV) structure and function, sex, left ventricular strain rates and myocardial native septal T1. b SHAP (Shapley additive explanations) plot of the top twenty features contributing to cardiovascular age prediction. The colour represents the feature value (red high, blue low), and its contribution to model prediction output. Features include ascending (Asc Ao) and descending aortic (Dsc Ao) distensibility (dist), descending aortic minimum cross-sectional area (Dsc Ao min. area), sex, radial and longitudinal strain rates (Radial SR, Long SR, numbers in bracket referring to frame number in cardiac cycle), left atrial stroke volume (LASV), left atrial ejection fraction (LAEF), left ventricular end-systolic and diastolic volume (LVESV, LVEDV), left ventricular cardiac output (LVCO), left ventricular mass (LVM), right atrial maximum volume (RA max. vol) and right ventricular end-systolic volume (RVESV). c Circos plot of the correlation between imaging features. Ribbon widths are proportional to the absolute value of the Pearson correlation coefficient (∣r∣). For simplicity and clarity, absolute correlations are hidden where ∣r∣ < 0.4, and between radial and longitudinal strain measures. EDV end-diastolic volume, ESV end-systolic volume, EF ejection fraction, SV stroke volume. All plots n = 34,137.
Fig. 5
Fig. 5. Three-dimensional models of cardiac ageing.
Three-dimensional mapping of left ventricular shape (a), left ventricular wall thickness (b) and left ventricular motion (c) with increasing age. The models show the mean phenotype for each decade of age relative to 40–49-year olds, aggregating data using registration of cardiac segmentations, with parameters represented on the epicardial surface. Paired views of the inferolateral and anteroseptal walls.
Fig. 6
Fig. 6. Cardiovascular age-delta PheWAS and risk factor associations.
a Phenome-wide analysis of cardiovascular age-delta adjusted for age, age2, sex and the first ten genetic principal components by two-sided logistic regression (n = 34,137 participants). The red line represents the significance threshold after accounting for multiple testing using Bonferroni correction (1149 phenotypes, P < 4.4 × 10−5). Upright triangles indicate positive correlations, and inverted triangles indicate negative correlations. b Linear regression analysis of categorical risk factors with cardiovascular age-delta. Error bars indicate the beta-coefficients point estimates ± 95% confidence intervals (CI) of the experiments, adjusted for age, age2 and sex, and compared with age and sex-matched controls. The test samples comprised n = 7089 participants with obesity, n = 7089 controls without obesity; n = 11,047 participants with hypertension, n = 11,047 controls without hypertension; n = 2466 participants with diabetes mellitus (DM), n = 2466 controls without DM; n = 2658 participants with coronary artery disease (CAD), n = 2658 controls without CAD. c Linear regression analysis of quantitative risk factors with cardiovascular age-delta. Error bars indicate the beta-coefficients point estimates per standard deviation (SD) increase in a unit of risk factor ± 95% confidence intervals (CI) of the experiments, adjusted for age, age2 and sex. Data comprises 32,151 participants with apolipoprotein B data, 32,263 participants with triglyceride data and 32,241 participants with low-density lipoprotein (LDL) data, 31,871 participants with telomere length data, 9283 participants with smoking data and 21,374 participants with alcohol consumption data.
Fig. 7
Fig. 7. Cardiovascular age-delta and drug use associations.
Linear regression analysis of cardiovascular drug usage with cardiovascular age-delta. Error bars indicate the beta-coefficients point estimates ± 95% confidence intervals (CI) of the experiments (n = 27,546 participants). The results of the two models are demonstrated. One model adjusted for age, age2 and sex, cigarette and alcohol intake, body-mass index, diagnoses of obesity, coronary artery disease, hypertension, diabetes mellitus, hypercholesterolaemia and heart failure. A second model additionally adjusted for haemodynamic parameters (heart rate, diastolic blood pressure and systolic blood pressure). ACEi angiotensin-converting enzyme inhibitors, ARB angiotensin receptor blockers, BB beta-blockers, CCB calcium channel blockers, DBP diastolic blood pressure, HR heart rate, SBP systolic blood pressure.
Fig. 8
Fig. 8. Manhattan plots with the results of the genome-wide association study of image- and electrocardiogram (ECG)-derived age-deltas.
This figure shows the −log10(P value) on the y axis across all autosomal chromosomal positions (x axis) derived from large-scale one-sided regression analyses using PLINK. The dotted line indicates genome-wide significance (P = 5 × 10−8), which accounts for multiple testing at genome-wide level. Significant loci are labelled by their most likely causal gene and the lead single nucleotide polymorphism (Table 1). a Imaging feature-derived cardiovascular age-delta GWAS (n = 29,506). b ECG-derived cardiovascular age-delta GWAS (n = 31,475).

References

    1. Rodgers JL, et al. Cardiovascular risks associated with gender and aging. J. Cardiovasc. Dev. Dis. 2019;6:19. - PMC - PubMed
    1. United Nations. World population prospects 2019. Vol (ST/ESA/SE. A/424) Department of Economic and Social Affairs: Population Division (2019).
    1. Gude NA, Broughton KM, Firouzi F, Sussman MA. Cardiac ageing: extrinsic and intrinsic factors in cellular renewal and senescence. Nat. Rev. Cardiol. 2018;15:523–542. doi: 10.1038/s41569-018-0061-5. - DOI - PubMed
    1. Ding YN, Tang X, Chen HZ, Liu DP. Epigenetic regulation of vascular aging and age-related vascular diseases. Adv. Exp. Med. Biol. 2018;1086:55–75. doi: 10.1007/978-981-13-1117-8_4. - DOI - PubMed
    1. Zhu X, et al. Inflammation, epigenetics, and metabolism converge to cell senescence and ageing: the regulation and intervention. Signal Transduct. Target Ther. 2021;6:245. doi: 10.1038/s41392-021-00646-9. - DOI - PMC - PubMed

Publication types