. 2023 Aug 21;10(1):545.
doi: 10.1038/s41597-023-02377-8.

A longitudinal resource for population neuroscience of school-age children and adolescents in China

Collaborators, Affiliations

A longitudinal resource for population neuroscience of school-age children and adolescents in China

Xue-Ru Fan et al. Sci Data. .

Abstract

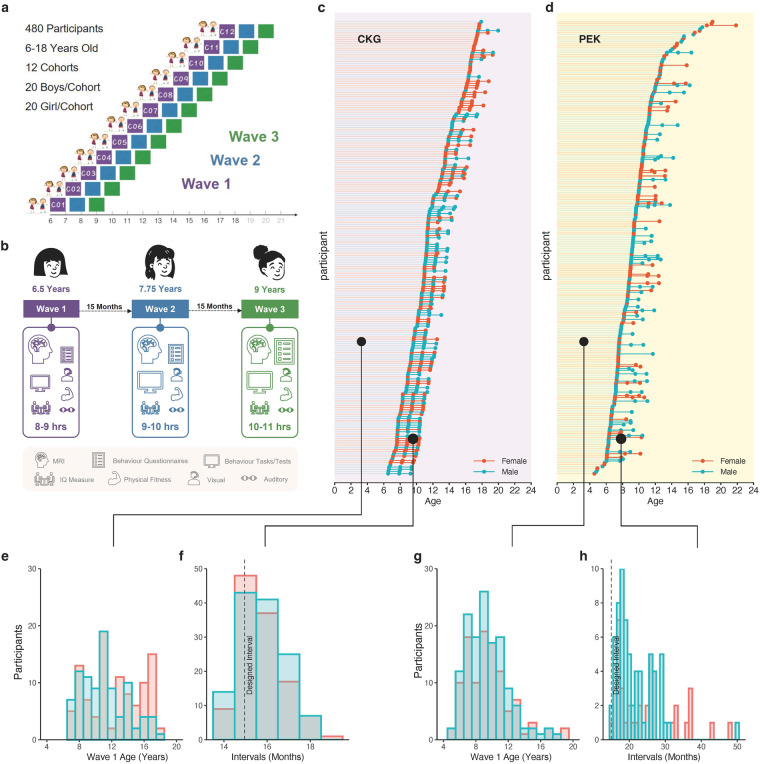
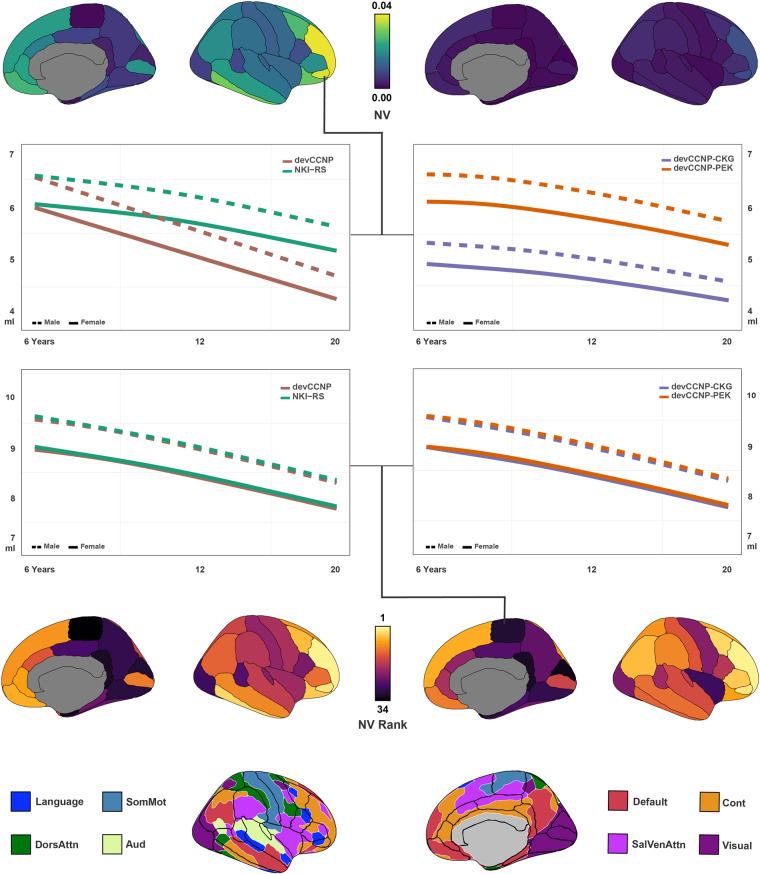
During the past decade, cognitive neuroscience has been calling for population diversity to address the challenge of validity and generalizability, ushering in a new era of population neuroscience. The developing Chinese Color Nest Project (devCCNP, 2013-2022), the first ten-year stage of the lifespan CCNP (2013-2032), is a two-stages project focusing on brain-mind development. The project aims to create and share a large-scale, longitudinal and multimodal dataset of typically developing children and adolescents (ages 6.0-17.9 at enrolment) in the Chinese population. The devCCNP houses not only phenotypes measured by demographic, biophysical, psychological and behavioural, cognitive, affective, and ocular-tracking assessments but also neurotypes measured with magnetic resonance imaging (MRI) of brain morphometry, resting-state function, naturalistic viewing function and diffusion structure. This Data Descriptor introduces the first data release of devCCNP including a total of 864 visits from 479 participants. Herein, we provided details of the experimental design, sampling strategies, and technical validation of the devCCNP resource. We demonstrate and discuss the potential of a multicohort longitudinal design to depict normative brain growth curves from the perspective of developmental population neuroscience. The devCCNP resource is shared as part of the "Chinese Data-sharing Warehouse for In-vivo Imaging Brain" in the Chinese Color Nest Project (CCNP) - Lifespan Brain-Mind Development Data Community ( https://ccnp.scidb.cn ) at the Science Data Bank.


Conflict of interest statement

The authors declare no competing interests.

Figures

Fig. 1
Fig. 1
Experimental design and sample composition. (a) The Accelerated Longitudinal Design (ALD) of devCCNP has 3 repeated measuring waves: Wave 1 (baseline, purple), Wave 2 (follow-up 1, blue), and Wave 3 (follow-up 2, green). The age range of participant enrolment was 6–18 years. The 480 participants were divided into 12 age cohorts, with 20 boys and 20 girls in each. The interval between each successive waves was designed to be 15 months. (b) An example of a participant’s protocol who enrolled at 6.5 years. Measurement content is justified according to the age of each participant. As shown in Supplementary Table S1, the number of psychological behaviour measurements (related to questionnaires and computer-mediated tasks/tests) increases with age. (c,d) Age and sex distributions for participants’ completion in the CKG and PEK Samples (female, red; male, blue). Dots indicate the specific age of each wave’s data collection, while lines indicate the actual intervals between two waves. (e,g) Numbers of participants enrolled (Wave 1) in each age group are calculated according to sex. (f) The actual intervals in the CKG Sample better adhere to the original design; the largest interval is 19 months. (h) In the PEK Sample, intervals have been commonly extended from 16 to 50 months.
Fig. 2
Fig. 2
Example of the MRI raw data directory structure. Collected MRI raw data are structured within a hierarchy of folders according to the standard BIDS format. Under the toplevel project folder “devCCNP/”, CKG (top) and PEK (bottom) Samples are organized separately. Each participant’s folder “sub-CCNP*/” may contain several subfolders depending on how many waves have been completed to date (i.e., if all waves are completed, the folder would include three “/ses-*” subfolders). Imaging data (“.nii.gz”) and metadata (“.json”) are organized into modality-specific directories “/anat/”, “/func/” and “/dwi/”. Note that in the PEK Sample, Diffusion Tension Imaging (DTI) data files are stored under “/dwi/” folders with datatype name “*_dwi.*”.
Fig. 3
Fig. 3
Example of performance on several core characterization measures. (a) Distribution of Full Scale Intelligence Quotient (FSIQ) with four indices: Processing Speed Index (PSI), Working Memory Index (WMI), Perceptual Reasoning Index (PRI), and Verbal Comprehension Index (VCI). Related statistical results are shown in Table 3. (b) Distribution of CBCL total problem scores. Two samples are displayed separately (CKG, light pink; PEK, canary) in (a,b), and vertical lines indicate the medians of samples. (c) Distribution of accuracy rates for seven behaviour measurements. Extremely low values are removed for plotting. Data are represented for measurements of all waves.
Fig. 4
Fig. 4
Site/sex-specific brain charts of white matter volume (WMV). The sex-specific lifespan brain charts of WMV (LBCC, light gray) were adjusted by leveraging the school-aged (6–18 years old) samples for three sites (devCCNP-CKG, purple; devCCNP-PEK, orange; NKI-RS, green). The site-specific brain charts are depicted with their percentiles (2.5%, 50%, 97.5%) for males (dashed lines) and females (solid lines). The background polylines characterize individual WMV changes (unit: 10 ml or 10,000mm3) extracted from the multicohort accelerated longitudinal samples.
Fig. 5
Fig. 5
Similarities in brain growth curves between devCCNP and NKI-RS. NV values of the similarity between the United States and China (first row, left) and two samples within devCCNP (first row, right) are presented through 34 gyral-based neuroanatomical regions, referred to as Desikon-Killiany parcellation (bottom, matched to Kong2022 8 large-scale functional network order). Sex-specific lifespan brain charts of regional volume (unit: ml) specific to one high NV (pars orbitalis; second row) and one low NV (paracentral lobule; third row) are depicted. Males are denoted with dashed lines and females are denoted with solid lines. On this basis, the ranks of NV values of these regions are presented (forth row) from highest to lowest. See Supplementary Tables S2, S3 for detailed values. Note that only the NV values and rank of female participants are shown here, as brain charts are modelled sex-specifically. The left hemisphere is plotted here purely for visualization purposes. See Figure S6 for results relating to male participants.

References

    1. Biswal, B. B. et al. Toward discovery science of human brain function. Proceedings of the National Academy of Sciences of the United States of America107, 4734–4739 (2010). - PMC - PubMed
    1. Van Essen, D. C. et al. The WU-Minn Human Connectome Project: an overview. Neuroimage80, 62–79 (2013). - PMC - PubMed
    1. Yuste, R. & Bargmann, C. Toward a Global BRAIN Initiative. Cell168, 956–959 (2017). - PubMed
    1. Okano, H., Miyawaki, A. & Kasai, K. Brain/MINDS: brain-mapping project in Japan. Philosophical Transactions of the Royal Society of London. Series B, Biological Sciences370 (2015). - PMC - PubMed
    1. Sudlow, C. et al. UK biobank: an open access resource for identifying the causes of a wide range of complex diseases of middle and old age. PLoS Medicine12, e1001779 (2015). - PMC - PubMed