. 2023 Aug 21;14(1):5060.
doi: 10.1038/s41467-023-40747-3.

Simultaneous magnetic resonance imaging of pH, perfusion and renal filtration using hyperpolarized 13C-labelled Z-OMPD

Affiliations

Simultaneous magnetic resonance imaging of pH, perfusion and renal filtration using hyperpolarized 13C-labelled Z-OMPD

Martin Grashei et al. Nat Commun. .

Abstract

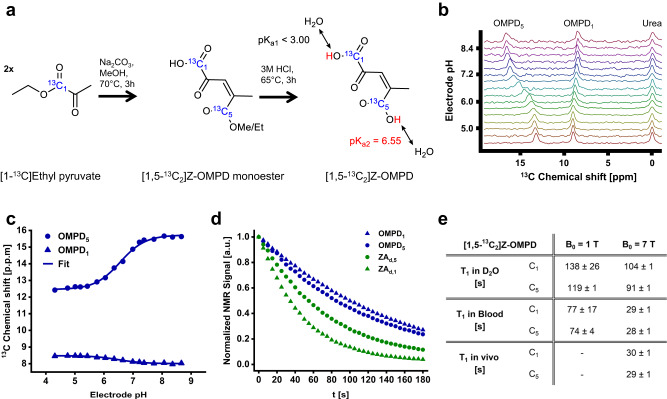
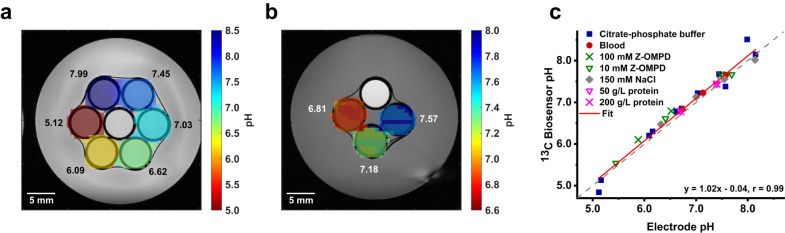
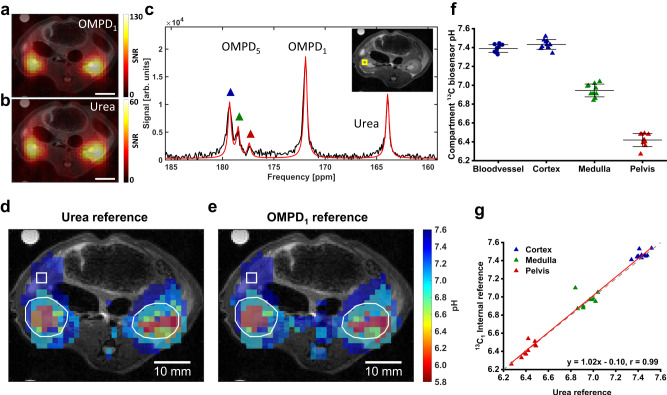
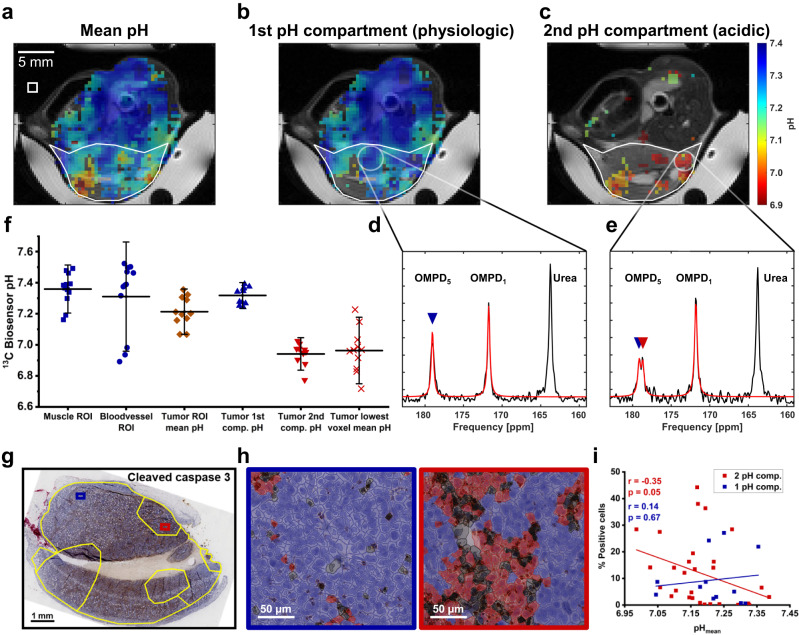
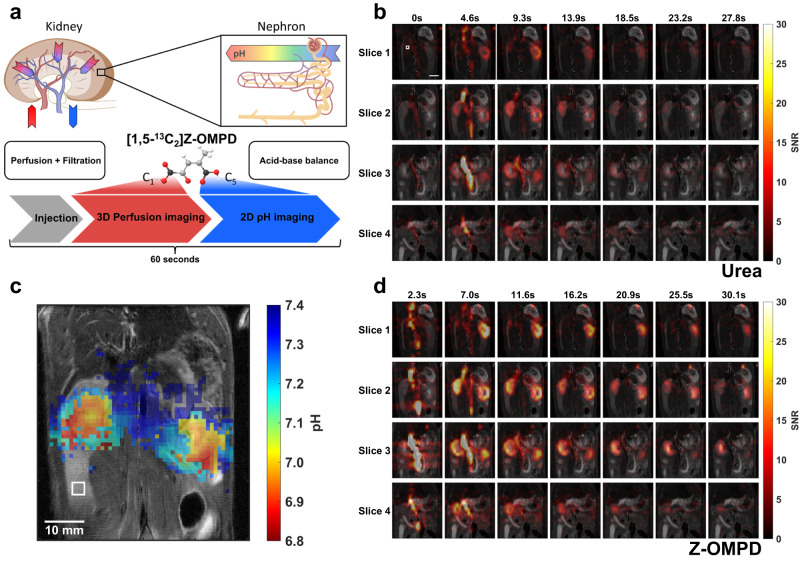
pH alterations are a hallmark of many pathologies including cancer and kidney disease. Here, we introduce [1,5-13C2]Z-OMPD as a hyperpolarized extracellular pH and perfusion sensor for MRI which allows to generate a multiparametric fingerprint of renal disease status and to detect local tumor acidification. Exceptional long T1 of two minutes at 1 T, high pH sensitivity of up to 1.9 ppm per pH unit and suitability of using the C1-label as internal frequency reference enables pH imaging in vivo of three pH compartments in healthy rat kidneys. Spectrally selective targeting of both 13C-resonances enables simultaneous imaging of perfusion and filtration in 3D and pH in 2D within one minute to quantify renal blood flow, glomerular filtration rates and renal pH in healthy and hydronephrotic kidneys with superior sensitivity compared to clinical routine methods. Imaging multiple biomarkers within a single session renders [1,5-13C2]Z-OMPD a promising new hyperpolarized agent for oncology and nephrology.


Conflict of interest statement

The authors declare no competing interests.

Figures

Fig. 1
Fig. 1. Synthesis and characterization of [1,5-13C2]Z-OMPD.
a Z-OMPD was synthesized in a two-step approach by using [1-13C]ethyl pyruvate as a precursor. The pH sensitivity of the 13C resonances in the physiological pH range originates from the C5-carboxyl-group with pKa2 = 6.55. b 13C spectra from a titration series of Z-OMPD show strong and weak pH sensitivity for the C5- and C1-resonance, respectively, relative to [13C]urea as a nonshifting reference. c Fitting of chemical shift changes of Z-OMPD as a function of pH relative to [13C]urea with a scaled logistic function yields pH sensor calibration curves. d Comparison of T1 relaxation time curves of 13C-labelled hyperpolarized in vivo pH sensors shows 13C-labels of undeuterated Z-OMPD (OMPD1; OMPD5) to exhibit superior hyperpolarized signal lifetime compared to deuterated zymonic acid (ZAd,1; ZAd,5). Relaxation curves are measured in D2O at 1 T). e T1 relaxation time constant of the 13C-labels of Z-OMPD at different field strengths (1 T and 7 T) and solvents (D2O and blood), as well as measured in vivo at 7 T.
Fig. 2
Fig. 2. In vitro pH imaging of Z-OMPD in buffer and blood phantoms.
a pH map generated from a CSI acquisition of 6 mM Z-OMPD and 10 mM [13C]urea in six citrate-phosphate buffer phantoms of different pH values, overlaid with a corresponding T2-weighted image. Black numbers indicate reference phantom pH values measured using a conventional pH electrode. b pH image of three human blood phantoms of different pH values after injection of 11 mM hyperpolarized Z-OMPD and 19 mM [13C]urea, overlaid with a T1-weighted image. White numbers display phantom reference pH values. The white center phantom (a) and top phantom (b) contain only thermal [13C]urea for B1 calibration. c pH values measured under various citrate-phosphate buffer conditions (phantom conditions from imaging in a), blood (phantom conditions from imaging in b), pH sensor-, salt- or protein concentrations using Z-OMPD agree well with measurements using a conventional pH electrode.
Fig. 3
Fig. 3. In vivo pH imaging in healthy rat kidneys and internal reference.
a, b Signal distribution and signal-to-noise-ratio (SNR) of the OMPD1 (a) and [13C]urea (b) show strong accumulation of both compounds in the kidneys. Scale bars, 10 mm. c Single voxel spectrum from inside of a rat kidney. The exact voxel position is indicated in the inset with a yellow square, the T2w image corresponds to the background in d and e. The C5-resonance of Z-OMPD (OMPD5) splits into three peaks, thereby revealing pH compartments on a sub-voxel level (blue triangle = renal cortex, green = renal medulla, red = renal pelvis). d In vivo pH maps of up to three pH compartments of healthy rat kidneys (white ROIs) overlaid on each other and a T2-weighted anatomical image. pH values were calculated using the derived calibration curve and fitting of each C5-resonance position using [13C]urea as a reference. The white square indicates the native voxel size. e Compartment in vivo pH maps generated as in (d) but using the OMPD1 as an intra-molecular internal reference for pH calculations. Compartment maps show good agreement with the urea-referenced version in d. f A cluster plot shows good consistency for the pH values of the blood pool and the detected renal pH compartments across ten animals. Values are presented as means ± SD (n = 10 for each region from independent from independent probe injection experiments). g A quantitative comparison of the pH values of detected renal compartments using either [13C]urea or the C1-resonance as a reference shows good agreement between the two methods.
Fig. 4
Fig. 4. In vivo pH imaging in subcutaneous EL4 lymphoma allows assessment of tumor heterogeneity.
a pH imaging in subcutaneously implanted EL4 lymphoma (white ROI) reveals heterogeneous tumor acidification. The white square indicates the native CSI resolution. b The majority of the tumor shows only one pH compartment being close to physiological pH conditions (d), indicated by one OMPD-C5-peak (blue triangle, spectrum from white circle ROI in b). c One or multiple subregions exhibit a second, acidic pH compartment, which is detectable as a second peak for the OMPD-C5-resonance (red triangle) in the spectrum (spectrum from white circle ROI in c) (e). Tumors generally show acidification of the mean pH (orange diamonds) compared to healthy muscle (blue squares) or blood pH (blue circles) (f), with its physiological compartment (blue triangle) being comparable to muscle pH, while the acidic pH compartment (red triangle) and the lowest single voxel mean pH (red crosses) are acidified by up to 0.6 pH units. Values are presented as means ± SD (n = 12 for muscle and blood vessel ROIs, n = 11 for tumor ROI-derived values, values are derived from independent probe injection experiments). g Histological analysis (n = 9 tumors) of the resected tumors confirms heterogeneity. h Quantification of immunohistochemical stainings of tumors in g are performed by classifying viable tumor cells (necrotic cells in black) into positive (red) and negative cells (blue). i Tumor areas bearing an acidic pH compartment tend to show a stronger expression of cleaved caspase 3 with increasing tumor acidification. Correlations for 2- (r = −0.35, p = 0.05) and 1-pH compartment regions (r = 0.14, p = 0.67) were assessed by linear regression.
Fig. 5
Fig. 5. Simultaneous in vivo imaging of renal perfusion, filtration, and acid-base balance.
a Scheme for simultaneous combined imaging of renal kidney perfusion and filtration in 3D and renal pH in 2D within one minute where functional information is selectively obtained from one of the 13C labels of Z-OMPD. b Image time series of co-injected hyperpolarized [13C]urea for a comparison with a standard hyperpolarized perfusion marker covering both healthy rat kidneys. The white square indicates the native voxel size. Scale bar, 10 mm. c The following CSI acquisition allows reconstruction of low-noise pH maps where the acidic renal pelvis generates good pH contrast compared to the surrounding renal cortex. Native voxel sizes for both acquisitions are indicated by white squares. d Image time series of the C1-magnetization of hyperpolarized Z-OMPD. The higher SNR compared to [13C]urea together with the high spatial resolution allows better assessment of first-pass perfusion and renal filtration from the cortex (renal periphery) to the pelvis (renal center) when injected at identical concentrations. Image acquisition for both compounds started with start of injection and acquisition of time frames alternated between [13C]urea and Z-OMPD. Hyperpolarized acquisitions are overlaid with an anatomical T2-weighted image. The schematic kidney in a was created with BioRender.com.
Fig. 6
Fig. 6. Image- and spectroscopy-based quantification of renal function.
a The accumulation of both [13C]urea (a) and Z-OMPD (c) in the renal cortex (blue curves and ROI) and pelvis (yellow curves and ROI) can be assessed by extraction of 3D-ROI-based (e, two example slices shown) signal time curves from the image series in Fig. 5b, c. Scale bars, 10 mm. b, d T1-decay correction and fitting of time curve sections, where temporal signal evolution is mainly driven by the renal filtration process. Additionally, for renal blood flow, cortex time curves are normalized by image-derived arterial input functions (AIFs, red ROIs in e) for [13C]urea (f) and Z-OMPD (g). h Single kidney GFR values for [13C]urea and Z-OMPD show good agreement, with Z-OMPD showing slightly faster renal clearance. i Comparison of renal blood flow values for [13C]urea and Z-OMPD also shows good agreement between both perfusion agents with renal blood flow measured by Z-OMPD being systematically higher compared to [13C]urea. j Axial slice positioning for non-imaging, spectroscopic assessment of renal filtration. Scale bars, 10 mm. k Waterfall plot of a dynamic slice-spectroscopy on both kidneys. Due to different pH milieus, the anatomical regions of the kidney, namely the renal cortex, medulla and pelvis are distinguishable as individual peaks for the C5-resonance of Z-OMPD. l tGFR values can be calculated from spectroscopic data only by fitting of the time curves of the cortex- and the pelvis peak integrals. Correlations for RBF (r = 0.90, p = 2 × 10-6) and GFR (r = 0.88, p = 4 × 10-5) between [13C]urea- and Z-OMPD-based measurements were assessed by linear regression.
Fig. 7
Fig. 7. Comparison of kidney parameters in hydronephrosis measured by hyperpolarized 13C-MRI using Z-OMPD and clinical standard techniques.
a 3D dynamic perfusion imaging of hydronephrotic kidneys shows poor filtration of Z-OMPD towards the renal pelvis (grey arrows) despite strong cortical perfusion (white arrows). This is quantitatively reflected by normal tRBF (b, n = 9 healthy and n = 8 hydronephrotic individual kidneys) but strongly reduced tGFR (c, n = 8 healthy and hydronephrotic individual kidneys). Four-fold interpolated pH compartments for the cortex (d, e) and the medulla (f, g) appear homogeneous and at physiological pH while the pelvis exhibits strong, pathologic acidification (h, i) (n = 10 healthy kidney values from Fig. 3f, n = 12 individual hydronephrotic kidney cortex and medulla and n = 9 pelvis compartments). The left kidney pH compartments in d, f and h exhibit reduced cross-section due to inclined CSI slice placement. Conventional MRI for renal disease status assessment shows a moderate increase j in ADC (diffusion-weighted MRI) and a substantial volume (k) increase of hydronephrotic kidneys (T2-weighted MRI, j, k: n = 14 healthy, n = 16 hydronephrotic individual kidneys) compared to healthy controls. Renal biomarkers in blood serum reveal mildly increased creatinine- (l) and strongly elevated urea levels (m), while SDMA values are not clinically evident (n) (l, m, n: n = 8 individual blood samples). Reference ranges (dashed lines) were obtained from animal suppliers for creatinine and urea or literature for SDMA. o Urine pH is unobtrusive in hydronephrotic models (n = 10 healthy and n = 11 individual hydronephrosis urine samples). p Comparison of significant parameters using Cohen’s d indicates pelvic pH and tGFR measured by hyperpolarized imaging Z-OMPD to be most sensitive to this kidney disease. Scale bars and white squares in a and d indicate 10 mm and native acquisition resolution respectively. Values in b, c, e, g, i—o are presented as means ± SD. Two-tailed, unpaired Student’s t tests were used in b, c, e, g, i, j, k, o, One-sided Student’s t tests against the upper reference interval boundary were used in l, m.

Similar articles

Cited by

References

    1. Lacava V, et al. Nephro-oncology: a link in evolution. Ren. Fail. 2015;37:1260–1266. - PubMed
    1. Rosner MH, Jhaveri KD, McMahon BA, Perazella MA. Onconephrology: The intersections between the kidney and cancer. CA Cancer J. Clin. 2021;71:47–77. - PubMed
    1. Huber V, et al. Cancer acidity: An ultimate frontier of tumor immune escape and a novel target of immunomodulation. Semin Cancer Biol. 2017;43:74–89. - PubMed
    1. McCarthy MF, Whitaker J. Manipulating Tumor Acidification as a Cancer Treatment Strategy. Alternative Med. Rev. 2010;15:264–272. - PubMed
    1. Wang BY, et al. Intermittent high dose proton pump inhibitor enhances the antitumor effects of chemotherapy in metastatic breast cancer. J. Exp. Clin. Cancer Res. 2015;34:85. - PMC - PubMed

Publication types