. 2023 Aug 21;14(1):5077.
doi: 10.1038/s41467-023-40824-7.

CD36 mediates SARS-CoV-2-envelope-protein-induced platelet activation and thrombosis

Affiliations

CD36 mediates SARS-CoV-2-envelope-protein-induced platelet activation and thrombosis

Zihan Tang et al. Nat Commun. .

Abstract

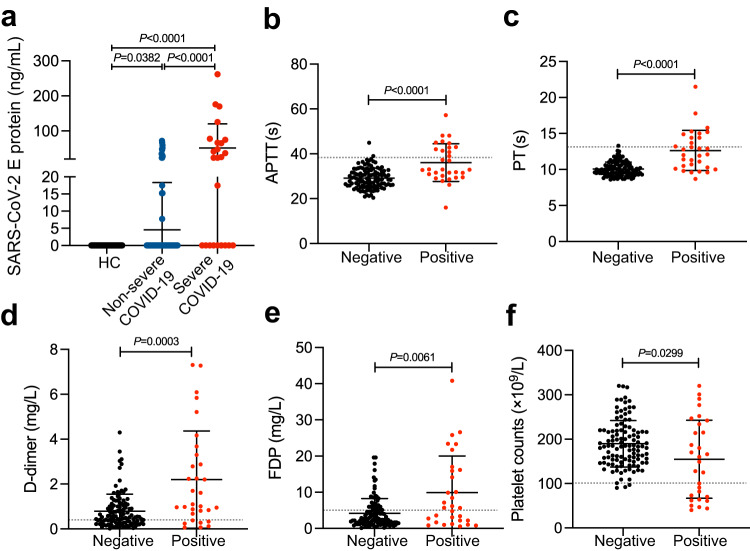
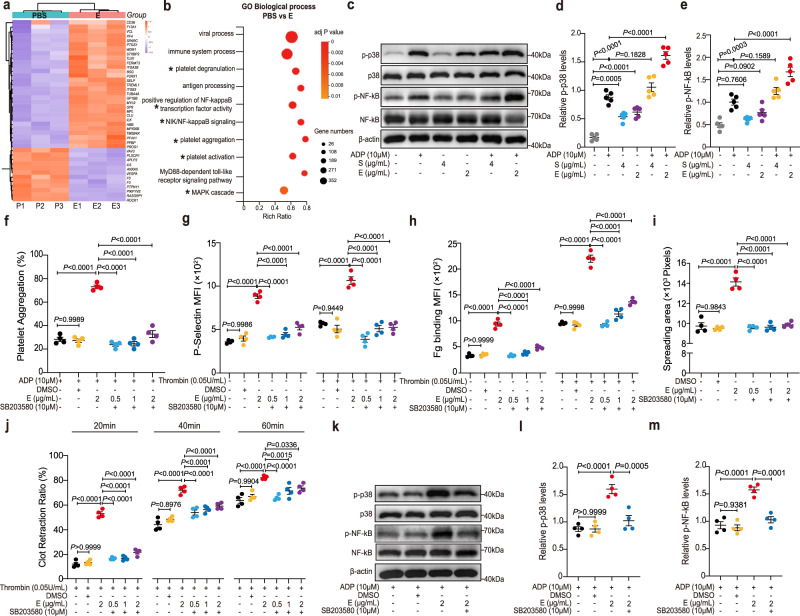
Aberrant coagulation and thrombosis are associated with severe COVID-19 post-SARS-CoV-2 infection, yet the underlying mechanism remains obscure. Here we show that serum levels of SARS-CoV-2 envelope (E) protein are associated with coagulation disorders of COVID-19 patients, and intravenous administration of the E protein is able to potentiate thrombosis in mice. Through protein pull-down and mass spectrometry, we find that CD36, a transmembrane glycoprotein, directly binds with E protein and mediates hyperactivation of human and mouse platelets through the p38 MAPK-NF-κB signaling pathway. Conversely, the pharmacological blockade of CD36 or p38 notably attenuates human platelet activation induced by the E protein. Similarly, the genetic deficiency of CD36, as well as the pharmacological inhibition of p38 in mice, significantly diminishes E protein-induced platelet activation and thrombotic events. Together, our study reveals a critical role for the CD36-p38 axis in E protein-induced platelet hyperactivity, which could serve as an actionable target for developing therapies against aberrant thrombotic events related to the severity and mortality of COVID-19.


Conflict of interest statement

The authors declare no competing interests.

Figures

Fig. 1
Fig. 1. Serum levels of the SARS-CoV-2 E protein correlate with thrombosis in COVID-19 patients.
a The E protein was detected in 31 COVID-19 patients. The level of the E protein in COVID-19 patients was 12.33 ± 34.87 ng/ml. The COVID-19 patients were divided into a non-severe group (n = 121) and a severe group (n = 24) as described in the “Methods” section. The level of the E protein was significantly increased in sera of severe COVID-19 patients (51.43 ± 68.63 ng/ml) compared to non-severe COVID-19 patients (4.58 ± 13.77 ng/ml). Significantly longer activated partial thromboplastin time (APTT) (b) and prothrombin time (PT) (c), elevated D-dimer (d) and fibrinogen degradation products (FDP) (e), decreased platelet counts (f) were observed in COVID-19 patients with positive E test (n = 31), compared to COVID-19 patients with negative E test (n = 114). The gray line represents the cut-off level. Data are presented as mean ± SD. Data were analyzed by the Kruskal–Wallis test (a) or 2-tailed Mann-Whitney U test (bf). Source data are provided as a Source Data file.
Fig. 2
Fig. 2. Serum E proteins promote thrombosis in vivo.
a Wild-type (WT) mice were intravenously injected with the E protein (0.5, 1, 2 and 4 μg per mouse) or PBS. Four hours later, mouse models of pulmonary embolism (PE) were induced by intravenous injection of collagen and epinephrine. b The presence of the E protein on platelets in lung embolism of mice. Immunofluorescence staining on lung section from the E-treated mouse model of PE was performed with anti-SARS-CoV-2 E protein (red), and anti-CD41 (green) antibodies. Nuclei were stained with 4′,6-diamidino-2-phenylindole (DAPI). Scale bar = 10 μm. c Representative field on hematoxylin-eosin (HE) stained lung sections in each group. Scale bar = 100 μm. Results in b and c were confirmed in five independent experiments. d Quantification of the number of lung embolisms per visual field on lung sections. The number of lung thrombi was 13.72 ± 3.96 in PBS-treated WT mice, 13.64 ± 4.28 in E-treated (0.5 μg) WT mice, 14.44 ± 4.51 in E-treated (1 μg) WT mice, 16.20 ± 4.67 in E-treated (2 μg) WT mice, and 22.00 ± 4.74 in E-treated (4 μg) WT mice. Data are mean ± SD of 25 counts from 5 mice in each group. e WT mice were treated with the E protein (4 μg per mouse) or PBS, and then the inferior vena cava (IVC) stenosis model was performed. f Representative image of the thrombi isolated from mouse IVC. g The thrombus weight was 8.40 ± 1.14 mg in PBS-treated mice, and 13.60 ± 1.14 mg in the E-treated mice (n = 5). Data are presented as mean ± SD. h Immunofluorescence staining of the E protein (red), CD41(green), DAPI in thrombi section isolated from the E-treated mouse after IVC model. Scale bar = 10 μm. Data were analyzed by the Kruskal–Wallis test (d) or 2-tailed Mann–Whitney U test (g). Source data are provided as a Source Data file.
Fig. 3
Fig. 3. E protein activates platelets.
Washed human platelets from healthy donors were incubated with the SARS-CoV-2 E protein (0.5, 1, 2 μg/ml) or the SARS-CoV-2 S protein (1, 2, 4 μg/ml) for 5 min at 37 °C as a pretreatment step. a Aggregation of pretreated platelets was measured in response to ADP (10 μM) (n = 4). Both the E protein and the S protein enhanced platelet aggregation in a dose-dependent manner. The E protein exhibited a stronger ability to enhance platelet aggregation than S protein. b and c The E protein dose-dependently promoted platelet P-selectin exposure and integrin αIIbβ3 activation. P-selectin exposure and fibrinogen (Fg) binding in pretreated platelets with or without stimulation of 0.05U/ml thrombin were detected by flow cytometry (n = 4). d Pretreated platelets were allowed to spread on immobilized Fg at 37 °C for 20, 40, and 60 min. Area (pixel numbers) of 3 random fields of spreading platelets were quantified (n = 4). e The E protein concentration-dependently accelerated clot retraction. Pretreated platelets were added into platelet-free plasma, and then clot retraction was induced by 1 U/ml thrombin (n = 4). Quantification of clot retraction at 20, 40, and 60 min, respectively. Data were analyzed by 1-way ANOVA with Tukey multiple-comparisons test (ac) or 2-way ANOVA with Tukey multiple-comparisons test (d and e). Data are presented as mean ± SEM. Source data are provided as a Source Data file.
Fig. 4
Fig. 4. The p38 MAPK/NF-κB pathway mediates E protein-induced platelet activation.
a Washed human platelets isolated from healthy donors were incubated with or without the E protein (2 μg/ml) at 37 °C, and then platelet RNA was isolated for RNA-Seq (n = 3). Heat map of significantly differentially expressed platelet transcripts from human platelets treated with or without the E protein. b Gene Ontology (GO) analysis identified enriched pathways (Log2FC ≥ 1, adjusted P < 0.05). ce Human platelets were preincubated with the E protein (2 μg/ml) or the S protein (4 μg/ml) for 5 min at 37 °C and stimulated with or without ADP (10 μM). Western blot analysis showed that the E protein potentiated the phosphorylation of p38 and NF-κB in platelets (n = 5). Washed human platelets were pretreated with 10 μM SB203580 (a p38 inhibitor) or dimethyl sulfoxide (DMSO) for 10 min at 37 °C, followed by incubation with the E protein (0.5, 1, 2 μg/ml) for 5 min as a pretreatment step. f Potentiated platelet aggregation induced by the E protein combined with ADP 10 μM was suppressed by SB203580 (n = 4). g and h Enhanced P-selectin exposure and fibrinogen (Fg) binding of platelets induced by the E protein were suppressed by SB203580 (n = 4). i SB203580 inhibited the E protein promoting human platelet spreading on Fg (n = 4). Pretreated platelets were allowed to spread on a Fg-coated surface at 37 °C for 1 h. Data was shown with quantification analysis of the areas of spreading platelets (pixel numbers). j SB203580 attenuated accelerating clot retraction induced by the E protein in response to thrombin (n = 4). Data were presented with quantification analysis of clot retraction at 20, 40, and 60 min. km Western blot analysis of phosphorylation of p38 and NF-κB in platelets. SB203580 (10 μM) suppressed the elevated phosphorylated levels of p38 and NF-κB promoted by the E protein (2 μg/ml) in response to ADP (10 μM) (n = 4). The molecular weight markers are shown (c, k). Data were analyzed by 1-way ANOVA with Tukey multiple-comparisons test (di, l, m) or 2-way ANOVA with Tukey multiple-comparisons test (j). Data are presented as mean ± SEM. Source data are provided as a Source Data file.
Fig. 5
Fig. 5. The transmembrane protein CD36 mediates E protein-induced platelet activation.
a Biacore sensorgrams and binding kinetics determined by SPR for recombinant SARS-CoV-2 E protein with recombinant human CD36 protein. b His pull-down assay showed that his tagged E protein could specifically pull down the recombinant CD36. c Coimmunoprecipitation showed that recombinant CD36 coimmunoprecipitated with the E protein. Results in (b and c) were confirmed in three independent experiments. d The E protein bound to immobilized CD36 in a dose-dependent manner. e FA6-152 (10 μg/ml) ameliorated enhanced platelet aggregation induced by the E protein (n = 4). f and g Potentiated P-selectin exposure and fibrinogen (Fg) binding of platelets induced by the E protein were diminished by FA6-152 (n = 4). P-selectin exposure and binding of Fg to platelets were measured with or without stimulation of thrombin (0.05 U/ml). h FA6-152 suppressed the E protein-enhanced human platelet spreading on Fg (n = 4). Platelets were allowed to spread on immobilized Fg at 37 °C for 1 h. Areas (pixel numbers) of 3 random fields of spreading platelets were quantified (n = 4). i Accelerated clot retraction in response to thrombin promoted by the E protein was abolished by FA6-152 (n = 4). Quantification of clot retraction at 20, 40, and 60 min. jl Western blot analysis showed that FA6-152 (10 μg/ml) diminished the increased phosphorylation of p38 and NF-κB promoted by the E protein (2 μg/ml) in response to ADP (10 μM) (n = 4). The molecular weight markers are shown (b, c, j). Data were analyzed by 1-way ANOVA with Tukey multiple-comparisons test (eh, k, l) or 2-way ANOVA with Tukey multiple-comparisons test (i). Data are presented as mean ± SEM. Source data are provided as a Source Data file.
Fig. 6
Fig. 6. CD36 deficiency or CD36 blockade in vivo attenuates E protein-enhanced thrombosis.
a Levels of CD36 in wild-type (WT) and CD36/ mouse platelets. Results were confirmed in three independent experiments using platelets from different mice. b and c WT and CD36/ mice were intravenously injected with the E protein (4 μg per mouse) or PBS 4 h before the pulmonary embolism (PE) model. b Quantification of the numbers of lung embolisms per visual field on lung sections. Data are mean ± SD of 25 counts from 5 mice in each group. c Representative field on lung sections by hematoxylin-eosin (HE) staining from WT and CD36/ mice injected with the E protein or PBS. Scale bar = 100 μm. d and e Inferior vena cava (IVC) stenosis model was performed in WT and CD36/ mice. WT and CD36/ mice were pretreated with the E protein (4 μg per mouse) or PBS. d Representative image of the IVC thrombi. e The quantification analysis of the thrombi weight (n = 5). f and g WT mice were intraperitoneally injected with 10 mg/kg SB203580 or DMSO. After 2 h, mice were intravenously infused with the E protein (4 μg per mouse) or PBS, and then the IVC models were applied (n = 5). h Aggregation enhanced by the E protein was attenuated in CD36/ mice platelets in response to ADP (n = 4). Platelets from WT and CD36/ mice were incubated with the E protein or PBS for 5 min at 37 °C, followed by stimulation with ADP. i The promoting effects of the E protein on platelet spreading were abolished in CD36/ mouse platelets (n = 4). Data were shown with quantification analysis of the areas of spreading platelets (pixel numbers) at 20, 40, and 60 min. j Potentiated clot retraction induced by the E protein was suppressed in CD36/ mouse platelets (n = 4). km The phosphorylation levels of p38 and NF-κB were decreased in E-treated CD36/ mouse platelets induced by ADP compared to E-treated WT mouse platelets (n = 4). The molecular weight markers are shown (k). Data were analyzed by the Kruskal–Wallis test (b, e, g), or 2-way ANOVA with Tukey multiple-comparisons test (hj, l, m). Data are presented as mean ± SD (b, e, g) or mean ± SEM (hj, l, m). Source data are provided as a Source Data file.

Similar articles

Cited by

References

    1. Guan WJ, et al. Clinical characteristics of coronavirus disease 2019 in China. N. Engl. J. Med. 2020;382:1708–1720. doi: 10.1056/NEJMoa2002032. - DOI - PMC - PubMed
    1. WHO. WHO coronavirus disease (COVID-19) dashboard. 2022. https://covid19.who.int/ (accessed September 17, 2022).
    1. Huang C, et al. Clinical features of patients infected with 2019 novel coronavirus in Wuhan, China. Lancet. 2020;395:497–506. doi: 10.1016/S0140-6736(20)30183-5. - DOI - PMC - PubMed
    1. Tang N, Li D, Wang X, Sun Z. Abnormal coagulation parameters are associated with poor prognosis in patients with novel coronavirus pneumonia. J. Thromb. Haemost. 2020;18:844–847. doi: 10.1111/jth.14768. - DOI - PMC - PubMed
    1. Helms J, et al. High risk of thrombosis in patients with severe SARS-CoV-2 infection: a multicenter prospective cohort study. Intensive Care Med. 2020;46:1089–1098. doi: 10.1007/s00134-020-06062-x. - DOI - PMC - PubMed

Publication types