. 2023 Aug 21;13(1):10342.
doi: 10.1038/s41598-023-36788-9.

The non-classical major histocompatibility complex II protein SLA-DM is crucial for African swine fever virus replication

Affiliations

The non-classical major histocompatibility complex II protein SLA-DM is crucial for African swine fever virus replication

Katrin Pannhorst et al. Sci Rep. .

Abstract

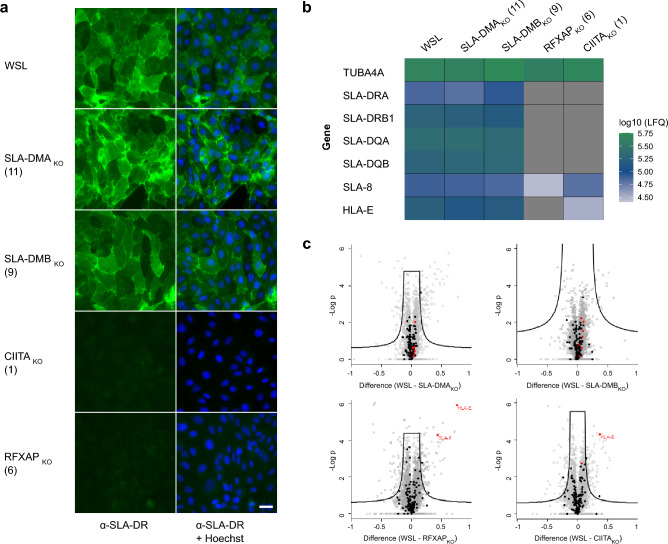
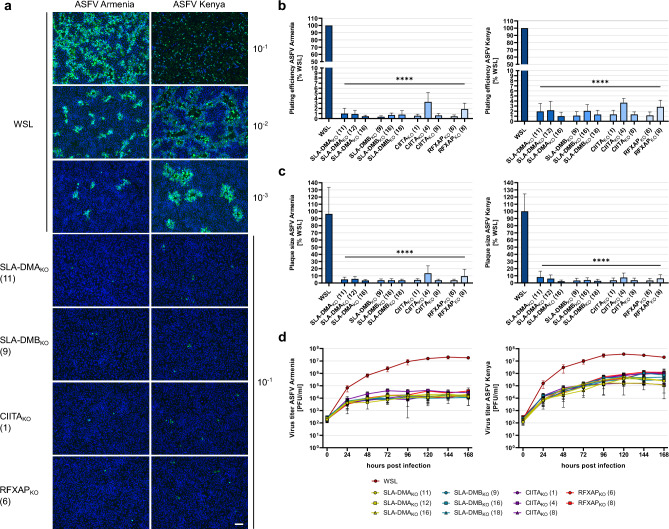
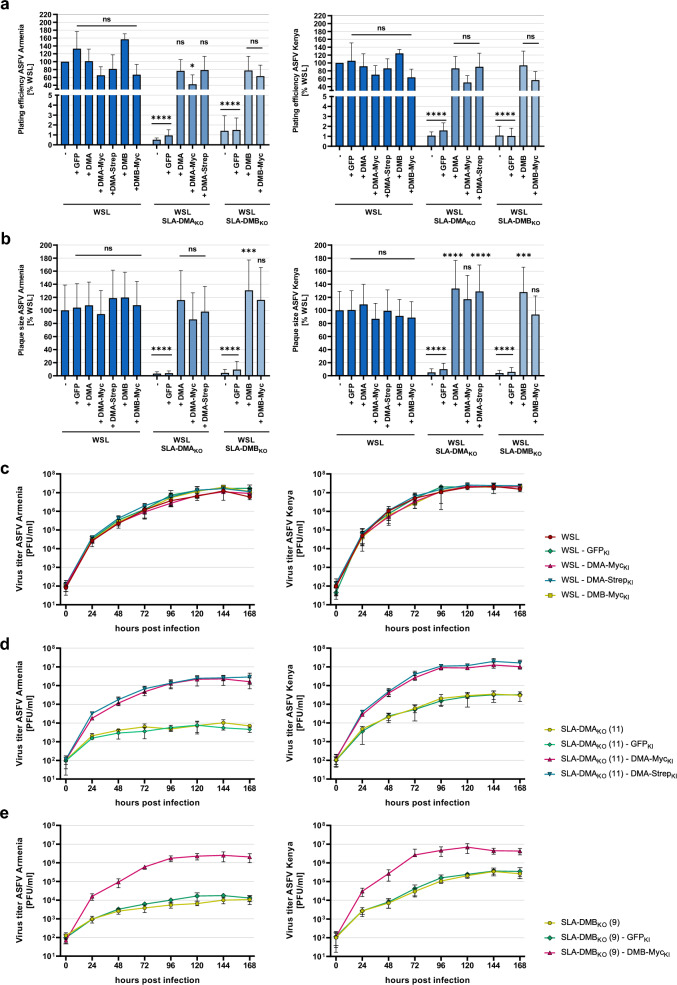
African swine fever virus (ASFV) is a lethal animal pathogen that enters its host cells through endocytosis. So far, host factors specifically required for ASFV replication have been barely identified. In this study a genome-wide CRISPR/Cas9 knockout screen in porcine cells indicated that the genes RFXANK, RFXAP, SLA-DMA, SLA-DMB, and CIITA are important for productive ASFV infection. The proteins encoded by these genes belong to the major histocompatibility complex II (MHC II), or swine leucocyte antigen complex II (SLA II). RFXAP and CIITA are MHC II-specific transcription factors, whereas SLA-DMA/B are subunits of the non-classical MHC II molecule SLA-DM. Targeted knockout of either of these genes led to severe replication defects of different ASFV isolates, reflected by substantially reduced plating efficiency, cell-to-cell spread, progeny virus titers and viral DNA replication. Transgene-based reconstitution of SLA-DMA/B fully restored the replication capacity demonstrating that SLA-DM, which resides in late endosomes, plays a crucial role during early steps of ASFV infection.


Conflict of interest statement

K.P., W.F., F.G., and J.K.B., are inventors on a pending patent application related to this work. The other authors declare that they have no competing interests.

Figures

Figure 1
Figure 1
Genome-wide CRISPR/Cas9 knockout screens identified molecules of the MHC II pathway as relevant for ASFV replication. (a) Diagrams of robust rank aggregation (RRA) scores calculated by the MAGeCK algorithm software of four separate analyses determined in two independent screens. The sgRNA content of the control cells was compared to the sgRNA abundance of cells that survived four subsequent ASFV infections. (b) Mean (−) and single RRA scores of the individual gene hits in the four different analyses. Dark blue dots represent sgRNAs against the indicated genes (x-axis) found in 4/4 subsets. Medium light blue dots represent the sgRNAs against gene CCZ1 which were found in 3/4 subsets. Light blue dots show sgRNAs which were only found in the 2 subsets of either of the performed screens. (c) Schematic of an MHC II gene locus (e.g. for SLA-DMA or SLA-DMB) with the MHC class II specific regulatory SXY module and specific transcription factors. Proteins which were identified as crucial cellular factor for ASFV infection in the genome-wide CRISPR/Cas9 knockout screen are shown in blue.
Figure 2
Figure 2
Parental WSL and WSL knockout cells differ in the expression of MHC II proteins. (a) Indirect immunofluorescence analyses of cell surface expression of SLA-DR in WSL, WSL SLA-DMAKO, WSL SLA-DMBKO, WSL CIITAKO and WSL RFXAPKO cell clones. Bar: 30 µm. (b) Mass spectrometry analysis of quantitative expression levels of the housekeeping gene α-tubulin (TUBA4A-ENSSSCG00000016216), of genes of the MHC II pathway (SLA-DRA-ENSSSCG00000001453, SLA-DRB1-ENSSSCG00000001455, SLA-DQA-ENSSSCG00000001456, SLA-DQB-ENSSSCG00000001457), and of the MHC I pathway (SLA-8-ENSSSCG00000001231, HLA-E-ENSSSCG00000001229) in WSL and indicated knockout cells based on label-free quantitation (LFQ). Data represent means of three replicates. Grey panels indicate that the respective proteins were not detected. (c) Comparative quantitative analysis of protein expression levels in WSL and individual WSLKO cell clones. Proteins are indicated by dots. Black dots represent proteins involved in antigen processing and presentation. As far as detected, the SLA I/II proteins shown in b are highlighted in red.
Figure 3
Figure 3
ASFV replication in WSL knockout cells is impaired. (a) Visualization of ASFV Armenia or ASFV Kenya-infected WSL and WSLKO cells (green) and nucleic acids (blue) by immunofluorescence staining. Representative images of the indicated cell clones infected with different virus dilutions (10–1 to 10–3) to illustrate plating efficiency and plaque sizes. Bar: 100 µm. (b) Plating efficiency of ASFV Armenia and ASFV Kenya was calculated by counting ASFV-infected cells or plaques in three independent experiments (n = 3). Mean relative apparent titers (%) compared to those on WSL cells and standard deviations are shown. Significant differences were calculated by ordinary one-way ANOVA followed by Tukey’s multiple comparison test. **** = p < 0.0001. (c) For the determination of plaque sizes, areas of fifty plaques per cell line from three independent experiments (n = 150) were measured, and the mean relative areas (%) compared to WSL cells including standard deviations are shown. Significant differences were calculated by Kruskal–Wallis test followed by Dunn’s multiple comparison test. **** = p < 0.0001. (d) Multi step (MOI 0.02) growth curve analysis of ASFV Armenia or Kenya in WSL and WSLKO cells. Shown are the mean results of three independent experiments (n = 3) with standard deviations.
Figure 4
Figure 4
ASFV DNA replication is inhibited in WSL knockout cells. Parental WSL and WSLKO cells were infected with ASFV Armenia at a MOI of 3 and after indicated times the amounts of ASFV DNA were quantified by real-time qPCR targeting the viral B646L gene. Genome copy numbers were determined using plasmid standards. Graphs represent means of two biological replicates with standard deviations.
Figure 5
Figure 5
ASFV progeny virus particles are detected in infected parental WSL cells but not in knockout cells. (ad) WSL, (e) WSL SLA-DMAKO, and (f) WSL CIITAKO cells were fixed and analyzed by electron microscopy 16 h after infection with ASFV Armenia at a MOI of 5. Virus factories (arrow), intracellular (*) and extracellular virus particles (#) are indicated. Bars represent 1 µm (a, e, f), or 200 nm (b, c, d).
Figure 6
Figure 6
WSL knockout/knockin cells express MHC II transgenes. Lysates of (a) WSL SLA-DMAKO cells and (b) WSL cells expressing indicated SLA-DMA transgenes or GFP, or lysates of (c) SLA-DMBKO cells and (d) WSL cells expressing indicated SLA-DMB transgenes or GFP were separated by SDS-PAGE, transferred to nitrocellulose membranes and probed with antibodies against the indicated proteins or protein tags. Molecular masses of marker proteins (in kDa) are indicated on the left. Original blots are presented in Supplementary Fig. 6a–d.
Figure 7
Figure 7
MHC II transgene expression in WSL knockout/knockin cells restored ASFV replication. (a, b) For the determination of plating efficiency and plaque size ASFV Armenia or ASFV Kenya-infected WSL, WSLKO and WSLKO/KI cells were visualized by immunofluorescence staining. (a) Plating efficiency of ASFV Armenia and ASFV Kenya was calculated by counting ASFV-infected cells or plaques in three independent experiments (n = 6). Shown are the mean relative (%) titers compared to those on WSL cells, and standard deviations. Significant differences were calculated by ordinary one-way ANOVA followed by Tukey’s multiple comparison test. * = p < 0.05, **** = p < 0.0001, ns = not significant. (b) For the determination of plaque sizes, areas of fifty plaques per cell line from three independent experiments (n = 150) were measured and the mean relative (%) sizes compared to WSL cells including standard deviations are shown. Significant differences were calculated by Kruskal–Wallis test followed by Dunn’s multiple comparison test. *** = p < 0.001, **** = p < 0.0001, ns = not significant. (ce) Multi step (MOI 0.02) growth analysis of ASFV Armenia and Kenya in untreated and transgene-expressing lentivirus-transduced (c) WSL, (d) WSL-DMAKO, and (e) WSL-DMBKO cells. Shown are the mean results of two independent experiments with two replicates (n = 4) and standard deviations.

References

    1. Blome S, Gabriel C, Beer M. Pathogenesis of African swine fever in domestic pigs and European wild boar. Virus Res. 2013;173:122–130. doi: 10.1016/j.virusres.2012.10.026. - DOI - PubMed
    1. Gavier-Widen D, Stahl K, Dixon L. No hasty solutions for African swine fever. Science. 2020;367:622–624. doi: 10.1126/science.aaz8590. - DOI - PubMed
    1. Dixon LK, Stahl K, Jori F, Vial L, Pfeiffer DU. African swine fever epidemiology and control. Annu. Rev. Anim. Biosci. 2020;8:221–246. doi: 10.1146/annurev-animal-021419-083741. - DOI - PubMed
    1. Montgomery R. On a form of swine fever occurring in British East Africa (Kenya Colony) J. Comp. Pathol. Ther. 1921;34:159–191. doi: 10.1016/s0368-1742(21)80031-4. - DOI
    1. Mulumba-Mfumu LK, et al. African swine fever: Update on Eastern, Central and Southern Africa. Transbound. Emerg. Dis. 2019;66:1462–1480. doi: 10.1111/tbed.13187. - DOI - PubMed

Publication types