

Comparison of the effects of use, protection, improper renovation and removal of asbestos products on the example of typical old office buildings in Poland
- PMID: 37604849
- PMCID: PMC10442424
- DOI: 10.1038/s41598-023-37257-z
Comparison of the effects of use, protection, improper renovation and removal of asbestos products on the example of typical old office buildings in Poland
Abstract
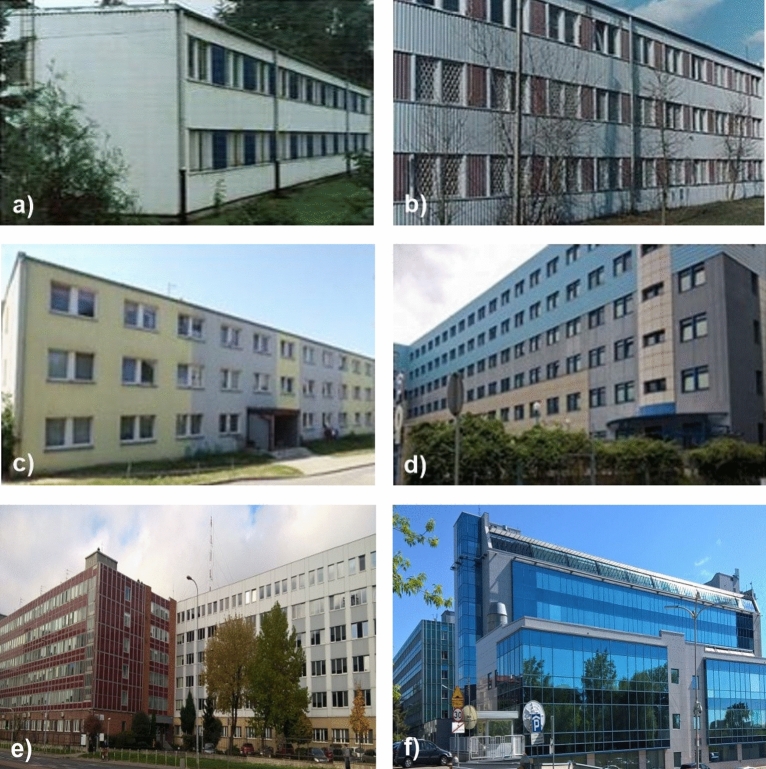
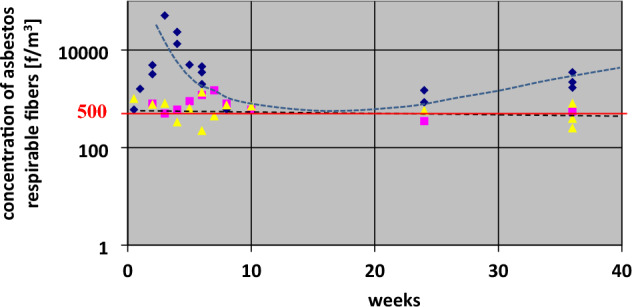
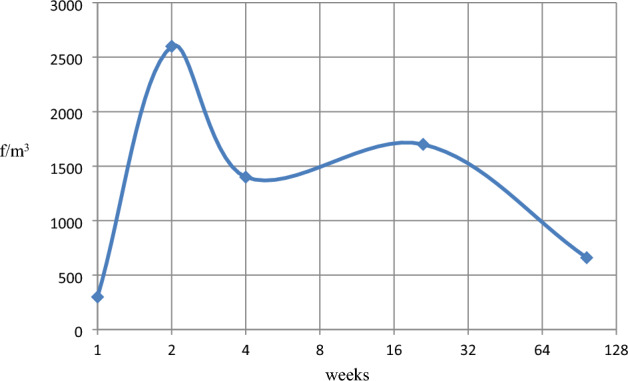
The study focused on old, German building types "LIPSK" and "BERLIN" used in Poland, since the 1960s in Eastern Europe. The different operations on buildings were analysed: protection and maintenance of asbestos products, asbestos removal and inadvertent damage to asbestos as a result of building renovation. Measurements of respirable (countable) asbestos fibres in the air were carried out using the PCOM + PLM method and SEM-EDS. In the case of the accidental destruction of products, initial contamination was ≈7000 f/m3. After 16 weeks from the end of the activity and 20 days of extreme ventilation, contamination decreased to about 500 f/m3. At the same time, in similar rooms, without extreme ventilation, the pollution was above 4000 f/m3. The average increase in pollution in a dozen or so similar buildings, after asbestos removal in places beyond the work zones, ranged from ≈ 1700-2700 f/m3 and lasted for one or two years. These buildings, used without ACM destruction or after product impregnation, have maintained low asbestos contamination < 300 f/m3 for more than 10-20 years. So, due to the easy release of asbestos that occurs with any ACM removal and the increased risk of occupant exposure, these works are often inappropriate for the buildings in question.
© 2023. Springer Nature Limited.
Conflict of interest statement
The author declares no competing interests.
Figures
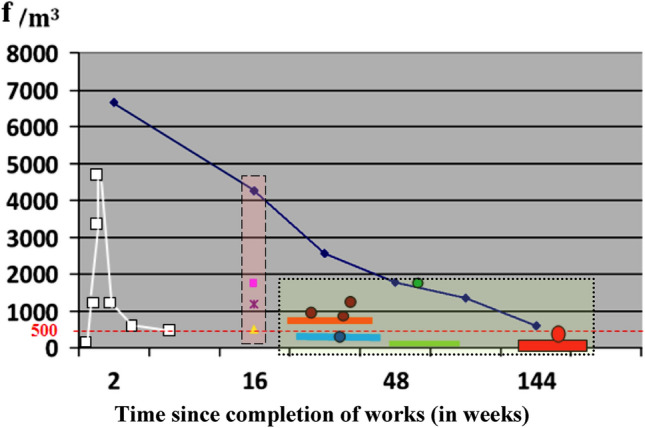
 Renovated rooms after prolonged intensive ventilation.
  Rooms with damaged ACM-s, not renovated, in use.
  Renovated rooms not in use.
 Renovated rooms, normally used from two weeks to three years after completion of work.
  The trend of contamination changes. Building type “MOA” no. 11 During the wrong demolition:
  Single measured result in the average room.
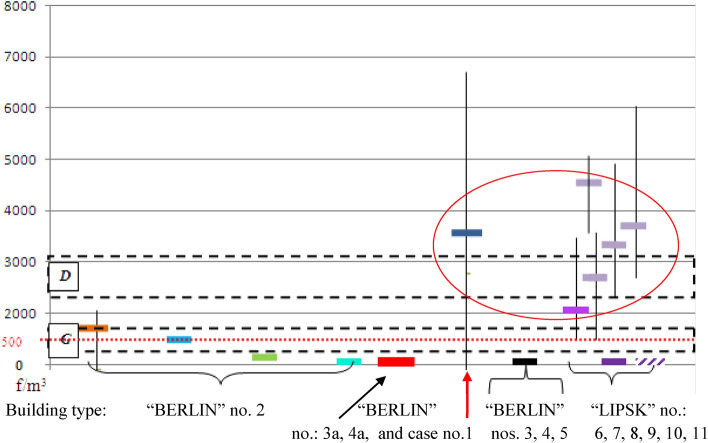
  The trend of changes in pollution. Building “BERLIN” no. 2 A properly renovated and the others, without renovation, nos. 3, 4, 5, 3a and 4a:
  Average air analysis results for the entire building in 2002 (before renovation). Use without ACM restrictions.
  Apartment No 19.
  Average air analysis results for the entire building in 2006 (1 year after renovation).
  Apartment no. 19.
  Average air analysis results for the entire building in 2015 (10 years after renovation).
  Apartment No 19. Analysis containing the premises in which the owner, after renovation, in 2006 rearranged the internal walls on his own (in Table 3 these are the values of 1300 and 1800 f/m3).
  Average air analysis results for the entire building in 2022 measured results in average room analyzed in optical microscopy and SEM—EDS method (10 measurements).
  Buildings type “BERLIN” no. 3, 4, 5—not renovated, good condition of ACM. Average air analysis.
  Buildings type “BERLIN” no. 3a, 4a,—not renovated, different condition of ACM, local minor damage. Average air analysis.
  Average pollution in rooms with the greatest usable damage of external walls. Buildings “LIPSK” nos. 6 – 11:
  Building type “LIPSK” no. 6, average air analysis results after correct preservation of ACM-s.
  Building type “LIPSK” no. 8–10, average air analysis results outside of leaky work zones during asbestos removal in these zones.
  Building type “LIPSK” no. 11, average air analysis result in rooms during asbestos removal in building no 7. Both buildings are connected and were separated during renovation.
  Building type “LIPSK” no. 7, average air analysis result in rooms, 10 month after finished asbestos removal and final cleaning of all the building.
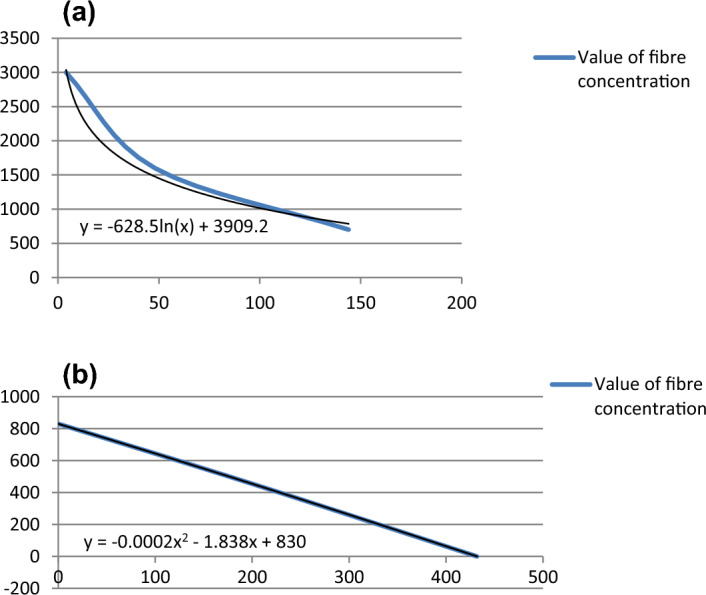
Similar articles
-
Pollution of the environment and building interiors during asbestos removal as a result of lack of negative pressure in the working areas.Sci Rep. 2024 Sep 11;14(1):21185. doi: 10.1038/s41598-024-70631-z. Sci Rep. 2024. PMID: 39261502 Free PMC article.
-
[Exposure to respirable asbestos fibers at various stage of asbestos removal work].Med Pr. 2012;63(2):191-8. Med Pr. 2012. PMID: 22779325 Polish.
-
The natural reduction of threat in selected systems of old buildings containing asbestos.Sci Rep. 2022 Feb 16;12(1):2580. doi: 10.1038/s41598-021-04487-y. Sci Rep. 2022. PMID: 35173172 Free PMC article.
-
Asbestos in the air of public buildings: a public health risk?Prev Med. 1994 Jan;23(1):119-25. doi: 10.1006/pmed.1994.1017. Prev Med. 1994. PMID: 8016027 Review.
-
Asbestos exposure in buildings.Clin Chest Med. 1992 Jun;13(2):231-42. Clin Chest Med. 1992. PMID: 1511551 Review.
Cited by
-
Pollution of the environment and building interiors during asbestos removal as a result of lack of negative pressure in the working areas.Sci Rep. 2024 Sep 11;14(1):21185. doi: 10.1038/s41598-024-70631-z. Sci Rep. 2024. PMID: 39261502 Free PMC article.
References
-
- Al-Sareji OJ, Grmasha RA, et al. Personal exposure and inhalation doses to PM1 and PM2.5 pollution in Iraq: An examination of four transport modes. Build. Environ. 2022;212:108847. doi: 10.1016/j.buildenv.2022.108847. - DOI
-
- Grmasha RA, et al. Polycyclic aromatic hydrocarbons (PAHs) in urban street dust within three land-uses of Babylon governorate, Iraq: Distribution, sources, and health risk assessment. J. King Saud Univ. Eng. Sci. 2022;34(4):231–239. doi: 10.1016/j.jksues.2020.11.002. - DOI
-
- Al-Sareji OJ, Grmasha RA, Salman JM, Hashim KS. Street dust contamination by heavy metals in Babylon governorate, Iraq. J. Eng. Sci. Technol. 2021;16(1):455–469.
LinkOut - more resources
Full Text Sources
