

Feature-aware unsupervised lesion segmentation for brain tumor images using fast data density functional transform
- PMID: 37604860
- PMCID: PMC10442428
- DOI: 10.1038/s41598-023-40848-5
Feature-aware unsupervised lesion segmentation for brain tumor images using fast data density functional transform
Abstract
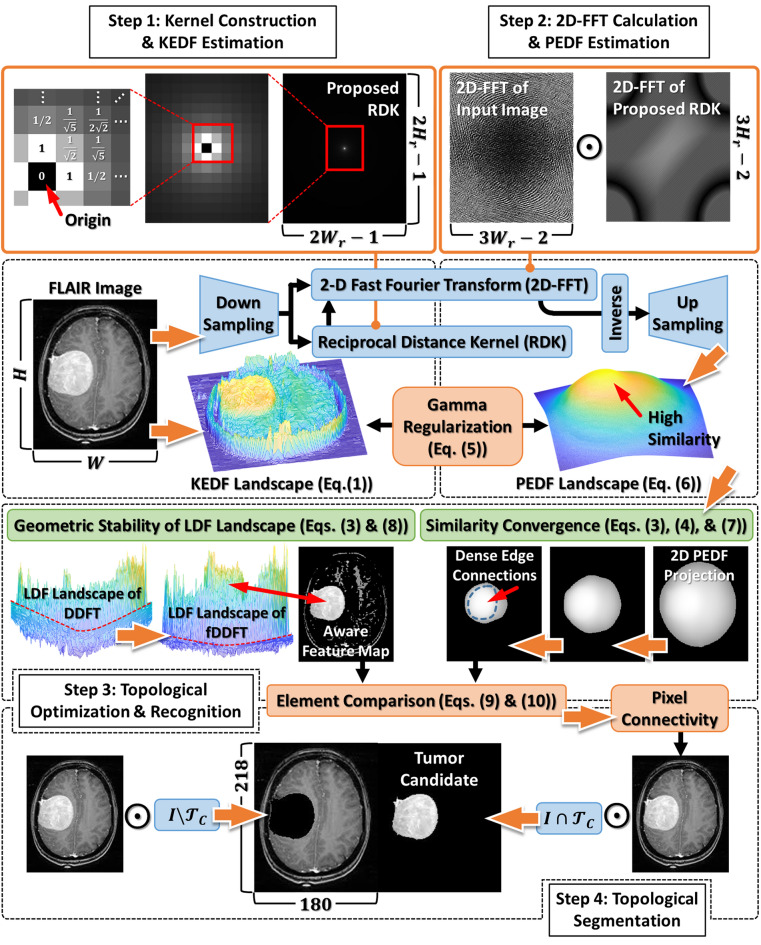
We demonstrate that isomorphically mapping gray-level medical image matrices onto energy spaces underlying the framework of fast data density functional transform (fDDFT) can achieve the unsupervised recognition of lesion morphology. By introducing the architecture of geometric deep learning and metrics of graph neural networks, gridized density functionals of the fDDFT establish an unsupervised feature-aware mechanism with global convolutional kernels to extract the most likely lesion boundaries and produce lesion segmentation. An AutoEncoder-assisted module reduces the computational complexity from [Formula: see text] to [Formula: see text], thus efficiently speeding up global convolutional operations. We validate their performance utilizing various open-access datasets and discuss limitations. The inference time of each object in large three-dimensional datasets is 1.76 s on average. The proposed gridized density functionals have activation capability synergized with gradient ascent operations, hence can be modularized and embedded in pipelines of modern deep neural networks. Algorithms of geometric stability and similarity convergence also raise the accuracy of unsupervised recognition and segmentation of lesion images. Their performance achieves the standard requirement for conventional deep neural networks; the median dice score is higher than 0.75. The experiment shows that the synergy of fDDFT and a naïve neural network improves the training and inference time by 58% and 51%, respectively, and the dice score raises to 0.9415. This advantage facilitates fast computational modeling in interdisciplinary applications and clinical investigation.
© 2023. Springer Nature Limited.
Conflict of interest statement
The authors declare no competing interests.
Figures

Similar articles
-
Global-Local Feature Fusion Network Based on Nonlinear Spiking Neural Convolutional Model for MRI Brain Tumor Segmentation.Int J Neural Syst. 2025 Aug;35(8):2550036. doi: 10.1142/S0129065725500364. Epub 2025 Apr 28. Int J Neural Syst. 2025. PMID: 40289786
-
Development and Validation of a Convolutional Neural Network Model to Predict a Pathologic Fracture in the Proximal Femur Using Abdomen and Pelvis CT Images of Patients With Advanced Cancer.Clin Orthop Relat Res. 2023 Nov 1;481(11):2247-2256. doi: 10.1097/CORR.0000000000002771. Epub 2023 Aug 23. Clin Orthop Relat Res. 2023. PMID: 37615504 Free PMC article.
-
Implementation of biomedical segmentation for brain tumor utilizing an adapted U-net model.Comput Biol Med. 2025 Aug;194:110531. doi: 10.1016/j.compbiomed.2025.110531. Epub 2025 Jun 11. Comput Biol Med. 2025. PMID: 40505287
-
The Black Book of Psychotropic Dosing and Monitoring.Psychopharmacol Bull. 2024 Jul 8;54(3):8-59. Psychopharmacol Bull. 2024. PMID: 38993656 Free PMC article. Review.
-
Transformers for Neuroimage Segmentation: Scoping Review.J Med Internet Res. 2025 Jan 29;27:e57723. doi: 10.2196/57723. J Med Internet Res. 2025. PMID: 39879621 Free PMC article.
Cited by
-
Deep superpixel generation and clustering for weakly supervised segmentation of brain tumors in MR images.BMC Med Imaging. 2024 Dec 18;24(1):335. doi: 10.1186/s12880-024-01523-x. BMC Med Imaging. 2024. PMID: 39695438 Free PMC article.
References
-
- Rajinikanth V, Satapathy SC, Fernandes SL, Nachiappan S. Entropy based segmentation of tumor from brain MR images – A study with teaching learning based optimization. Pattern Recognit. Lett. 2017;94:87–95. doi: 10.1016/j.patrec.2017.05.028. - DOI
-
- Su Z-J, et al. Attention U-net with dimension-hybridized fast data density functional theory for automatic brain tumor image segmentation. In: Crimi A, Bakas S, et al., editors. Lecture Notes in Computer Science. Springer Nature Switzerland; 2021.
-
- Bronstein MM, et al. Geometric deep learning: Going beyond Euclidean data. IEEE Signal Process. Mag. 2017;34:18–42. doi: 10.1109/MSP.2017.2693418. - DOI
Publication types
MeSH terms
LinkOut - more resources
Full Text Sources
Medical
